
BioMed Central
Page 1 of 15
(page number not for citation purposes)
Respiratory Research
Open Access
Research
Influence of the cystic fibrosis transmembrane conductance
regulator on expression of lipid metabolism-related genes in
dendritic cells
Yaqin Xu†1, Christine Tertilt†2,4, Anja Krause2, Luis EN Quadri3,
Ronald G Crystal2 and Stefan Worgall*1,2
Address: 1Department of Pediatrics, Weill Cornell Medical College, New York, USA, 2Department of Genetic Medicine, Weill Cornell Medical
College, New York, USA, 3Department of Microbiology and Immunology, Weill Cornell Medical College, New York, USA and 4Department of
Immunology, Johannes Gutenberg University, Mainz, Germany
Email: Yaqin Xu - yax2002@med.cornell.edu; Christine Tertilt - ctertilt@yahoo.de; Anja Krause - ank2006@med.cornell.edu;
Luis EN Quadri - leq2001@med.cornell.edu; Ronald G Crystal - rgcryst@med.cornell.edu; Stefan Worgall* - stw2006@med.cornell.edu
* Corresponding author †Equal contributors
Abstract
Background: Cystic fibrosis (CF) is caused by mutations in the cystic fibrosis transmembrane
conductance regulator (CFTR) gene. Infections of the respiratory tract are a hallmark in CF. The
host immune responses in CF are not adequate to eradicate pathogens, such as P. aeruginosa.
Dendritic cells (DC) are crucial in initiation and regulation of immune responses. Changes in DC
function could contribute to abnormal immune responses on multiple levels. The role of DC in CF
lung disease remains unknown.
Methods: This study investigated the expression of CFTR gene in bone marrow-derived DC. We
compared the differentiation and maturation profile of DC from CF and wild type (WT) mice. We
analyzed the gene expression levels in DC from naive CF and WT mice or following P. aeruginosa
infection.
Results: CFTR is expressed in DC with lower level compared to lung tissue. DC from CF mice
showed a delayed in the early phase of differentiation. Gene expression analysis in DC generated
from naive CF and WT mice revealed decreased expression of Caveolin-1 (Cav1), a membrane lipid
raft protein, in the CF DC compared to WT DC. Consistently, protein and activity levels of the
sterol regulatory element binding protein (SREBP), a negative regulator of Cav1 expression, were
increased in CF DC. Following exposure to P. aeruginosa, expression of 3-hydroxysterol-7
reductase (Dhcr7) and stearoyl-CoA desaturase 2 (Scd2), two enzymes involved in the lipid
metabolism that are also regulated by SREBP, was less decreased in the CF DC compared to WT
DC.
Conclusion: These results suggest that CFTR dysfunction in DC affects factors involved in
membrane structure and lipid-metabolism, which may contribute to the abnormal inflammatory
and immune response characteristic of CF.
Published: 3 April 2009
Respiratory Research 2009, 10:26 doi:10.1186/1465-9921-10-26
Received: 11 November 2008
Accepted: 3 April 2009
This article is available from: http://respiratory-research.com/content/10/1/26
© 2009 Xu et al; licensee BioMed Central Ltd.
This is an Open Access article distributed under the terms of the Creative Commons Attribution License (http://creativecommons.org/licenses/by/2.0),
which permits unrestricted use, distribution, and reproduction in any medium, provided the original work is properly cited.

Respiratory Research 2009, 10:26 http://respiratory-research.com/content/10/1/26
Page 2 of 15
(page number not for citation purposes)
Introduction
Cystic fibrosis (CF) is caused by mutations in the cystic
fibrosis transmembrane conductance regulator (CFTR)
gene, a member of the ATP-binding cassette (ABC) pro-
tein family that functions as a cAMP-dependent chloride
channel [1-4]. ABC transport proteins play important
roles in a variety of tissues including lung, liver, pancreas
and the immune system[2]. Although CF is primarily
thought to be a disease of abnormal salt and fluid trans-
port caused by the defective chloride channel function of
the CFTR protein, dominant additional features of defec-
tive CFTR include an exaggerated inflammatory response
and susceptibility to microbial colonization in the lung,
particularly with P. aeruginosa [5-7]. The exact mechanism
for this is not completely understood. Overall in CF, host
immune responses do not seem to be adequate to eradi-
cate P. aeruginosa from the respiratory tract. Attention in
this regard has been primarily focused on the role of CFTR
in epithelial cells [8-10]. However, functional expression
of CFTR has been demonstrated in a variety of non-epithe-
lial cells, including lymphocytes, neutrophils, monocytes,
macrophages and endothelial cells [11-15]. The wide-
spread distribution of CFTR expression in non-epithelial
cells and cells of the immune system implies a variety of
functions, including a possible regulatory role in the
secretion of cytokines and antibodies by lymphocytes and
regulation of lipopolysaccharide (LPS) and interferon--
induced macrophage activation[15,16]. In murine alveo-
lar macrophages CFTR-expression is related to lysosomal
acidification and intracellular killing of P. aeruginosa [15],
and macrophages directly contribute to the exaggerated
inflammatory response in CFTR knockout mice [17]. The
interaction of the CF-specific infectious organisms with
cells of the host immune system are likely important in
determining the extent of the inflammatory responses and
the subsequent clearance of the bacteria from the airways
[6,18,19].
Abnormalities in the lipid metabolism have been
described in CF patients [20], and have been suggested to
be related to the inflammatory responses in CF [19-21].
Deficiency of essential fatty acids is thought to be prima-
rily a result of defective intestinal fat absorption secondary
to a deficiency of pancreatic lipase due to obstruction of
the pancreatic ducts [20]. It has furthermore been sug-
gested that mutant CFTR plays a role in cellular essential
fatty acid utilization [20,22]. The misassembled
deltaF508 CFTR leads to altered cellular lipid trafficking in
the distal secretory pathway [21]. Localization of CFTR to
lipid rafts, cellular lipid membrane domains that are
enriched cholesterol and sphingolipids, has been
described following infection with P. aeruginosa, and has
been linked to inflammatory signaling and apoptosis [23-
25].
The present study analyzed dendritic cells (DC) derived
from CF and WT mice. DC are the most potent antigen
presenting cells and are crucial in the initiation and regu-
lation of immune responses [26-29]. Changes in DC func-
tion could contribute to abnormal immune responses on
multiple levels, such as antigen processing and presenta-
tion, expression of costimulatory molecules, and produc-
tion of cytokines [26-29]. The DC from CF mice were
delayed in their differentiation compared to the WT mice,
but were able to reach fully maturation after 8 days. Inter-
estingly, of the relatively few genes found to be down-reg-
ulated comparing CF and WT DC in gene expression
studies, was Caveolin-1 (Cav1), a lipid raft membrane
protein related to the cellular lipid metabolism. The pro-
tein expression and activity of the sterol regulatory ele-
ment binding protein (SREBP), a negative regulator of
Cav1 expression [30-32], was increased in CF DC com-
pared to WT DC. Among the genes showing expression
change comparing WT and CF DC upon P. aeruginosa
infection, were 3-hydroxysterol-7 reductase (Dhcr7)
and stearoyl-CoA desaturase 2 (Scd2), two enzymes
involved in the lipid metabolism that are also regulated
by SREBP [33-37]. This study provides insight into CFTR-
dependant gene expression abnormalities related to the
cellular lipid homeostasis in a non-epithelial cell type.
Materials and methods
Mice
Congenic C57BL/6J heterozygous breeding pairs
(Cftrtm1UNC) were maintained on regular mouse chow and
continuously bred. To maintain congenic status and pre-
vent genetic drift, each new generation of mice was bred
to WT C57BL/6J mice, obtained from Jackson Laborato-
ries (Bar Harbor, ME). Male and female WT (cftr+/+) ani-
mals were used in alternate breeding. Offspring were
genotyped at 14 days of age by PCR analysis of tail-clip
DNA. To minimize bowel obstruction and optimize long-
term viability, 21- to 23-day-old CF mice (C57BL/6J Cftr
tm1UNC/Cftrtm1UNC) and their cftr+/+ littermates were fed a
liquid diet (Water and Peptamen, Nestle Nutrition) pro-
vided ad libitum. All procedures were approved by the
Institutional Animal Care and Use Committee of Weill
Cornell Medical College.
Bone marrow-derived dendritic cells (DC)
DC, generated from mouse bone marrow precursors from
the three pair of CF mice and their WT littermates with age
5 to 6 wk old, were cultured in RPMI 1640 medium sup-
plemented with 10% fetal bovine serum (FBS), penicillin
(100 U/ml), streptomycin (100 g/ml) (Invitrogen Cor-
poration, CA), recombinant murine granulocyte-macro-
phage colony-stimulating factor (GM-CSF, 10 ng/ml;
R&D System, MN) and recombinant murine interleukin-4
(IL-4, 2 ng/ml; R&D System), for 8 days as previously

Respiratory Research 2009, 10:26 http://respiratory-research.com/content/10/1/26
Page 3 of 15
(page number not for citation purposes)
described [38]. DC represent the mature DC population
after differentiation for 8 days.
Aliquots of DC were harvested, and differentiation and
maturation profiles were analyzed on day 0, 2, 4, 6 and 8
for expression of CD11c and CD40, CD40L, CD80, CD86,
ICAM, MHCI or MHCII (BD Pharmingen, CA) by flow
cytometry (FACS Calibur, BD, CA). On day 8 more than
85% of the cells were mature DC. The assays have been
carried out at least three times.
DC Infection with P. aeruginosa
The P. aeruginosa strain used was the laboratory strain PAK
(kindly provided by A. Prince, Columbia University, NY).
Bacteria were grown from frozen stocks in tryptic soy
broth (Difco, MI) at 37°C to mid-log phase, washed three
times with phosphate buffered saline (PBS) pH 7.4 (Invit-
rogen Corporation), and resuspended in the infection
media at the desired concentration as determined by spec-
trophotometry. The DC were incubated for 4 h with 10
CFU of PAK per cell in RPMI 1640 supplemented with 25
mM Hepes (Biosource International, MD) and then har-
vested for RNA and protein extraction.
CFTR Expression in DC
RNA was extracted from lung and DC from three WT mice
using TRIzol (Invitrogen Corporation). Following reverse
transcription of 2 g RNA, CFTR mRNA was amplified by
real-time RT-PCR using a CFTR-specific probe
(Mm00445197_m1, Applied Biosystems, CA). The CFTR
mRNA levels were quantified using the Ct method
(Ambion, Instruction Manual) and normalized relative to
GAPDH (Applied Biosystems). The PCR reactions for
CFTR and GAPDH were optimized to have equal amplifi-
cation efficiency.
CFTR protein levels were determined by Western analysis.
Total cellular fractions were isolated from mouse lung and
DC. Following determination of protein concentration
(Micro BCA™ Protein Assay Kit; PIERCE, IL), 30 g protein
was separated by electrophoresis on NuPAGE@Novex 4–
12% Bis-Tris Gel (Invitrogen Corporation), transferred to
a polyvinylidene difluoride (PVDF) membrane (Bio-Rad
Laboratories, CA) and incubated with a rabbit anti-CFTR
antibody (1:200, Santa Cruz Biotech Inc., CA). Horserad-
ish Peroxidase-conjugated goat anti-rabbit IgG secondary
antibody (1: 3000, Bio-Rad Laboratories) and Amersham
ECL Plus Western Blotting System (GE Healthcare Bio-Sci-
ences Corp., NJ) were used for detection. Following scan-
ning, the membranes were stripped with stripping buffer
(100 mM 2-Mercaptoethanol, 2% SDS, 62.5 mM Tris-
HCl, pH 6.7) and re-blotted using a mouse anti-GAPDH
antibody (1:5000, Abcam Inc. MA). CFTR levels relative to
GAPDH levels were quantified using Image J software
[39]. The assays have been carried out at least three times.
Preparation of RNA for Microarray Analysis and
Processing of Microarrays
All analyses were carried out with the Affymetrix MG-
U74Av2 GeneChip using the protocols from Affymetrix
(Santa Clara, CA). DC were purified from six mice with
age 5 to 6 wk old. Total RNA was extracted from the DC
using TRIzol followed by RNeasy (Qiagen, CA) to remove
residual DNA. First strand cDNA was synthesized using
the T7-(dT)24 primer (sequence 5'-GGC CAG TGA ATT
GTA ATA CGA CTC ACT ATA GGG AGG CGG-(dT)24-3',
HPLC purified from Oligos Etc., OR) and converted to
double stranded cDNA using Superscript Choice system
(Life Technologies). Double stranded cDNA was purified
by phenol chloroform extraction and precipitation and
the size distribution assessed by agarose gel electrophore-
sis. This material was then used for synthesis of the bioti-
nylated RNA transcript using the BioArray HighYield
reagents (Enzo), purified by the RNeasy kit (Qiagen) and
fragmented immediately before use. The labeled cRNA
was first hybridized to the test chip and then, when satis-
factory, to the MG-U74Av2 GeneChip for 16 h. The Gene-
Chips were processed in the fluidics station under the
control of the Microarray Suite software (Affymetrix) to
receive the appropriate reagents and washed for detection
of hybridized biotinylated cRNA and then manually
transferred to the scanner for data acquisition.
Microarray Data Analysis
The image data on each individual microarray chip was
scaled to arbitrary target intensity, using the Microarray
Suite version 5.0 (MAS 5.0). The raw data was normalized
using the GeneSpring GX 7.3.1 software (Agilent Technol-
ogies, CA) by setting measurements <0.01 to 0.01, fol-
lowed by per-chip normalization to the 50th percentile of
the measurements for the array, and per-gene by normal-
izing to the median measurement for the gene across all
the arrays in the data set. Data from probe sets represent-
ing genes that failed the Affymetrix detection criterion
(labeled "Absent" or "A", or "Marginal" or "M") in over
90% of microarrays were eliminated from further assess-
ment. All further analyses were carried out on the remain-
ing 6,474 genes selected using this criterion.
Genes with significantly different expression levels in WT
and CF DC with and without infection with P. aeruginosa
were annotated using the NetAffx Analysis Center http://
www.affymetrix.com to retrieve the Gene Ontology (GO)
annotations from the National Center for Biotechnology
(NCBI) databases. For probe sets with no GO annota-
tions, other public databases [Mouse Protein Reference
Database, Kyoto Encyclopedia of Genes and Genomes
(KEGG), PubMed] were searched. These genes were
grouped into 8 subcategories: (1) immunity; (2) metabo-
lism/enzyme; (3) signal transduction/growth control; (4)

Respiratory Research 2009, 10:26 http://respiratory-research.com/content/10/1/26
Page 4 of 15
(page number not for citation purposes)
protein biosynthesis/cell adhesion; (5) cell cycle; (6) tran-
scription; (7) transport and (8) not classified genes.
Comparisons of the gene profile difference between WT
and CF naive DC, and DC following infection with P. aer-
uginosa were carried out using the normalized data using
the Welch's approximated t-test with Benjamini-Hoch-
berg multiple testing correction. This analysis was done
on the 6,474 genes that passed the Affymetrix detection
criterion (labeled " Present") in over 10% of the samples,
and genes were assumed to be significantly up-regulated
or down-regulated if the calculated p-value was < 0.05 and
the fold change was greater than 1.5 up or down. All data
was deposited at the Gene Expression Omnibus site http:/
/www.ncbi.nlm.nih.gov/geo/, a high-throughput gene
expression/molecular abundance data repository curated
by the National Center for Bioinformatics site. The acces-
sion number for the MG-U74Av2 data set is GSE9488.
Confirmation of Microarray Data by Real-time RT-PCR
Messenger RNA levels of CFTR, Cav1, Dhcr7 and Scd2
were confirmed using real-time quantitative RT-PCR,
using gene specific probes (CFTR: Mm00483057_m1,
Cav1: Mm00483057_m1, Dhcr7: Mm00514571_m1, and
Scd2: Mm01208542_m1, Applied Biosystems) on inde-
pendent samples. RNA levels were quantified by real-time
quantitative RT-PCR with fluorescent TaqMan chemistry
using the Ct method, as described above and normal-
ized to GAPDH mRNA. The assays have been carried out
at least three times.
To reconfirm the genotype of cDNA samples from CF and
WT DC, the primers mCF19 (exon10-11, 5'-TGGATCAG-
GAAAGACATCACTC-3') and mCF20 (exon 14, 5'-
TTGGCCATCAATTTACAAACA-3') were used for PCR
amplification. The reaction was amplified for 35 cycles at
94°C/30s (denature), 58°C/30s (annealing), and 72°C/
45s (extension). The GAPDH gene primers were used as
the PCR endogenous control (Applied Biosystem, CA).
The reaction was amplified for 35 cycles at 94°C/30s
(denature), 58°C/30s (annealing), and 72°C/30s (exten-
sion). PCR products were analyzed on 2% Agarose-LE gel
(Applied Biosystems), stained with ethidium bromide
and visualized under UV light.
Cav1 and SREBP Protein Expression
Total cellular fractions were isolated from naive DC and
DC infected with P. aeruginosa from three pair of CF and
WT mice. Cav1 and SREBP were determined by Western
analysis using a rabbit anti-Cav1 antibody (1:200, Santa
Cruz Biotech, Inc.) and a rabbit anti-SREBP antibody
(kindly provided by T. Worgall, Columbia University,
NY), detailed procedures as described above. Cav1 and
SREBP levels were normalized to GAPDH (mouse anti-
GAPDH, 1:5000, Abcam Inc). Cav1 and SREBP protein
levels relative to GAPDH levels were quantified using
Image J software [39]. The assays have been carried out at
least three times.
SRE Activity in CF DC
The transcriptional activity of SRE in CF DC was assessed
using an adenovirus vector expressing the SRE-promoter
of HMG-CoA synthase linked to a luciferase reporter gene
and -galactosidase gene (AdZ-SRE-luc) (kindly provided
by T. Worgall, Columbia University, NY) by luciferase
assay. The CF and WT DC were infected with AdZ-SRE-Luc
for 48 h, and then infected with P. aeruginosa for 4 h. Luci-
ferase and -galactosidase activities were analyzed in the
cell lysates by luminometric luciferase and -galactosidase
assays (both, Stratagene, CA). Luci-ferase activity (RLU)
was quantified by luminometer (Pharmingen) and -
galactosidase levels by microplate luminometer (Bio-Rad
Laboratories). The data is expressed as luciferase activity
(RLU) normalized to -galactosidase activity.
Results
CFTR Expression in DC from WT Mice
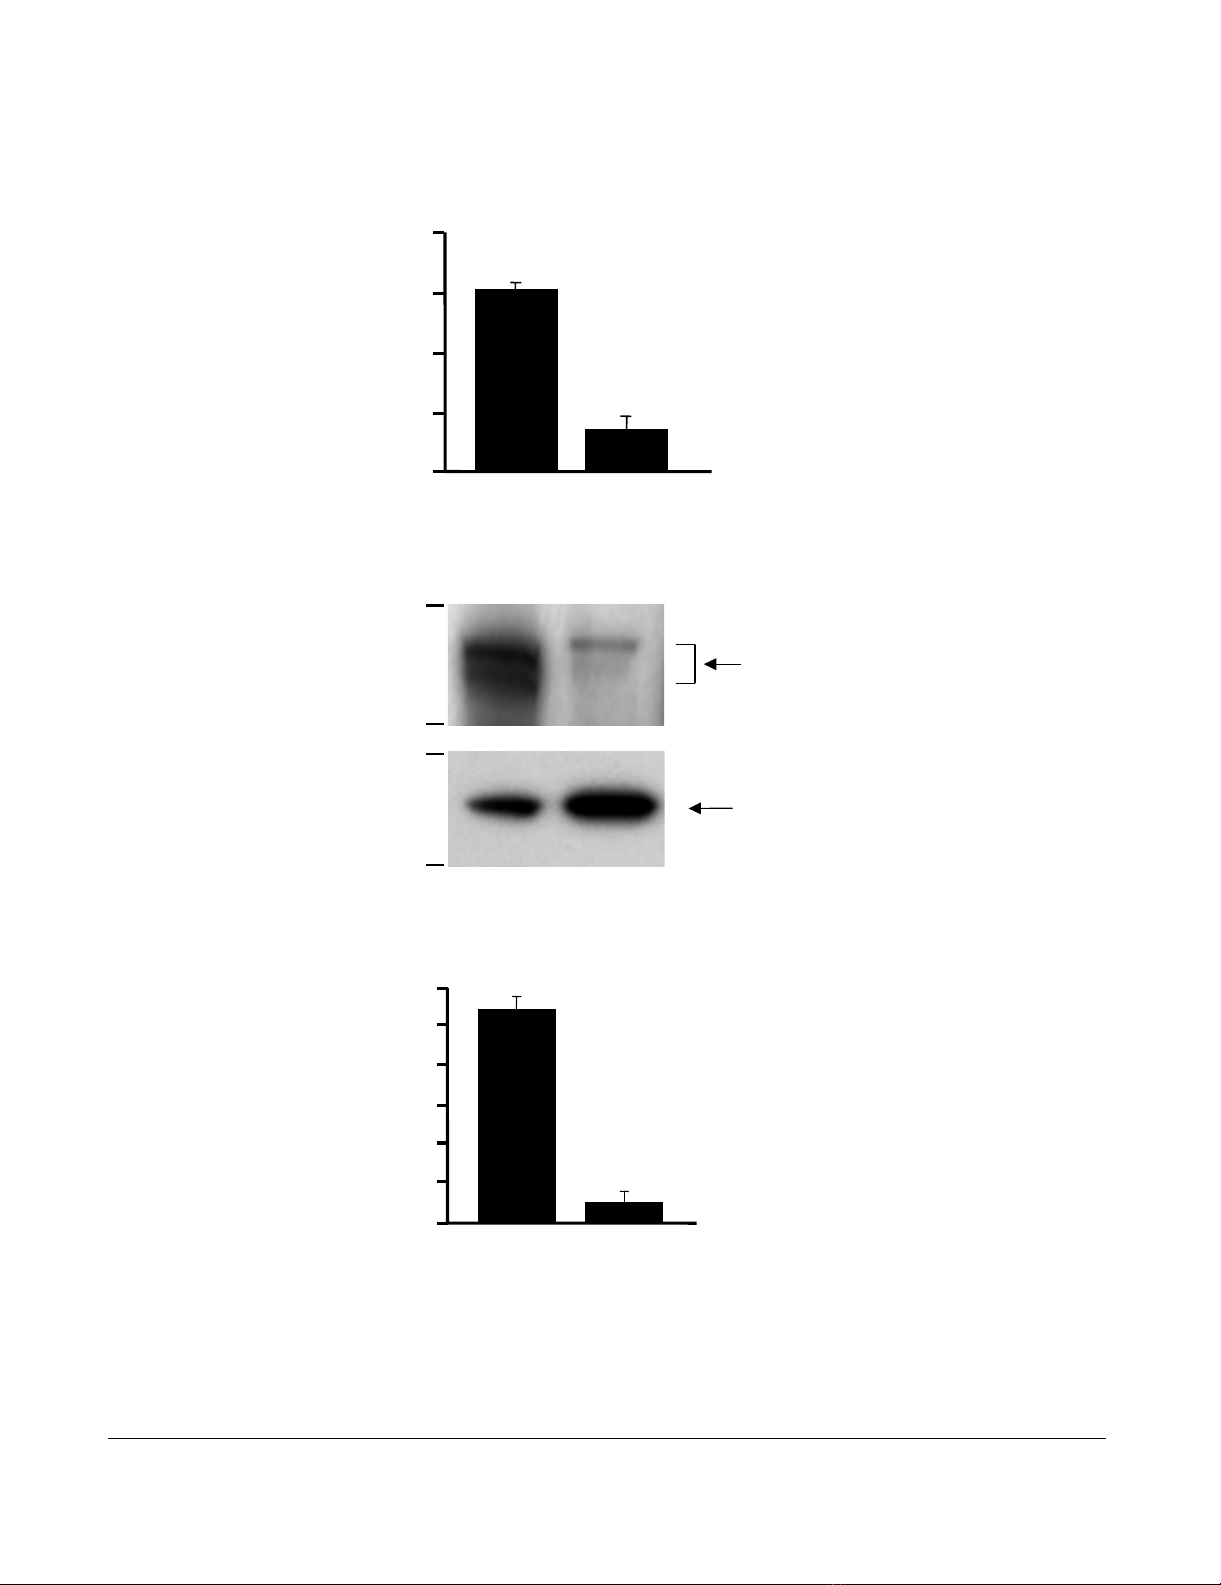
First we evaluated the level of CFTR expression in DC
compared to lung tissue known for high expression of
CFTR. CFTR mRNA was detected in DC and whole lung by
real-time RT-PCR (Figure 1A). The CFTR mRNA levels
were 212-fold lower in the DC compared to the whole
lung (p < 0.01). Likewise, CFTR protein was detected by
Western analysis (Figure 1B); the expression level in DC
was 11-fold lower compared to lung (p < 0.01, Figure 1C).
Gene Expression Difference in DC from WT and CF Mice
To determine the role of CFTR in DC, we compared gene
expression in DC from CF and WT mice by microarray
analysis. Nine genes were up-regulated in DC from CF
mice compared to WT mice with more than 1.5- fold
change in expression [see Additional file 1]. Interestingly,
CFTR was expressed at 2.1-fold higher levels in DC from
CF mice compared to WT mice. These higher levels of
CFTR mRNA were also seen using real-time RT-PCR
amplifying a fragment between exon 9 and 10, which is
outside of the mutated region of CFTR gene in the CF
mice, on independent samples (p < 0.05, Figure 2A). The
absence of part of exon 10, the characteristic of the
Cftrtm1UNC mice genotype [40,41], was confirmed by RT-
PCR (Figure 2B). This suggests increased levels of the
mutant CFTR mRNA in the DC of the CF mice.
Differentiation and Maturation of DC from WT and CF
Mice
In order to evaluate if the impaired CFTR expression in CF
DC influences their differentiation profile, bone marrow
cells were analyzed an day 0, 2, 4, 6 and 8 using the differ-
entiation and maturation markers CD40, CD40L, CD80,
CD86, ICAM, MHCI and MHCII. No quantitative or qual-
Respiratory Research 2009, 10:26 http://respiratory-research.com/content/10/1/26
Page 5 of 15
(page number not for citation purposes)
CFTR expression in bone marrow derived dendritic cells (DC)Figure 1
CFTR expression in bone marrow derived dendritic cells (DC). RNA and protein were extracted from wild type
(WT) mouse lung and DC. CFTR expression was measured by real-time RT-PCR and Western analysis. A. Real-time RT-PCR.
WT mouse lung tissue was used as a positive control and calibration. The y-axis represents CFTR cDNA transcription level in
terms of relative quantity value (RQ). B. Western analysis of CFTR protein in DC compared to the WT lung tissue. C. Quanti-
fication of CFTR protein by image intensity analysis. Images were scanned and analyzed by software Image J normalized to
GAPDH loading control. Shown is the mean ± SEM of three pairs of independent samples. **denotes p < 0.01.
B. Western Analysis
Lung
Lung DC
C. Quantification
DC
Lung DC
A. Real-time RT-PCR
Relative gene expression
160
120
36
KDa
50
GAPDH
CFTR
0.001
0.01
0.1
1
10
* *
Relative intensity
* *
10
8
6
4
2
0
12


%20--%3e%3cdefs%3e%3cstyle%3e%20.st0%20{%20fill:%20%23fff;%20}%20.st1%20{%20fill:%20%237800fa;%20}%20%3c/style%3e%3c/defs%3e%3cpath%20class='st1'%20d='M117.78,12.18H43.11c2.9,3.47,4.65,7.94,4.65,12.82,0,5.6-2.3,10.66-6.01,14.29h76.02l7.22-13.56-7.22-13.56Z'/%3e%3cg%3e%3cpath%20class='st0'%20d='M53.58,26.17h-.59v-1.46h.59v-4.96h2.83c1.78,0,2.67.94,2.67,2.82v5.76c0,1.87-.89,2.81-2.67,2.81h-2.83v-4.96ZM55.36,21.37v3.34h1.1v1.46h-1.1v3.34h1.01c.61,0,.91-.37.91-1.1v-5.93c0-.74-.3-1.1-.91-1.1h-1.01Z'/%3e%3cpath%20class='st0'%20d='M65.99,31.14h-1.8l-.31-2.07h-2.19l-.31,2.07h-1.64l1.82-11.39h2.62l1.82,11.39ZM65.28,18.04c-.25.46-.51.77-.75.94-.21.15-.47.22-.79.22-.26,0-.57-.07-.92-.22l-.38-.15c-.14-.05-.26-.07-.37-.07-.3,0-.53.18-.71.54l-.91-.68c.25-.46.51-.77.75-.94.21-.14.48-.21.79-.21.26,0,.57.07.92.21l.38.15c.14.05.26.07.37.07.3,0,.53-.18.71-.54l.91.68ZM61.91,27.52h1.73l-.87-5.76-.87,5.76Z'/%3e%3cpath%20class='st0'%20d='M74.53,26.89v1.52c0,1.91-.89,2.86-2.67,2.86s-2.67-.95-2.67-2.86v-5.93c0-1.91.89-2.86,2.67-2.86s2.67.95,2.67,2.86v1.11h-1.69v-1.22c0-.75-.31-1.12-.93-1.12s-.93.37-.93,1.12v6.15c0,.74.31,1.11.93,1.11s.93-.37.93-1.11v-1.63h1.69Z'/%3e%3cpath%20class='st0'%20d='M81.4,31.14h-1.8l-.31-2.07h-2.19l-.31,2.07h-1.64l1.82-11.39h2.62l1.82,11.39ZM75.9,19.2l1.52-1.91h1.71l1.51,1.91h-1.61l-.76-.95-.75.95h-1.61ZM77.32,27.52h1.73l-.87-5.76-.87,5.76ZM83.1,15.99l-1.76,1.91h-1.26l1.17-1.91h1.86Z'/%3e%3cpath%20class='st0'%20d='M84.86,19.75c1.78,0,2.67.94,2.67,2.82v1.48c0,1.87-.89,2.81-2.67,2.81h-.85v4.28h-1.79v-11.39h2.64ZM84.01,21.37v3.86h.85c.58,0,.87-.36.87-1.08v-1.71c0-.71-.29-1.07-.87-1.07h-.85Z'/%3e%3cpath%20class='st0'%20d='M93.51,19.75c1.78,0,2.67.94,2.67,2.82v1.48c0,1.87-.89,2.81-2.67,2.81h-.85v4.28h-1.79v-11.39h2.64ZM92.66,21.37v3.86h.85c.58,0,.87-.36.87-1.08v-1.71c0-.71-.29-1.07-.87-1.07h-.85Z'/%3e%3cpath%20class='st0'%20d='M98.8,31.14h-1.79v-11.39h1.79v4.88h2.03v-4.88h1.83v11.39h-1.83v-4.88h-2.03v4.88Z'/%3e%3cpath%20class='st0'%20d='M105.36,24.55h2.46v1.62h-2.46v3.34h3.09v1.63h-4.88v-11.39h4.88v1.63h-3.09v3.18ZM108.17,17.29l-1.76,1.91h-1.26l1.17-1.91h1.86Z'/%3e%3cpath%20class='st0'%20d='M112.2,19.75c1.78,0,2.67.94,2.67,2.82v1.48c0,1.87-.89,2.81-2.67,2.81h-.85v4.28h-1.79v-11.39h2.64ZM111.35,21.37v3.86h.85c.58,0,.87-.36.87-1.08v-1.71c0-.71-.29-1.07-.87-1.07h-.85Z'/%3e%3c/g%3e%3ccircle%20class='st1'%20cx='25'%20cy='25'%20r='20'/%3e%3cpath%20class='st0'%20d='M32.78,19.27c2.92,0,4.43,2.55,5.28,5.33l.71,2.17c.14.38-.33.75-.71.75h-5.61c.19-.33.24-.71.09-1.08l-.75-2.45c-.43-1.32-.99-2.64-1.79-3.77.75-.57,1.65-.94,2.78-.94h0ZM25,18.38c3.25,0,4.9,2.78,5.89,5.89l.76,2.45c.14.42-.33.8-.8.8h-11.69c-.42,0-.94-.38-.8-.8l.75-2.45c.99-3.11,2.64-5.89,5.89-5.89h0ZM25,11.35c1.74,0,3.11,1.37,3.11,3.11s-1.37,3.11-3.11,3.11-3.11-1.41-3.11-3.11,1.41-3.11,3.11-3.11h0ZM17.27,19.27c1.08,0,1.98.38,2.73.94-.8,1.13-1.37,2.45-1.74,3.77l-.8,2.45c-.14.38-.05.75.09,1.08h-5.56c-.42,0-.9-.38-.75-.75l.71-2.17c.9-2.78,2.41-5.33,5.33-5.33h0ZM17.27,12.91c1.51,0,2.78,1.27,2.78,2.83s-1.27,2.83-2.78,2.83-2.83-1.27-2.83-2.83,1.27-2.83,2.83-2.83h0ZM32.78,12.91c1.56,0,2.78,1.27,2.78,2.83s-1.23,2.83-2.78,2.83-2.83-1.27-2.83-2.83,1.27-2.83,2.83-2.83h0ZM27.07,28.56v.09c0,.57-.24,1.08-.61,1.46h0v.05c-.38.33-.9.57-1.46.57s-1.08-.24-1.46-.61h0c-.38-.38-.61-.9-.61-1.46v-.09h1.41v.09c0,.19.05.38.19.47v.05c.09.09.28.19.47.19s.38-.09.47-.19v-.05c.14-.09.24-.28.24-.47t-.05-.09h1.41ZM30.99,28.56v.09c0,1.65-.66,3.16-1.74,4.24-1.08,1.08-2.59,1.79-4.24,1.79s-3.16-.71-4.24-1.79l-.05-.05c-1.04-1.08-1.7-2.55-1.7-4.2v-.09h1.41v.09c0,1.27.47,2.4,1.27,3.25h.05c.85.85,1.98,1.37,3.25,1.37s2.4-.52,3.25-1.37c.85-.8,1.37-1.98,1.37-3.25v-.09h1.37ZM34.99,28.56v.09c0,2.78-1.13,5.28-2.92,7.07-1.79,1.79-4.29,2.92-7.07,2.92s-5.23-1.13-7.07-2.92c-1.79-1.79-2.92-4.29-2.92-7.07v-.09h1.41v.09c0,2.4.94,4.53,2.5,6.08,1.56,1.56,3.72,2.5,6.08,2.5s4.52-.94,6.08-2.5c1.56-1.56,2.5-3.68,2.5-6.08v-.09h1.41Z'/%3e%3c/svg%3e)