
RESEARC H ARTIC LE Open Access
The potential role of appetite in predicting
weight changes during treatment with
olanzapine
Michael Case
1*
, Tamas Treuer
2
, Jamie Karagianis
3
, Vicki Poole Hoffmann
1
Abstract
Background: Clinically significant weight gain has been reported during treatment with atypical antipsychotics. It
has been suggested that weight changes in patients treated with olanzapine may be associated with increased
appetite.
Methods: Data were used from adult patients for whom both appetite and weight data were available from 4
prospective, 12- to 24-week clinical trials. Patients’appetites were assessed with Eating Behavior Assessment (EBA,
Study 1), Platypus Appetite Rating Scale (PARS, Study 2), Eating Inventory (EI, Study 3), Food Craving Inventory (FCI,
Study 3), and Eating Attitude Scale (EAS, Study 4).
Results: In Studies 1 (EBA) and 4 (EAS), patients who reported overall score increases on appetite scales, indicating
an increase in appetite, experienced the greatest overall weight gains. However, in Studies 2 (PARS) and 3 (EI, FCI),
patients who reported overall score increases on appetite scales did not experience greater weight changes than
patients not reporting score increases. Early weight changes (2-4 weeks) were more positively correlated with
overall weight changes than early or overall score changes on any utilized appetite assessment scale. No additional
information was gained by adding early appetite change to early weight change in correlation to overall weight
change.
Conclusions: Early weight changes may be a more useful predictor for long-term weight changes than early score
changes on appetite assessment scales.
Clinical Trials Registration: This report represents secondary analyses of 4 clinical studies. Studies 1, 2, and 3 were
registered at http://clinicaltrials.gov/ct2/home, under NCT00190749, NCT00303602, and NCT00401973, respectively.
Study 4 predates the registration requirements for observational studies that are not classified as category 1
observational studies.
Background
Treatment with atypical antipsychotics has been tem-
porally associated with weight gain. Hypotheses about
the potential mechanism have included direct effects of
the known receptor affinities of each compound [1,2],
effects on gastric and intestinal hormones [3], direct or
indirect effects on the feeding and satiety centers in
the brain [4], disturbance of the hypothalamus-pitui-
tary-adrenal (HPA) axis [5], direct effect on insulin
sensitivity [6], decrease in physical activity, and
decrease in metabolic rate [7].
The extent of weight change and changes in metabolic
parameters during treatment with antipsychotics varies
between drugs. These variations may be due to differences
in receptor pharmacology [8]. Kroeze et al. demonstrated
that affinity to the histamine H1 receptor predicts weight
gain associated with typical and atypical antipsychotics [9].
Olanzapine and clozapine both have high affinities for the
5-HT2C and the histamine H1 receptors, while antagon-
ism of peripheral M3 muscarinic receptor and effects on
central 5-HT2C may potentially be related to treatment-
emergent diabetes observed independent of obesity.
* Correspondence: case_michael@lilly.com
1
Lilly USA, LLC, Indianapolis, IN, USA
Full list of author information is available at the end of the article
Case et al.BMC Psychiatry 2010, 10:72
http://www.biomedcentral.com/1471-244X/10/72
© 2010 Case et al; licensee BioMed Central Ltd. This is an Open Access article distributed under the terms of the Creative Commons
Attribution License (http://creativecommons.org/licenses/by/2.0), which permits unrestricted use, distribution, and reproduction in
any medium, provided the original work is properly cited.

While potential mechanisms for weight gain have
been widely studied, the role of changes in appetite
remains poorly understood. It is well known that
executive functions are necessary to successfully man-
age eating behavior, and their impairment and dis-
turbed weight regulation are often observed in patients
with schizophrenia treated with antipsychotics. A
recent pilot study showed that a delay of gratification
and executive performance in individuals with schizo-
phrenia may play a putative role for eating behavior
and body weight regulation [10]. Additionally, increas-
ing evidence suggests that general obesity is linked to
adverse neurocognitive outcomes. Altered cognitive
functions can independently affect the control of appe-
tite [11]. Treatment with both clozapine and olanza-
pine have been temporally associated with food craving
and binge eating [12,13].
Previous studies have observed that patients treated
with atypical antipsychotics are more reactive to exter-
nal eating cues as measured by the Three Factors Eating
Behavior Questionnaire and the Dutch Eating Behavior
Questionnaire [14]. Based on the observation of an asso-
ciation between weight gain and lack of cognitive
restraint in the presence of increased appetite, it has
been suggested that psychoeducational counseling in
conjunction with adjunctive pharmacotherapeutic agents
might limit weight gain during antipsychotic drug
therapy [15].
An understanding of the role of appetite changes in
weight gain during antipsychotic treatment would be
helpful to clinicians and patients, some of whom report
substantially increased appetite starting after their first
dose of an antipsychotic.
Changes in appetite might serve as early warning signs
of risk of weight gain as well as inform treatment deci-
sions. If specific changes in appetite can be expected,
patients can be informed in advance and may be better
able to manage them. Here we test the hypothesis that
changes in appetite might be indicative of a patient’s
weight gain during treatment with olanzapine.
Methods
Presented are secondary analyses examining potential
associations between changes in appetite and weight
changes during treatment with olanzapine. The primary
study objectives have been reported elsewhere [16-19].
The study protocols were reviewed and approved by
individual institutional review boards prior to enrolling
any patients, and the analyses presented here are consis-
tent with the original ethics approvals. The studies were
consistent with Good Clinical Practices and all applic-
able regulatory requirements. All participants provided
written informed consent before receiving study therapy
or undergoing study procedures.
Study design
Included in the analyses were patients from 4 prospec-
tive, phase IV clinical trials examining the efficacy and
safety of olanzapine in adult (18 to 65 years old in
Studies 1, 2, and 3, ≥18 years old in Study 4) male and
female patients diagnosed with schizophrenia, schizoaf-
fective disorder, related psychosis, or bipolar disorder.
In Study 1, patients received double-blind oral olanza-
pine 5-20 mg once daily (QD) for 12 weeks [16]. In
Study 2, patients received double-blind oral olanzapine
5-20 mg QD for 16 weeks [18]. In Study 3, patients
received open-label oral olanzapine 5-20 mg QD for
22 weeks [19]. Study 4 was an observational study in
which patients received oral olanzapine at doses deter-
mined by the investigator as appropriate for the indivi-
dual patient for 6 months (Table 1) [17]. Detailed
inclusion and exclusion criteria can be found in the
primary study reports [16-19].
Clinical assessment of appetite
Across all 4 studies, appetite was assessed with 5 differ-
ent scales: Eating Behavior Assessment (EBA, a Lilly-
developed scale, assessing appetite and eating behavior
with 9 standardized questions, grading responses on a
scale from 0 to 4, where 0 = not at all and 4 = extre-
mely; not validated; Study 1); Platypus Appetite Rating
Scale (PARS, a Lilly-developed visual analog scale; not
validated; Study 2); Eating Inventory (EI, Study 3) [20];
Food Craving Inventory (FCI, Study 3) [21]; and Eating
Attitude Scale (EAS, a Lilly-developed scale, assessing
appetite and eating behavior during the past 4 weeks
with 10 standardized categories; not validated; Study 4)
(Table 1).
Statistical analysis
For each study, only patients for whom weight and
appetite data at baseline, at 2 weeks (Study 4, 4 weeks),
and at ≥1 later visit were available, were included in our
analyses. Patients were assigned to distinct groups based
on their overall and 2-week (Study 4, 4-week) appetite
scale item scores and total scores. Score increase was
defined as: positive value on EBA, >+5 units on PARS,
>+1 unit on EI, >+1 unit on FCI, or > 0 units on EAS.
No change in score was defined as: 0 units on EBA, ≥-5
to ≤+5 units on PARS, ≥-1 to ≤+1 units on EI, ≥-1 to
≤+1 units on FCI, or 0 units on EAS. Score decrease
was defined as: negative value on EBA, <-5 units on
PARS, <-1 unit on EI, <-1 unit on FCI, or <0 units on
EAS. For each group, mean overall weight change and
mean appetite scale score changes were determined
using observed case analyses. Additionally, to test the
hypothesis of a linear trend between appetite and
weight changes (i.e. greater increases in appetite are
associated with greater increases in weight), pair-wise
Case et al.BMC Psychiatry 2010, 10:72
http://www.biomedcentral.com/1471-244X/10/72
Page 2 of 9

comparisons of mean weight changes in the “decrease”
versus “no change”and the “no change”versus
“increase”appetite groups were conducted. If both of
these tests were significant and the magnitudes of the
changes followed the hypothesized pattern, a linear
trend would be suggested.
Additionally, several Pearson correlation coefficients
were assessed and tested for statistical significance: a)
between weight changes from baseline to endpoint and
score changes on appetite scales from baseline to
2 weeks (Study 4, 4 weeks); b) between weight changes
from baseline to endpoint and changes on appetite
scales from baseline to endpoint; c) between baseline to
endpoint weight changes and 2-week (Study 4, 4-week)
weight changes; and d) between overall weight change
and 2-week appetite scale changes, adjusted by 2-week
weight change (the correlation of appetite changes on
the residuals from the regression of endpoint weight
changes on 2-week weight changes).
Results
Patients
Baseline demographic data for all patients included in
our analyses are presented in Table 2. The distribution
of patient ethnicities was different across all 4 studies.
Study 1 included a majority of African American
patients, while Studies 2 and 3 included mainly white
patients, and the majority of patients in Study 4 self-
identified as East and Southeast Asians.
Weight changes
In all 4 studies, patients experienced statistically signifi-
cant (p <.05) mean weight increases from baseline to
endpoint (Study 1: 86.3 kg at baseline, 89.6 kg at end-
point; Study 2: 81.2 kg at baseline, 84.1 kg at endpoint;
Study 3: 85.4 kg at baseline, 90.8 kg at endpoint; Study
4: 64.1 kg at baseline, 68.3 kg at endpoint).
Appetite changes
An increase in patients’appetite from baseline to endpoint
was observed in Study 1 (EBA item #1: 1.5 at baseline, 1.7
at endpoint, p = .21; EBA item #2: 1.6 at baseline, 1.6 at
endpoint, p = .72; EBA item #3: 1.1 at baseline, 1.2 at end-
point, p = .11; EBA item #4: 0.9 at baseline, 1.1 at end-
point, p = .22; EBA item #5: 2.5 at baseline, 2.5 at
endpoint, p = .35; EBA item #6: 0.9 at baseline, 1.1 at end-
point, p = .42; EBA item #7: 0.9 at baseline, 1.0 at end-
point, p = .32; EBA item #8: 0.4 at baseline, 0.6 at
endpoint, p = .36; EBA item #9: 0.1 at baseline, 0.3 at end-
point, p = .12), while in Studies 2, 3, and 4, patients’appe-
tites decreased in the course of the trials (Study 2 - PARS:
65.7 at baseline, 58.9 at endpoint, p = .04; Study 3 - EI
cognitive restraint: 7.6 at baseline, 11.3 at endpoint, p =
.09, EI disinhibition: 8.7 at baseline, 5.4 at endpoint, p =
.16, EI hunger: 7.9 at baseline, 4.8 at endpoint, p = .17, FCI
total: 65.4 at baseline, 61.5 at endpoint, p <.0001; Study 4 -
EAS 1: 1.6 at baseline, 1.4 at endpoint, p <.0001, EAS 2:
1.6 at baseline, 1.4 at endpoint, p <.0001, EAS 5: 2.3 at
baseline, 2.1 at endpoint, p <.0001, EAS 6: 1.3 at baseline,
1.1 at endpoint, p <.0001, EAS 7: 1.2 at baseline, 1.1 at
endpoint, p <.0001, EAS 8: 0.7 at baseline, 0.5 at endpoint,
p = .85, EAS 9: 0.6 at baseline, 0.5 at endpoint, p = .48).
Associations between appetite scale score changes and
weight changes
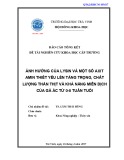
In Studies 1 (EBA) and 4 (EAS), score increases on single
appetite assessment scale items, both at 2 or 4 weeks and
at last measurement, indicating an increase in appetite,
occurred in patients who experienced the greatest overall
weight gains (Figures 1a+b, 2a+b). However, in Studies 2
(PARS) and 3 (EI, FCI), patients who reported score
increases on appetite scales items at 2 weeks and/or at last
measurement did not consistently experience greater
weight changes than patients reporting no score changes
or score decreases. The only individual appetite scale item
Table 1 Summary of Study Designs
Study 1 Study 2 Study 3 Study 4
Patient age (years) 18 to 65 18 to 65 18 to 65 ≥18
Study design Double-blind Double-blind Open-label Observational
Olanzapine dose (mg) 5 to 20 mg QD 5 to 20 mg QD 5 to 20 mg QD Determined by the
investigator
Adjunctive
pharmacotherpay
no no no or
Amantadine 100 mg BID or
Metformin 500 mg BID
no
Appetite assessment
scale
Eating Behavior
Assessment
Platypus Appetite Rating
Scale
Eating Inventory and Food Craving
Inventory
Eating Attitude Scale
Dietary counseling yes no yes no
Study length (weeks) 12 16 22 24
Abbreviations: BID = twice daily; QD = once daily.
Case et al.BMC Psychiatry 2010, 10:72
http://www.biomedcentral.com/1471-244X/10/72
Page 3 of 9

that was correlated with later weight increase was an
increase in the appetite for fattyfastfoodat2weeksin
patients in Study 3 who showed the greatest overall weight
change. Analysis of overall total score changes on appetite
scales for Studies 1, 2, and 3 (no total score available for
Study 4) showed that patients who experienced a decrease
in total scores in appetite assessment scales had the lowest
weight gains (≤1.6 kg).
Statistically significant differences in the pair-wise com-
parisons among patient groups with distinct appetite rat-
ing scale scores were observed in Studies 1 (Figures 1a
and 1b) and 4 (Figures 2a and 2b), where the “increase”
appetite group showed significantly greater weight
change than the “no change”appetite group on specific
EBA and EAS items. However, the “decrease”appetite
groups did not show significantly less weight change than
the “no change”appetite groups on these same items.
Correlation coefficients between appetite scale score
changes and weight changes
In all 4 studies, early weight changes (2-4 weeks) had
stronger correlations to overall weight changes than
both overall and early (2-4 weeks) changes on any appe-
tite scale examined (Table 3). Adjustment of early appe-
tite scale changes by early weight changes demonstrated
that early appetite scale assessments in conjunction with
early weight changes do not provide additional informa-
tion for predicting overall weight changes.
Discussion
Our analyses demonstrate an inconsistent association
between changes in appetite and weight change during
treatment with olanzapine; results varied depending on
study and appetite assessment scale used. Overall, early
weight changes may be a more useful predictor of long-
term weight changes compared with early score changes
on appetite assessment scales. To our knowledge, this is
the first study exploring a potential correlation between
changes in appetite and weight changes during treat-
ment with olanzapine.
Our observation that early weight changes correlate
strongly with long-term weight changes is in agreement
with earlier findings [22]. The absence of a consistent
correlation between changes in appetite and weight
Table 2 Baseline Demographics and Clinical Characteristics
Parameter Study 1 (N = 68) Study 2 (N = 65) Study 3 (N = 50) Study 4 (N = 622)
Age (years), mean (SD) 43.5 (9.5) 38.7 (12.2) 38.5 (12.0) 35.6 (12.2)
Male gender, n (%) 45 (66.2) 33 (50.8) 120 (60.3) 269 (43.2)
Ethnicity, n (%)
White 27 (39.7) 36 (55.4) 87 (43.7) 148 (23.8)
African American 34 (50.0) 4 (6.2) 16 (8.0) 0
East/Southeast Asian 1 (1.5) 1 (1.5) 39 (19.6) 369 (59.3)
Native American 0 0 0 0
Hispanic 4 (5.9) 23 (35.4) 52 (26.1) 83 (13.3)
West Asian 0 0 4 (2.0) 1 (0.2)
Other 2 (2.9) 1 (1.5) 0 0
Native American/First Nation 0 0 1 (0.5) 0
Missing 0 0 0 21 (3.4)
Weight (kg), mean (SD) 86.3 (16.8) 81.2 (17.0) 77.5 (16.6) 64.1 (12.5)
BMI, mean (SD) 28.7 (5.1) 28.3 (4.8) 27.1 (4.7) 23.2 (3.9)
Appetite, mean (SD) EBA Item #1: 1.5 (1.1)
a
PARS: 65.7 (19.2) EI-Cognitive Restraint: 7.6 (5.2)
b
EAS 1: 1.6 (1.2)
c
EBA Item #2: 1.6 (1.1)
a
EI-Disinhibition: 8.7 (4.6)
b
EAS 2: 1.6 (1.1)
c
EBA Item #3: 1.1 (1.2)
a
EI-Hunger: 7.9 (4.5)
b
EAS 5: 2.3 (1.2)
d
EBA Item #4: 0.9 (1.1)
a
FCI Total: 65.4 (20.1) EAS 6: 1.3 (1.2)
f
EBA Item #5: 2.5 (1.0)
a
EAS 7: 1.2 (1.2)
f
EBA Item #6: 0.9 (1.2)
a
EAS 8: 0.7 (0.9)
f
EBA Item #7: 0.9 (1.2)
a
EAS 9: 0.6 (0.9)
f
EBA Item #8: 0.4 (0.9)
a
EBA Item #9: 0.1 (0.3)
a
Abbreviations: BMI = Body Mass Index; EAS = Eating Attitude Scale; EAS 1 = More hungry than usual; EAS 2 = Stronger appetite than usual; EAS 5 = Felt comfortably
full when meal was finished; EAS 6 = It took an excessive amount of food to feel full; EAS 7 = Thoughts were preoccupied with food; EAS 8 = Ate until
uncomfortably full; EAS 9 = Could not stop eating; EB = Eating Behavior Assessment; EI = Eating Inventory; FCI = Food Craving Inventory; kg = kilograms;
N = number of patients in study included in the current analyses; n = number of patients affected; PARS = Platypus Appetite Rating Scale; SD = standard deviation;
a
n = 68;
b
only assessed in patients in the United States, n = 17;
c
n = 606;
d
n = 602;
e
n = 604;
f
n = 605.
Case et al.BMC Psychiatry 2010, 10:72
http://www.biomedcentral.com/1471-244X/10/72
Page 4 of 9

changes was an unexpected finding, as one would expect
that changes in appetite will result in changes in eating
habits and consequently changes in weight. We cannot
exclude the possibility that the appetite assessment
scales might not have accurately measured appetite in
our patient population. However, weight increase during
treatment with olanzapine might not be associated with
increased appetite. In experiments with female rats,
hyperphagia and sedation were observed to occur con-
comitantly during exposure to olanzapine, two behaviors
that interact competitively without necessarily increasing
appetite [15,23]. However, earlier studies with sulpiride
showed that there is no weight gain in female rats in
the absence of hyperphagia [24]. Another reason for the
inconsistency of our observations might be the possibi-
lity that weight gain during treatment with olanzapine
may be associated with several biochemical mechanisms,
which might manifest in a variety of clinical conditions
accompanying weight gain [25].
The observed variations in associations between changes
on appetite assessment scales and weight changes might
also be due to inherent differences between the scales that
were utilized and differences among the study populations.
Onesuchdifferenceamongstudypopulationsmightbe
the extent of clinical improvement during therapy. While
our analysis is limited by the lack of a subanalysis of clini-
cal improvement versus appetite, it has been observed pre-
viously that clinical improvement of psychotic symptoms
in patients with schizophrenia seems to coincide with
increased food intake [26]. Interestingly, EBA and EAS,
which showed within the examined assessment scales the
greatest similarities with one another with regard to items
included, were also most similar in their assessment
results. EBA and EAS were the only appetite scales for
Figure 1 Study 1 –A) Relationship of overall EBA item score changes and overall weight changes. B) Relationship of 2-week EBA item
score changes and overall weight changes. Abbreviations: EBA = Eating Behavior Assessment; kg = kilogram.
Case et al.BMC Psychiatry 2010, 10:72
http://www.biomedcentral.com/1471-244X/10/72
Page 5 of 9


![Bộ Thí Nghiệm Vi Điều Khiển: Nghiên Cứu và Ứng Dụng [A-Z]](https://cdn.tailieu.vn/images/document/thumbnail/2025/20250429/kexauxi8/135x160/10301767836127.jpg)
![Nghiên Cứu TikTok: Tác Động và Hành Vi Giới Trẻ [Mới Nhất]](https://cdn.tailieu.vn/images/document/thumbnail/2025/20250429/kexauxi8/135x160/24371767836128.jpg)


