Journal of Science and Transport Technology Vol. 1 No. 1, 34-44
Journal of Science and Transport Technology
Journal homepage: https://jstt.vn/index.php/en
JSTT 2021, 1 (1), 34-44
Published online 07/12/2021
Article info
Type of article:
Original research paper
DOI:
https://doi.org/10.58845/jstt.utt.2
021.en.1.1.34-44
*Corresponding author:
E-mail address:
banglh@utt.edu.vn
Received: 13/10/2021
Revised: 30/11/2021
Accepted: 02/12/2021
Estimation of the bond strength between FRP
and concrete using ANFIS and hybridized
ANFIS machine learning models
Thuy-Anh Nguyen, Hai-Bang Ly*
University of Transport Technology, 54 Trieu Khuc, Thanh Xuan, Hanoi 100000,
Vietnam
Abstract: Adaptive Neuro-Based Fuzzy Inference System (ANFIS) and
Particle Swarm Optimization (PSO) algorithms were utilized to produce
numerical tools for predicting the bond strength between the concrete surface
and carbon fiber reinforced polymer (CFRP) sheets. From the relevant
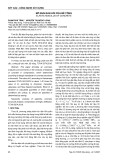
literature, a credible database encompassing 242 test specimens was
developed, along with six input factors that primarily determine bond strength.
These characteristics include the beam's width, the compressive strength of
the concrete, the FRP thickness, the FRP modulus of elasticity, the FRP length,
and the FRP width. Finally, using conventional statistical metrics, the outputs
of the two suggested models (ANFIS and ANFIS-PSO) were compared to the
experimental data. Both models were shown to be a good alternative strategy
for predicting the bond strength of FRP-to-concrete.
Keywords: Bond Strength; FRP-to-concrete; Adaptive Neuro-Based Fuzzy
Inference System (ANFIS); Particle Swarm Optimization (PSO).
1. Introduction
Reinforced concrete is one of the most
commonly used construction materials because of
its strength, ease of application, adaptability,
flexibility, durability, and affordable price. However,
in complicated weather conditions, intense
aggressiveness of the environment causes steel
rusting, peeling of the protective concrete layer,
and reducing the reinforced concrete bearing
structure system [1]. In addition, the changes due
to user requirements often tend to be detrimental
to existing structures requiring the implementation
of solutions to repair, upgrade or even replace the
structure. At that time, repairing and upgrading are
often practical solutions because replacing a series
of works requires significant costs. Therefore, the
development of repair and reinforcement
technology solutions to maintain and restore the
normal working of reinforced concrete structures is
highly necessitated.
In recent times, repairing and reinforcing
works by using fiber reinforced polymers (FRP) in
sheet form is a solution that has been widely
studied and applied [2,3]. This method takes
advantage of the properties of FRP materials such
as high strength and corrosion resistance, high
durability, non-magnetic, and has a higher
strength-to-weight ratio, which reduces the self-
weight of an RC structure and high fatigue
resistance. In addition, the convenience of
construction, high aesthetics, ensuring the
preservation of the old structural shape (because
FRP sheets can be quickly bonded with structures
of any cross-section), suitable for projects that
JSTT 2021, 1 (1), 34-44
Nguyen & Ly
35
require high waterproofing and corrosion
resistance is also an advantage to use reinforced
FRP sheets outside the structure [4,5]. External
reinforcement using FRP sheets is mainly reliant
on the capacity of the FRP sheets to adhere to the
concrete surface. This bond plays an essential role
in stress transfer between the concrete and the
FRP sheets and is critical in controlling various
bondage failures in FRP-reinforced structures [6].
Many studies have investigated the bond
strength using experimental approaches such as
the break test or the single ring shear test [79]. In
addition, to calculate the bond strength of FRP-to-
concrete, numerical approaches [10,11] and hybrid
models expanded by experimental data and
analytical solutions [12,13] have been utilized.
Furthermore, based on empirical analysis of
experimental data acquired from tensile testing,
many distinct design equations have been
constructed to estimate the bond strength [14–16].
However, multiple studies have shown that the
capacity to forecast the bond strength of FRP-to-
concrete is limited by the data sets employed
[17,18]. Additionally, the aforementioned formulae
do not take into account the nonlinear relationship
between the input and output parameters and do
not test for alternative combinations of input
parameters when calculating bond strength.
Furthermore, the majority of existing prediction
algorithms overlook the adhesive material's
characteristics [19].
Recent years have seen a progressive
increase in popularity and the use of machine
learning (ML) or artificial intelligence (AI) based on
computer science. In the construction sector,
machine learning or artificial intelligence has been
used in areas such as structure [20,21], materials
[22,23], soil mechanics [24,25]. As a result, artificial
intelligence may be used to assess the bond
strength of FRP-to-concrete. The Adaptive Neuro-
Based Fuzzy Inference System (ANFIS) model, a
branch of artificial intelligence, is commonly used
in construction engineering. Therefore, the ANFIS
model is suggested in this work to forecast the
bond strength of FRP-to-concrete. In addition, the
ANFIS model's hyperparameters are optimized
using the Particle Swarm Optimization (PSO)
technique. The following sections of the paper are
given in chronological order: The theoretical
foundation of the ANFIS model utilized in this work
is introduced in section 2, the database for training
and validation of ANFIS models is shown in part 3,
and the findings and comments are presented in
section 4. Finally, in section 5, some conclusions
are presented.
2. Methods used
2.1. Adaptive Neuro-Based Fuzzy Inference
System
Jang created the Adaptive Neural Fuzzy
Inference System (ANFIS) in 1993 [26], which is a
prominent artificial intelligence system that
combines artificial neural networks with fuzzy logic.
ANFIS uses fuzzy learning rules in the form of TSK
(Takasi Sugeno Kang). The jth fuzzy learning
rule of ANFIS is Rj of the form:
j
1
B
j
2
B
j
n
B
n
jj
0 i i
i=1
p+Σ p X
(1)
with Xi, Y are input and output variables
respectively,
( )
j
1i
Bx
are fuzzy linguistic variables
corresponding to the input variable Xi,
j
i
pR
is the
coefficient of the linear function fj, i = 1,2,…,n; j =
1,2,…,M
The structure of ANFIS consists of five layers
[27] represented by several nodes and node
functions (Fig 1). Various types of buttons, such as
square and circular, are used to represent different
aspects of adaptive learning. Parameters are
present in square nodes (adaptive nodes), but not
in round nodes (fixed nodes). Each button has a
certain purpose. The direction of the signal is
indicated by the link between two nodes. Buttons
in the same class have the same function, as
described below.
JSTT 2021, 1 (1), 34-44
Nguyen & Ly
36
Fig. 1. The adaptive neuro-fuzzy inference (ANFIS) algorithm structure
- The first layer includes adaptive nodes
(square nodes), as well as a membership function
( )
j
ii
AX
. The output of this class is computed
using the Gaussian membership function.
( )
2
k
gaussian
k
xc
x exp s



=−




(2)
- The rule layer is the second layer. Each
node in this layer is identified by a circle labeled Π,
referred to as rule nodes. It is the sum of the
incoming signals, and the output value of each
node indicates the strength of a rule:
( ) ( )
ii
i B C
ω X η Y
(3)
- Each node in the third tier is a fixed circular
node designated N. The ith node in this class is
defined as the ratio of the ith rule's magnitude to
the total of all normals' intensities:
i
i
i
ω
ω= ω
i
(4)
- Each node in the fourth layer, denoted Z, is
a square adaptive node. This layer has the same
number of nodes as the third layer. Each node
outputs the weighted result value of a particular
rule:
( )
i i i i i i
ωF p X+q Y+r
(5)
- The fifth layer has a circular node. In this
layer, the symbol is the output equal to the sum
of all input signals.
ii
i
ii
ii
i
Σω F
Σω F= Σω
(6)
2.2. Particle Swarm Optimization Algorithm
The Particle Swarm Optimization method
(PSO) was created by Eberhart and Kennedy
(1995) [28]. It is a population-based stochastic
optimization approach that replicates the behavior
of flocks of birds or schools of fish hunting for food.
They proposed that the swarm foraging process
occurs in an area of space where all components
in the swarm are aware of the location of food and
maintain their position closest to it. Then, the
greatest strategy for finding food is to follow the
flock's leaders - those closest to the food. The PSO
algorithm is offered to adapt to this circumstance
and solve optimization difficulties. Each answer in
PSO is a component of the preceding scenario.
Each element is defined by two parameters: its
current location and velocity. Simultaneously, each
element has a fitness value, which the fitness
function evaluates. At the start, the swarm, or more
accurately, the location of each element, is
initialized randomly. During motion, each element
is impacted by two pieces of information: the first,
named Qbest, is the element's best position in the
past; the second, designated Jbest, is the swarm's
best position in the past. Specifically, after each
discrete time period, each element's velocity and
X
Y
A1
A2
B1
B2
N
N
w1
w2
X Y
X Y
w1f1
w2f2
Bond strength
of FRP-to-
concrete
f
Input Layer 1 Layer 2 Layer 3 Layer 4 Layer 5
JSTT 2021, 1 (1), 34-44
Nguyen & Ly
37
location are changed using the following formulas:
( ) ( ) ( )
( )
( )
( )
t+1 t t
i,m i,m 1 i,m i,m
t
2 i,m i,m
V =W.V +C .rand(). Qbest -X
+C .rand(). Jbest -X
(7)
( ) ( ) ( )
( )
( )
( )
t+1 t t
i,m i,m 1 i,m i,m
t
2 i,m i,m
V =W.V +C .rand(). Qbest -X
+C .rand(). Jbest -X
(8)
2.3. Cross-validation
Cross-validation is a statistical technique that
is used to quantify the performance (or accuracy)
of machine learning models. It guards against
model overfitting, which is particularly important
when data is few.
The critical parameter in this technique is k,
representing the number of groups into which the
training dataset will be divided. Then, the testing
data section will be kept separate and reserved for
the final evaluation step to check the "reaction" of
the model when encountering completely unseen
data. The training data will be randomly divided into
k parts (k is an integer or preferably a given value
of 5 or 10 [29,30]. In the next step, the model is
trained k times. For each simulation, the process
will choose 1 part as validation data and k-1 as
training data. The final model evaluation result will
be the average of the evaluation results of k
training times, which allows one to evaluate the
predictive models more objectively and accurately.
Fig. 2. Demonstration of 5 fold cross-validation technique
2.4. Model evaluation
The correlation between the predicted values
by the machine learning model and the actual
experimental values was evaluated using
conventional assessment metrics such as Pearson
correlation coefficient (R), root mean square error
(RMSE), and mean absolute error (MAE) in this
work. In general, the model's performance
improves when the MAE and RMSE approach
zero. Similarly, R's value is in the range [-1; 1], and
the closer R's absolute value is to 1, the more
accurate the model is. Formulas for calculating R,
RMSE, and MAE can be found in the cited
documents [31-33].
3. Database construction
The suggested ANFIS model for predicting
FRP-to-concrete bond strength is based on a
database of 242 laboratory test results from 15
published papers [6-8,34-42]. The experimental
database is collected from the tests conducted to
measure the bond strength between CFRP sheets
and the concrete surface under direct tension. The
training and testing datasets are randomly selected
All Dataset
Training dataset Testing Dataset
Fold 1 Fold 2 Fold 3 Fold 4 Fold 5
Fold 2 Fold 3 Fold 4 Fold 5
Fold 1
Fold 2 Fold 3 Fold 4 Fold 5
Fold 2
Fold 1
Fold 2 Fold 3 Fold 4 Fold 5
Fold 1 Fold 3
Fold 2 Fold 3 Fold 4 Fold 5
Fold 1 Fold 4
Fold 2 Fold 3 Fold 4 Fold 5
Fold 1 Fold 5
Testing Dataset
Final evaluation
JSTT 2021, 1 (1), 34-44
Nguyen & Ly
38
from the database. 70% of the dataset is utilized for
training, whereas 30% is used for testing the
model. According to published experimental data,
the bond strength between the CFRP panels and
the concrete surface is mostly determined by the
six primary factors used to build the ANFIS model.
The beam width (bc), the concrete compressive
strength (fc'), the FRP thickness (t), the FRP
modulus of elasticity (Ef), the FRP length (lf), and
the FRP width (bf).
Table 1 details the input and output
parameters' notation, roles, and statistical analysis
(minimum, maximum, mean, median, and standard
deviation). The data distribution of input and output
parameters and their occurrence frequency in the
dataset, and the correlation relationship between
the parameters are shown in Fig 3. The dotted line
in Fig 3 shows the correlation graph between the
pairs of parameters. Besides, the specific
correlation values between the pairs of parameters
are also shown. The parameters in the collected
data set have low correlation (correlation value is
less than 0.6), some pairs of parameters have very
low correlation (correlation value is close to 0). The
six input parameters of the dataset could thus be
considered independent variables.
Table 1. Statistical analysis of the input and output variables used in this study
Variable
Not.
Min
Median
Mean
Max
Standard deviation
Skewness
I1
bc
100.000
150.000
158.884
400.000
47.797
1.431
I2
f’c
16.000
30.000
33.172
61.500
10.575
0.553
I3
bf
10.000
40.000
44.391
150.000
24.874
1.328
I4
tf
0.080
0.413
0.670
3.400
0.555
0.431
I5
Ef
22.500
210.000
191.998
300.000
59.532
-0.453
I6
L
50.000
147.500
156.628
500.000
83.921
1.537
Y
Pu
4.110
11.560
14.921
54.680
10.194
1.489
Fig. 3. Multi-correlation graph of input and output variables used in this study