
Pham Phu Anh Huy / Tạp chí Khoa học và Công nghệ Đại học Duy Tân 04(65) (2024) 28-40
28
Simulate response of RC columns under cyclic loads by OpenSees
platform
Mô phỏng ứng xử của cột bê tông cốt thép chịu tải trọng lặp bằng phần mềm OpenSees
Pham Phu Anh Huya,b*
Phạm Phú Anh Huya,b*
aInstitute of Research and Development, Duy Tan University, Da Nang, 550000, Vietnam
aViện Nghiên cứu và Phát triển Công nghệ cao, Trường Đại học Duy Tân, Đà Nẵng, Việt Nam
bFaculty of Civil Engineerning, Duy Tan University, Da Nang, 550000, Vietnam
bKhoa Xây dựng, Trường Đại học Duy Tân, Đà Nẵng, Việt Nam
(Date of receiving article: 16/11/2023, date of completion of review: 28/02/2024, date of acceptance for posting:
06/03/2024)
Abstract
Hysteresis loops play a pivotal role in assessing the behavior of reinforced concrete (RC) columns, particularly when
subjected to cyclic loads or seismic events. This article aims to elucidate the significance of employing hysteresis curves
for the analysis of RC column behavior. In addition, the paper introduced a novel model designed to construct hysteresis
curves for RC columns featuring rectangular cross-sections. This innovative model is implemented within the OpenSees
platform comprising three springs that simulate the degradation of shear and stiffness. To verify its accuracy, the model's
outcomes are rigorously compared against experimental data. The results unequivocally demonstrate that the three-spring
model adeptly replicates the hysteresis loops of RC columns, with an average tolerance approaching unity, highlighting
its exceptional accuracy and potential utility.
Keywords: hysteresis loop; seismic response; cyclic response; RC column; OpenSees.
Tóm tắt
Đường cong trễ là một đồ thị đóng một vai trò quan trọng trong việc đánh giá ứng xử của cột bê tông cốt thép (BTCT),
đặc biệt khi chúng phải chịu tải trọng lặp hoặc động đất. Mục tiêu của bài báo là làm rõ tầm quan trọng của việc sử dụng
đường cong trễ để phân tích hành vi của các cột RC. Hơn nữa, bài báo giới thiệu một mô hình mới được đề xuất để xây
dựng đường cong trễ cho cột BTCT có tiết diện hình chữ nhật. Mô hình đề xuất này được xây dựng dựa trên phần mềm
OpenSees với ba liên kết lò xo để mô phỏng sự giảm cường độ, độ cứng. Để xác thực độ chính xác của mô hình đề xuất,
các kết quả của mô hình được so sánh với các dữ liệu thực nghiệm. Kết quả so sánh cho thấy rằng mô hình ba lò xo đã
mô phỏng một cách khá chính xác vòng lặp trễ của các cột BTCT, với sai số trung bình tiến gần đến một, cho thấy độ
chính xác rất tốt và khả năng áp dụng của nó.
Từ khóa: vòng lặp trễ; ứng xử động đất; ứng xử lặp; cột BTCT OpenSees.
*Corresponding author: Pham Phu Anh Huy
Email: phampanhhuy@duytan.edu.vn
04(65) (2024) 28-40
DTU Journal of Science and Technology
D U Y T AN UN IVERSI TY
TẠP CHÍ KHOA HỌC VÀ CÔNG NGHÊ ĐẠI HỌC DUY TÂN

Pham Phu Anh Huy / Tạp chí Khoa học và Công nghệ Đại học Duy Tân 04(65) (2024) 28-40
29
1. Introduction
The load-displacement curve for cyclic
reversal load or displacement could be called the
hysteresis loop. The hysteresis loop expresses in
terms of inelastic restoring force-translational
displacement relationship. It is a crucial
parameter for the seismic inelastic evaluation of
RC columns [1–5]. Numerous hysteresis models
have been developed to simulate the response of
RC columns. For instance, Clough [6] was a
researcher among early researchers who
investigated the effect of stiffness degradation in
RC structural members on the inelastic response
of multistory buildings to earthquakes. Inelastic
dynamic responses of two idealized multistory
buildings are analyzed for ordinary bilinear
hysteresis behavior and bilinear hysteresis
behavior with stiffness degradation property.
However, Clough [6] found that it was not able
to predict the maximum response of a stiffness
deterioration from results for the corresponding
ordinary bilinear system. Takeda et al. [7]
conducted a series of RC specimens that were
subjected to static tests and periodic earthquake
motions. An analytical model was developed to
simulate the earthquake response of the elements
and materials involved. Takeda et al. [7]
proposed a hysteresis loop that were defined by
the proposed force-displacement relationship. It
was not necessary to invoke additional sources
of energy dissipation for a satisfactory
prediction of the dynamic response. Takeda et al.
[7] also proposed three linear segments for the
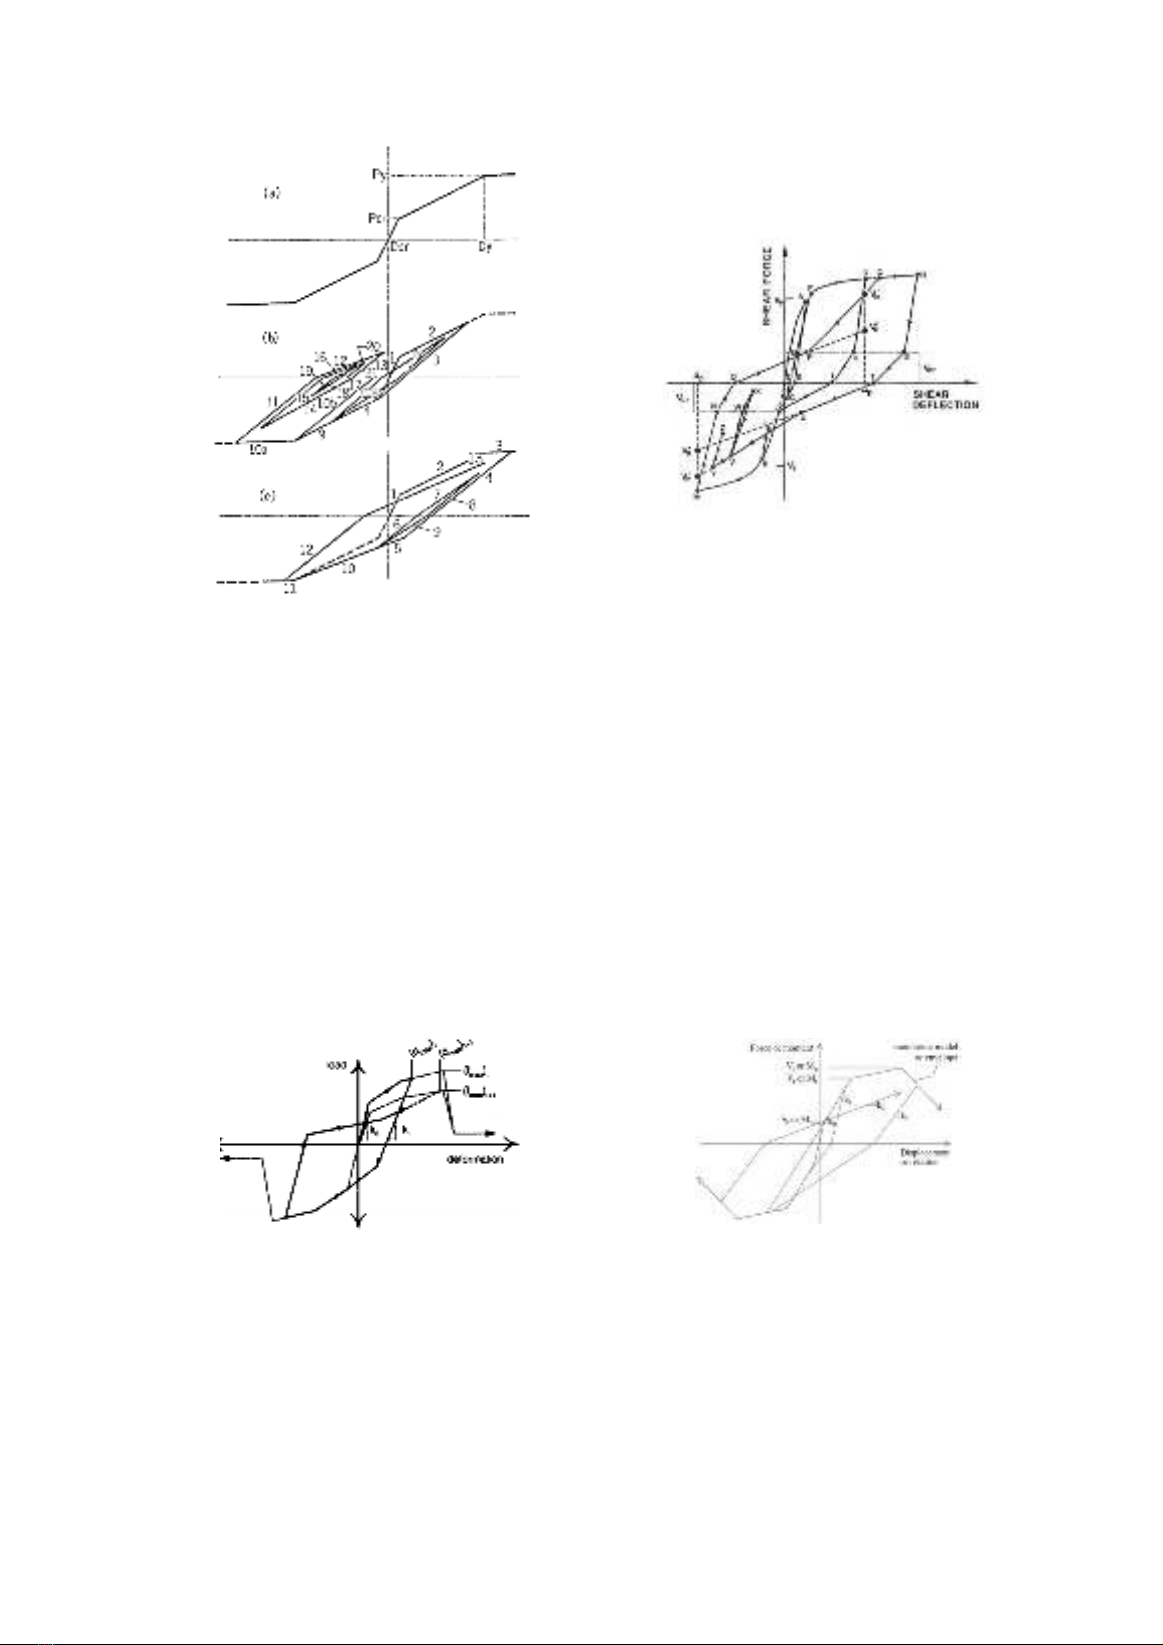
displacement-load curve. The first segment in
the curve refers to cracking point (𝑃𝑐𝑟,𝐷𝑐𝑟) that
were computed with concrete flexure tensile
strength. The yield load 𝑃𝑦 was obtained by
assuming a parabolic compressive stress-strain
curve for the concrete. The yield deflection (𝐷𝑦)
was the sum of four parts such as (1) the flexural
deflection caused by curvature based on a
cracked section; (2) the slip deflection caused by
the slip of the longitudinal reinforcement and
depression of the concrete at the beam-column
interface; (3) the deflection caused by
deformation of the platform; and (4) the shear
deflection. The hysteresis loop was proposed as
presented in Figure 1. Ozcebe et al. [8] proposed
a hysteresis shear model for the shear response
of RC members subjected to shear force and
bending moment reversals as presented in Figure
2. The model consists of a primary shear
backbone curve, unloading and reloading
branches under cyclic loading. The primary
curve is defined by any suitable procedure, i.e.,
using the fiber section method, or using
compression field theory is acceptable.
However, these procedures had to have a
definition of cracking and yield points. The
authors considered the interaction between
flexure, shear, and axial force under monotonic
loading. Furthermore, the confinement of
concrete core and strain hardening of reinforcing
steel was also accounted for.
Pham Phu Anh Huy / Tạp chí Khoa học và Công nghệ Đại học Duy Tân 04(65) (2024) 28-40
30
Figure 1. Load-deformation curve (Takeda et al. [7])
Figure 2. Hysteresis rules (Ozcebe et al. [8])
In addition, Lowes et al. [9] proposed a model
to simulate the response of RC beam-column
joints under reversed cyclic loading. The model
consists of a quad-linear backbone and
deterioration of strength and stiffness. This
deterioration was based on the energy and
displacement rules. The simple process was
proposed to analyze the primary inelastic
mechanism that simulated the failure of the joint
core under shear load and anchorage failure of
longitudinal steel embedded in the joint.
Sezen et al. [10] implemented the hysteresis
loop of RC columns by summation of separate
three components, i.e., flexure, shear, and slip
hysteresis models. The hysteresis rules for
flexure and slip components were the same and
presented in Figure 4 with slope factors
𝑘0,𝑘1,𝑘2,𝑎𝑛𝑑 𝑘3. The flexure hysteresis model
was based on the model of Takeda et al. [7] with
the modification. These changes were conducted
by comparison with experimental results.
Figure 3. Hysteresis rules (Lowes et al. [9])
Figure 4. Hysteresis rules (Sezen et al. [10])
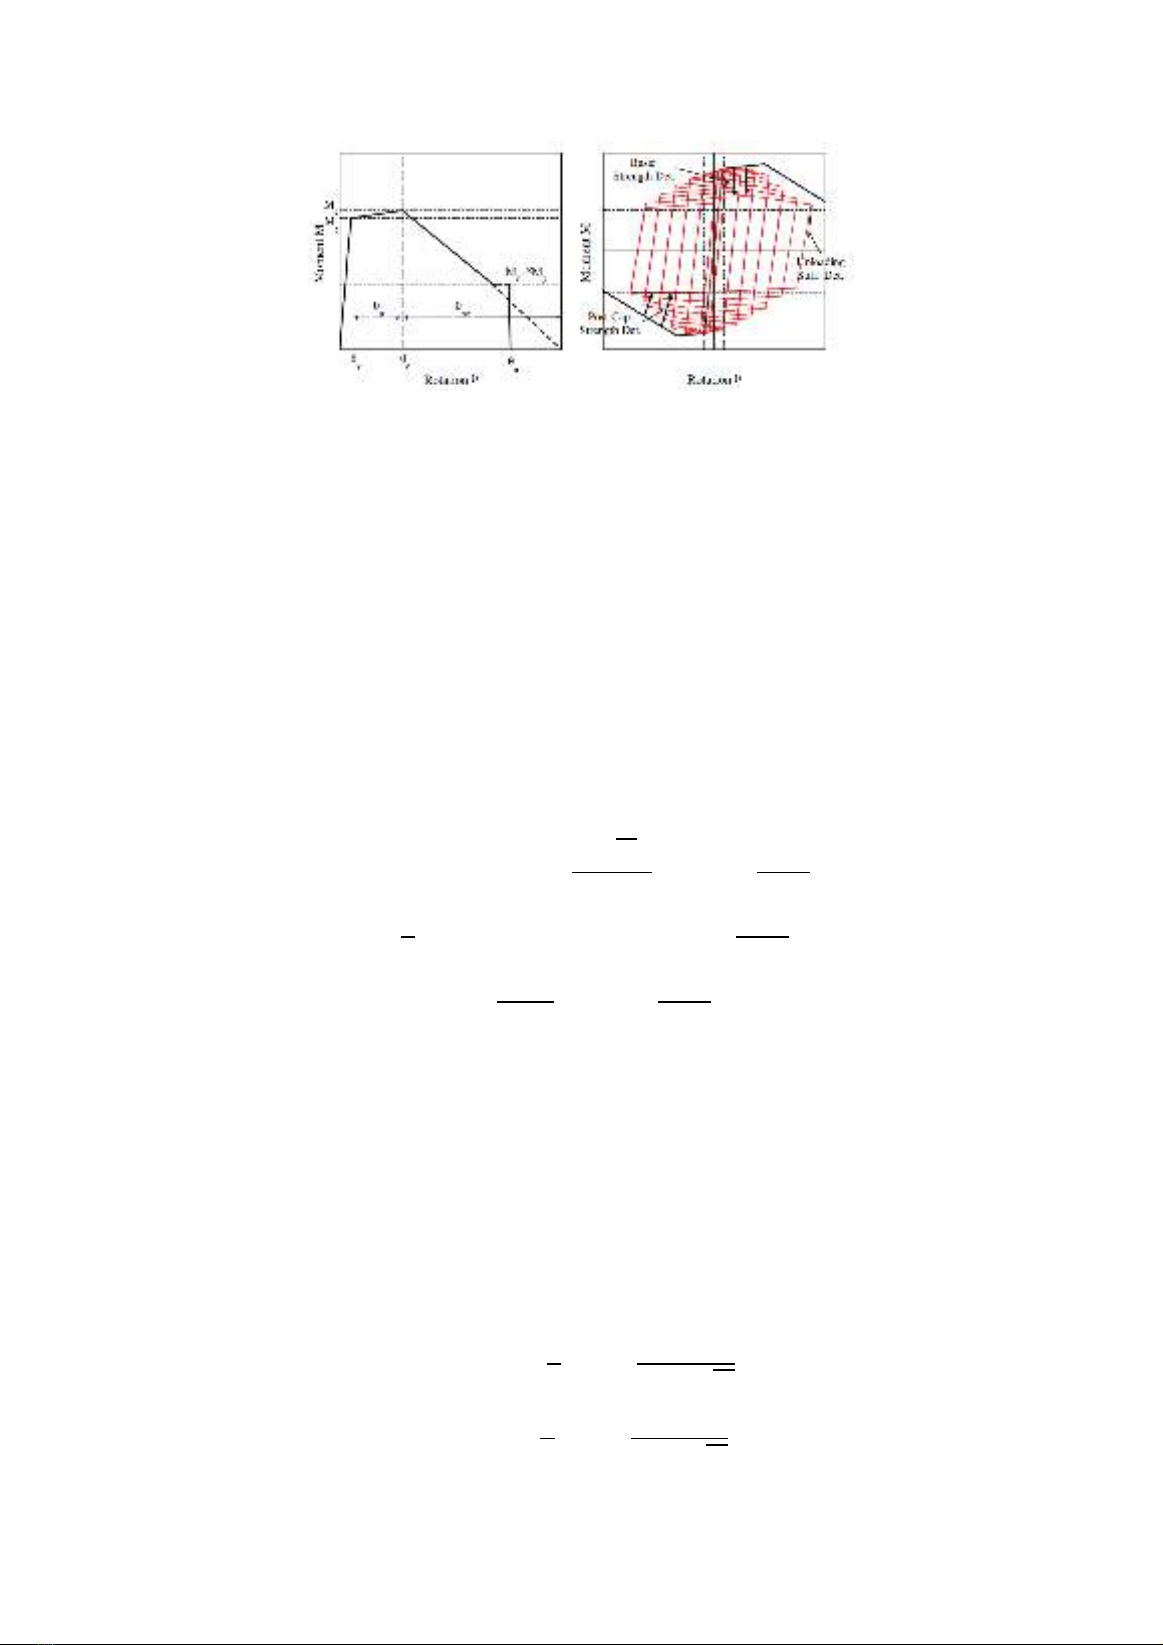
Lignos et al. [11] built a backbone curve that
presented the relationship between moment and
rotation angle as presented in Figure 5. The
backbone cure was defined by three parameters
(such as effective yield moment 𝑀𝑦, capping
moment strength 𝑀𝑐 or post-yield strength ratio
𝑀𝑐/𝑀𝑦, residual moment 𝑀𝑟=
𝑀𝑐), and four
deformation parameters (yield rotation 𝜃𝑦, pre-
capping plastic rotation 𝜃𝑝, post-capping plastic
rotation 𝜃𝑝𝑐, ultimate rotation capacity 𝜃𝑢). Yet,
Lignos et al. [11] implemented hysteresis rules
that simulate the effect of the cyclic moment-
rotation relationship at plastic hinge regions in
beams.
Pham Phu Anh Huy / Tạp chí Khoa học và Công nghệ Đại học Duy Tân 04(65) (2024) 28-40
31
Figure 5. Monotonic and hysteresis rules (Lignos et al. [11])
Lee et al. [12] accurately and efficiently
simulated the cyclic behavior of old RC columns
by using the Pinching4 model that considered
pinching and cyclic deterioration. It can be seen
that the Pinching4 material model with the
proposed empirical equations accurately
simulated the cyclic behavior of both flexure-
shear and shear-critical columns, including
pinching and cyclic degradation in strength and
stiffness. They proposed the monotonic
backbone curve and cyclic deterioration and
pinching, as presented in Figure 6. Modeling
parameters were implemented based on the forty
flexure-shear and shear critical column tests.
The pinching4 model can represent a pinched
load-deformation response of the members that
exhibited cyclic degradation in strength and
stiffness. Three parameters
𝑟𝐷𝑖𝑠𝑝,𝑟𝐹𝑜𝑟𝑐𝑒,𝑈𝑓𝑜𝑟𝑐𝑒 control pinching
behavior. 𝑟𝐷𝑖𝑠𝑝,𝑟𝐹𝑜𝑟𝑐𝑒 will control pinching
behavior in the reloading branch. 𝑈𝑓𝑜𝑟𝑐𝑒
controls the degree of pinching. Lee et al. [12]
proposed the equations that predicted three
parameters 𝑟𝐷𝑖𝑠𝑝,𝑟𝐹𝑜𝑟𝑐𝑒,𝑈𝑓𝑜𝑟𝑐𝑒.
𝑟𝐷𝑖𝑠𝑝=1.11+27.8𝜌𝑣−0.5𝑒𝑣+0.14ln(𝑠√𝑓𝑦
31.62𝐷𝑙)−1.12(𝑓𝑦
1000)
𝑟𝐹𝑜𝑟𝑐𝑒=−0.67+0.43 (𝑠
𝑑)+14.52𝜌𝑙+41.09𝜌𝑣+0.75(𝑓𝑦
1000)
𝑢𝐹𝑜𝑟𝑐𝑒=−0.8+23.23𝜌𝑣−8.38(𝐴𝑣𝑓𝑦𝑣
𝐴𝑔𝑓𝑐′)+1.96(𝑓𝑦𝑣
1000)
(1)
where 𝜌𝑙,𝜌𝑣 are the ratio of longitudinal and
transverse steel; 𝑣 =𝑃/𝐴𝑔𝑓𝑐′ is the ALR; 𝑠 is the
spacing of transverse reinforcement; 𝑑 is the
effective depth.
Through statistical data, Lee et al. [12]
proposed the simplified equation to estimate the
parameters that controlled the backbone curve,
such as 𝑀𝑐𝑟 ,𝑀𝑦,𝑀𝑐,𝑘𝑐𝑟,𝑘𝑦0,𝑘𝑐0,𝑘𝑛0 as
presented in Figure 6.
𝑀𝑐𝑟 =𝑒−2.94𝑏0.75ℎ1.52𝐿0.34𝜌𝑙0.21𝜌𝑣
0.05
𝑀𝑦=𝑒−0.95𝑏0.93ℎ1.23𝐿0.49𝜌𝑙0.54𝜌𝑣
0.14
𝑀𝑐=𝑒−2.45𝑏0.81ℎ1.25𝐿0.45𝜌𝑙0.51𝜌𝑣
0.07
(2)
𝑘𝑐𝑟 =𝑒1.33𝑏1.01ℎ1.86(𝑣+0.1)0.58𝜌𝑣
−0.19(𝑎
𝑑)−0.26(𝜏
31.62√𝑓𝑐′)0.2
𝑘𝑦0 =𝑒0.4𝑏0.99ℎ1.87(𝑣+0.1)0.64𝜌𝑣
−0.23(𝑎
𝑑)−0.32(𝜏
31.62√𝑓𝑐′)0.09
(3)

Pham Phu Anh Huy / Tạp chí Khoa học và Công nghệ Đại học Duy Tân 04(65) (2024) 28-40
32
𝑘𝑐0 =𝑒−4.6𝑏0.94ℎ2.4(𝑣+0.1)0.97𝜌𝑣
−0.05(𝑎
𝑑)−0.6(𝜏
31.62√𝑓𝑐′)0.64
𝑘𝑛0 =𝑒−1.04𝑏0.74ℎ1.94(𝑣+0.1)0.69𝜌𝑣
−0.26(𝑎
𝑑)−0.3(𝜏
31.62√𝑓𝑐′)0.17
where all parameters are in mm, MPa unit; 𝐿 is
the length of the equivalent cantilever column; 𝑎
is the shear span; 𝜏=𝑉𝑛/𝑏ℎ is the nominal shear
stress (MPa); 𝜈=𝑃/𝐴𝑔𝑓𝑐′ is the ALR.
Figure 6. Backbone and cyclic curves for the Pinching4 model (Lee et al. [12])
2. Research methodology
The hysteresis loops of RC rectangular
columns were implemented by OpenSees
through four cases as follows:
Case 1: using the force-based beam-column
element,
Case 2: using the displacement-based beam-
column element;
Case 3: using the plastic hinge element;
Case 4: using three-spring model (shear, slip,
and axial springs).
A thorough comparison of the results from
these four cases was conducted against
experimental test results, leading to insightful
discussions. This multifaceted approach not only
provided a nuanced understanding of the
structural response but also facilitated a
comprehensive assessment of the simulation
outcomes in relation to real-world observations.
2.1. Using force-based beam-column element
The force-based beam-column element is
used to build a force-beam-column element
object based on the iterative force-based
formulation. In force-based beam-column
element, some numerical integration options
could be used to determine and encompass both
distributed plasticity and plastic hinge
integration. The command of the forced-based
beam-column element is as follows:
𝑒𝑙𝑒𝑚𝑒𝑛𝑡 𝑓𝑜𝑟𝑐𝑒𝐵𝑒𝑎𝑚𝐶𝑜𝑙𝑢𝑚𝑛 $𝑒𝑙𝑒𝑇𝑎𝑔 $𝑖𝑁𝑜𝑑𝑒 $𝑗𝑁𝑜𝑑𝑒 $𝑡𝑟𝑎𝑛𝑠𝑓𝑇𝑎𝑔 "𝐼𝑛𝑡𝑒𝑔𝑟𝑎𝑡𝑖𝑜𝑛𝑇𝑦𝑝𝑒
𝑎𝑟𝑔1 𝑎𝑟𝑔2 …" <−𝑚𝑎𝑠𝑠 $𝑚𝑎𝑠𝑠𝐷𝑒𝑛𝑠><−𝑖𝑡𝑒𝑟 $𝑚𝑎𝑥𝐼𝑡𝑒𝑟𝑠 $𝑡𝑜𝑙>
(4)
where $𝑒𝑙𝑒𝑇𝑎𝑔 is the element tag;
$𝑖𝑁𝑜𝑑𝑒 $𝑗𝑁𝑜𝑑𝑒 is the end nodes I and J;
$𝑡𝑟𝑎𝑛𝑠𝑓𝑇𝑎𝑔 is the identifier for previously-
defined coordinate-transformation object;
𝐼𝑛𝑡𝑒𝑔𝑟𝑎𝑡𝑖𝑜𝑛𝑇𝑦𝑝𝑒 𝑎𝑟𝑔1 𝑎𝑟𝑔2... specify
weights and locations of integration points and
their associated section force-deformation
models; $𝑚𝑎𝑠𝑠𝐷𝑒𝑛𝑠 is the element mass
density per unit length (optional, default=0.0);
$𝑚𝑎𝑥𝐼𝑡𝑒𝑟𝑠 is the maximum number of
iterations to undertake to satisfy element
compatibility (optional, default=10); $𝑡𝑜𝑙 is the
tolerance for satisfaction of element
compatibility (optional, default=10-12).