
Int.J.Curr.Microbiol.App.Sci (2018) 7(11): 2770-2776
2770
Original Research Article https://doi.org/10.20546/ijcmas.2018.711.318
Character Association and Path Coefficient Analysis for Yield and Its
Components in Pigeonpea (Cajanus cajan (L.) Mill sp.)
Parsagoni Mallesh1,2*, Nidhi Mohan2,3, Jake Lee2,4, H.C. Nanda1 and
C.V. Sameer Kumar2
1Department of Genetics and Plant Breeding, Indira Gandhi Agricultural University,
Raipur-492012, Chhattisgarh, India
2International Crops Research Institute for the Semi-Arid Tropics (ICRISAT),
Patancheru-502324, India
3Department of Genetics and Plant Breeding, Acharya NG Ranga Agricultural University,
Bapatla, Guntur-522 509, India
4Department of Horticulture, Benguet state university, Philippines 2601
*Corresponding author
A B S T R A C T
Introduction
Pigeonpea [Cajanus cajan (L.) Mill sp.] is the
most important pulse crop of our country,
though its productivity is very low. Yield is a
complex and multiplicative trait, which is
highly influenced by environment. The
information on correlation coefficient of yield
and yield attributes will assist the breeders
whether to give due importance on each of the
traits to make significant genetic gain. Path
coefficient analysis aids partitioning of the
correlation coefficient into direct and indirect
effects and thus provides a better insight on
the characters and their relationship with
yield. The correlation and path analysis thus
help in identifying suitable traits for
improving the seed yield. The present
International Journal of Current Microbiology and Applied Sciences
ISSN: 2319-7706 Volume 7 Number 11 (2018)
Journal homepage: http://www.ijcmas.com
The estimates of genotypic correlation coefficients in general were higher than their
corresponding phenotypic correlation coefficients indicating strong inherent association
among the traits. The seed yield per plant had significant and positive association with
number of primary branches plant-1, number of secondary branches plant-1, number of pods
plant-1, number of seeds plant-1, biological yield plant-1, seed yield (kg/ha) harvest index
and 100-seed weight at both genotypic as well as phenotypic levels. Characters viz., pollen
fertility%, biological yield plant-1, harvest index, number of secondary branches plant-1 and
dal recovery% exerted high direct effects on seed yield. 100-seed weight and pods plant-1
also contributed indirectly towards seed yield per plant through most of the characters.
Thus, based on the present study number of primary branches plant-1, number of secondary
branches plant-1, number of pods plant-1, number of seeds plant-1, biological yield plant-1,
seed yield (kg/ha) harvest index and 100-seed weight were emerged as the most important
components of seed yield.
Keywords
Correlation coefficient,
Path analysis, Pollen
fertility and pigeonpea
Accepted:
22 October 2018
Available Online:
10 November 2018
Article Info

Int.J.Curr.Microbiol.App.Sci (2018) 7(11): 2770-2776
2771
investigation was under taken to assess the
association of yield and yield attributes and to
estimate the direct and indirect effects of each
character on seed yield in pigeonpea.
Materials and Methods
A total of 28 genotypes including 3 varietal
checks (Asha, Maruti, Rajeevlochan) and 2
hybrid checks (ICPH 2740 and ICPH 2671)
were grown in randomized complete block
design (RCBD) with three replications and
two rows per plot each of 4 meter length with
a spacing of 75 and 50 cm between and within
rows respectively at International Crops
Research Institute for the Semi-Arid Tropics
(ICRISAT), Patancheru. The recommended
agronomic practices were followed for raising
a good and healthy crop. In each replication
five plants were selected randomly in each
genotype for recording observations on days
to 50% flowering, pollen fertility%, days to
maturity, plant height (cm), number of
primary branches plant-1, number of secondary
branches plant-1, number of pods plant-1,
number of seeds pod-1, number of seeds
plant-1, 100-seed weight (g), seed yield plant-1
(g), biological yield plant-1, seed yield (kg
ha-1), harvest index (%) and seed protein
content were recorded. The data were
statistically analyzed to estimate the
phenotypic correlation coefficients of yield,
yield attributes, Path coefficient analysis was
done for yield, and yield attributes to estimate
the direct and indirect effects of various
characters on seed yield by using the software
INDOSTAT.
Results and Discussion
The analysis of variance indicated significant
differences among genotypes for all the
characters. The correlation coefficients
between seed yield and yield attributes are
presented in Table 1. Genotypic correlations
(Table 1) were higher in magnitude than the
phenotypic correlation indicting strong
inherent relationship among the characters
except few, which could be due to modifying
effects in the environment studied. Pandey and
Singh (2002) reported similar findings.
Genotypic correlation provides a measure of
genotypic association among different traits
and helps in identifying the traits in selection.
In the present study, seed yield per plant
recorded significant and positive association
with seed yield plant-1 was observed to be
significantly and positively associated with
number of primary branches plant-1, number
of secondary branches plant-1, number of pods
plant-1, number of seeds plant-1, biological
yield plant-1 and seed yield (kg/ha) at both
phenotypic and genotypic levels and harvest
index showed positive association both
phenotypic and genotypic but significant only
genotypic level. However, seed yield plant-1
was also observed to be significantly and
negatively associated with days to 50%
flowering, days to maturity and pollen
fertility%. Association of seed yield plant-1
with other characters, viz., plant height,
number of seeds pod-1, 100-seed weight and at
both phenotypic and genotypic levels was
found but non-significant. However, it
recorded negative and significant association
with plant height, days to 50% flowering, days
to maturity and straw yield at phenotypic level
(Table 1). The results of the present study are
in conformity with the reports of Aher et al.,
(1998); Musaana and Nahdy (1998) and
Chandirakala and Subbaraman (2010). Among
the yield contributing traits, positive and
significant association were evident for days
to maturity with plant height, days to
50%flowering with days from flowering to
maturity; seeds per pod with number of
primary branches and pod length; days to50%
flowering with plant height as well as specific
gravity with test weight; which are in
conformity with earlier reports (Salunke et al.,
1995, Vikas and Singh, 1998, Baskaran and
Muthiah, 2006, Sodavadiya et al., 2009,

Int.J.Curr.Microbiol.App.Sci (2018) 7(11): 2770-2776
2772
Sawant et al., 2009). However, VasanthaRao
et al., (2010) reported non-significant but
positive association of test weight with seed
yield.
Studies on inter-character associations among
the yield components studied had revealed
significant and positive association of days to
50% flowering with days to maturity, pollen
fertility % and 100-seed weight; days to
maturity with pollen fertility and seed yield
(kg/ha); number of primary branches plant-1
with number of secondary branches plant-1,
plant height, biological yield plant-1and seed
yield (kg/ha).
Number of secondary branches per plant with
number of pods plant-1; number of seeds plant-
1, biological yield plant-1 and seed yield
(kg/ha); plant height with 100-seed weight;
number of pods plant-1 with number of seeds
plant-1, biological yield plant-1 and seed yield
(kg/ha); Number of seeds plant-1 with
biological yield plant-1 and seed yield (kg/ha);
biological yield plant-1 with seed yield (kg/ha)
similarly, seed yield (kg/ha) with harvest
index positive and significant at both the
phenotypic and genotypic level indicating the
possibility of simultaneous improvement of
these characters through selection.
However significant and negative inter
character association was observed for days to
50% flowering with number of primary
branches plant-1, number of pods plant-1,
number of seeds plant-1, biological yield
plant-1 and seed yield (kg/ha); days to maturity
with number of primary branches plant-1,
number of pods plant-1 and biological yield
plant-1; biological yield plant-1 with harvest
index at phenotypic and genotypic levels,
indicating competition for a common
possibility, such as nutrient supply (Adams,
1967; Adams and Grafius, 1971) and the need
for balanced selection, while attempting for
improvement of these traits.
The characters viz., number of primary
branches plant-1, number of secondary
branches plant-1, number of pods plant-1,
number of seeds plant-1, biological yield plant-
1, seed yield (kg/ha) harvest index and 100-
seed weight recorded positive association with
seed yield, which indicated that these are
major yield contributing traits in pigeonpea.
Hence, laying stress on these traits will aid in
making significant improvement of yield
potentiality in pigeonpea.
Path coefficient analysis considers direct as
well as indirect effects of the variables by
partitioning the correlation coefficients. The
detailed path coefficient analysis (Table 2)
showed that pollen fertility % had maximum
positive direct effect fallowed by biological
yield plant-1, harvest index, number of
secondary branches plant-1 and dal recovery%.
Whereas, the characters viz., days to 50%
flowering, days to maturity, and seed protein
content showed negative and high direct
effects on grain yield at both genotypic and
phenotypic levels. Whereas, number of seeds
plant-1, number of primary branches, 100-seed
weight and number of seeds pod-1 in these
cases genotypic had showed negative direct
effect but phenotypic had showed positive and
direct effects on the seed yield plant-1.
Plant height and number of pods plant-1 at
genotypic level had showed positive direct
effect but negative direct effect on the grain
yield at phenotypic level. The highly
significant and positive correlation of pollen
fertility % had found with grain yield due to
their maximum direct and indirect effect via
days to 50% flowering and days to maturity
respectively. Number of seeds pod-1 showed
medium positive direct effect and their
genotypic correlation with grain yield was
significant. Similar results were also reported
by Rao et al., (2013) for number of primary
branches, pods plant-1, seeds pod-1, days to
50% flowering and harvest index.
Int.J.Curr.Microbiol.App.Sci (2018) 7(11): 2770-2776
2773
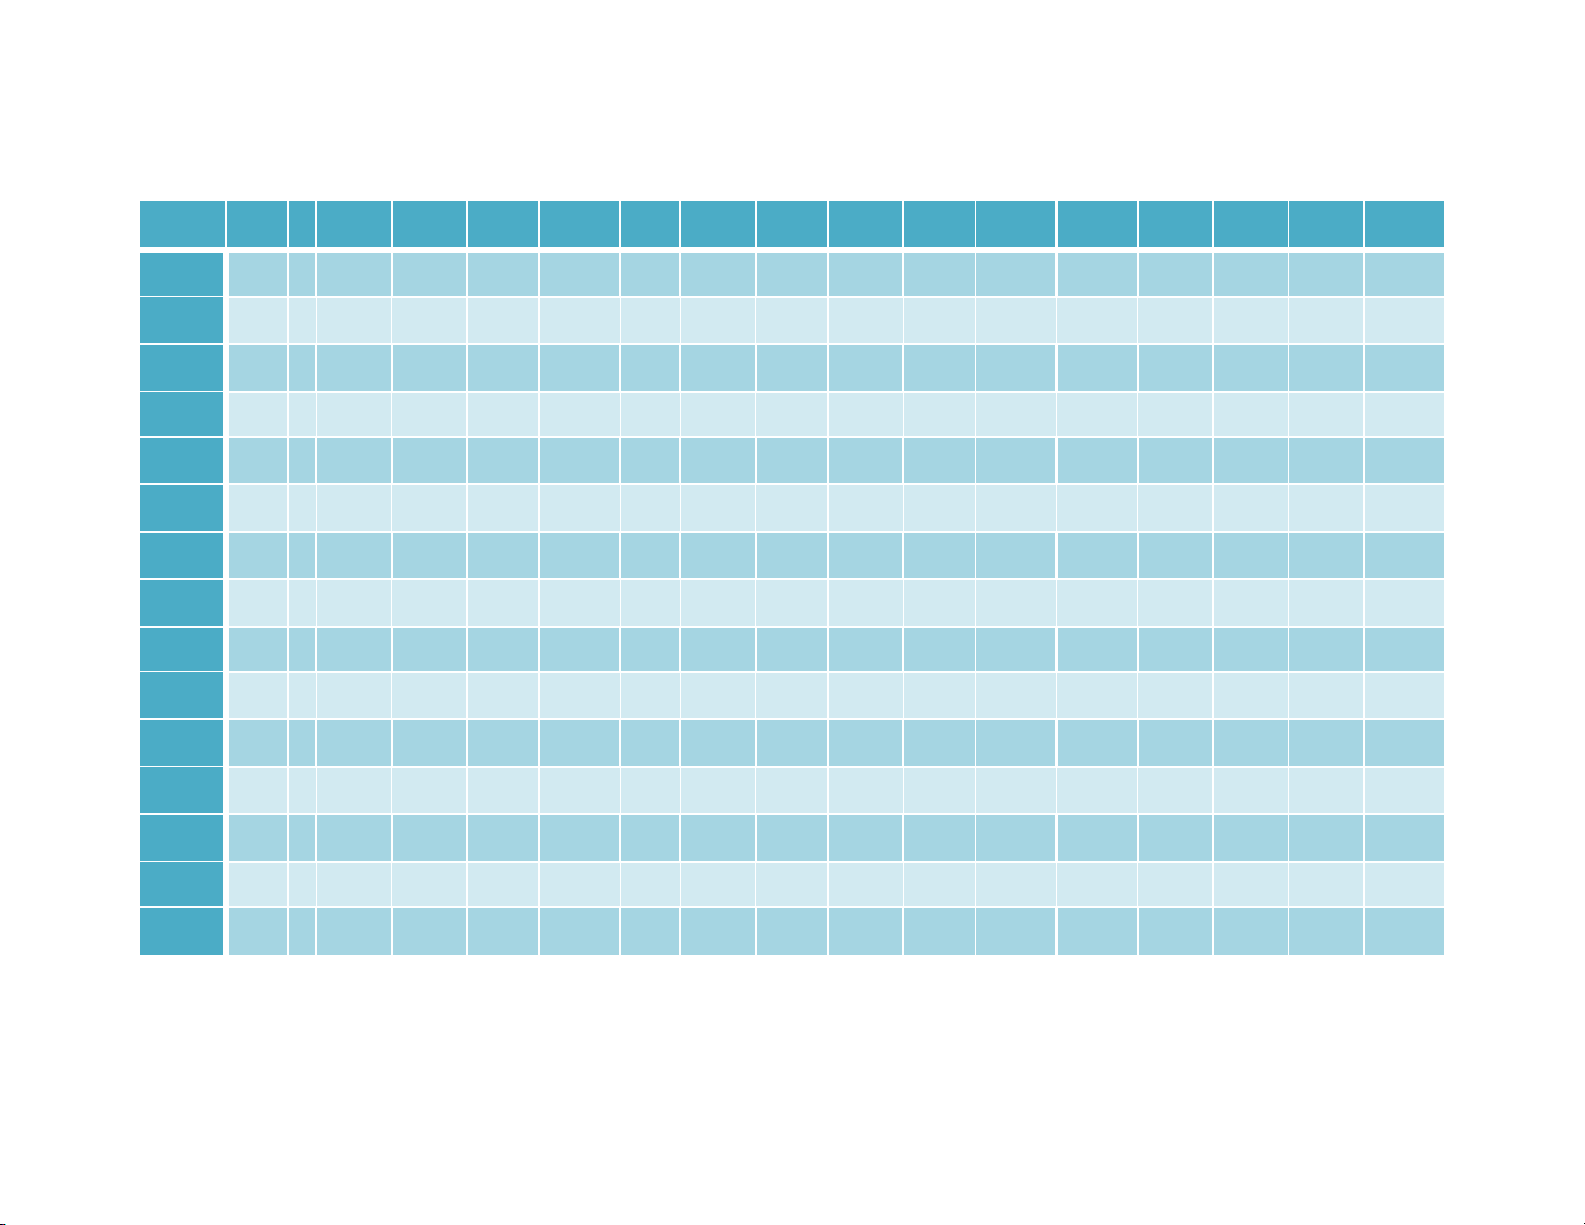
Table.1 Phenotypic and Genotypic correlations for yield and yield components in pigeonpea genotypes
Character
Corre.
Coeffi.
1
2
3
4
5
6
7
8
9
10
11
12
13
14
15
16
1
G
P
1
1
0.861***
0.733***
0.977***
0.941***
-0.201
-0.134
-0.53***
-0.257*
0.11
0.046
-0.350**
-0.242*
-0.38***
-0.143
-0.263*
-0.223*
0.243*
0.339**
-0.31**
-0.264*
-0.357***
-0.317**
0.060
0.021
-0.244*
-0.164
0.102
0.051
-0.297**
-0.254*
2
G
P
1
1
0.951***
0.910***
-0.59***
-0.315**
-0.785***
-0.312***
0.182
0.019
-0.38***
-0.241*
-0.47***
-0.175
-0.33**
-0.208
0.185
0.101
-0.474***
-0.328**
-0.503***
0.405***
0.057
-0.022
0.057
-0.082
0.011
-0.001
-0.453***
-0.298**
3
G
P
1
1
-0.39***
-0.236*
-0.670***
-0.297**
0.142
0.049
-0.37***
-0.256*
-0.43***
-0.169
-0.299**
-0.224*
0.28**
0.195
-0.390***
-0.299**
-0.438***
-0.385***
0.049
-0.009
-0.101
-0.140
0.079
0.044
-0.379***
-0.284**
4
G
P
1
1
1.074***
0.353***
0.26*
0.257*
-0.099
0.064
0.52***
0.021
0.351**
0.132
0.133
0.125
0.836***
0.394***
0.861***
0.319**
0.183
0.006
-0.259*
-0.109
0.293**
0.041
0.735***
0.260**
5
G
P
1
1
-0.073
-0.057
0.594***
0.395***
0.212*
-0.053
0.619***
0.404***
0.018
0.080
1.013***
0.504***
0.761***
0.376***
0.176
-0.102
0.181
-0.046
0.271*
0.076
0.971***
0.579***
6
G
P
1
1
0.015
0.081
0.73***
0.184
-0.029
0.002
0.334**
0.296**
-0.062
0.060
0.0938
0.089
0.201
0.098
0.042
0.105
0.197
0.129
-0.221*
-0.154
7
G
P
1
1
0.49***
-0.019
0.909***
0.641***
-0.37***
-0.173
0.291**
0.271*
0.323**
0.302**
0.045
0.045
0.271*
0.087
0.40***
0.152
0.663***
0.579***
8
G
P
1
1
0.0286
-0.061
0.47***
0.156
-0.016
0.0347
-0.024
0.010
-0.187
-0.116
0.306**
0.107
-0.192
-0.032
-0.022
-0.093
9
G
P
1
1
-0.38***
-0.20
0.641***
0.432***
0.386***
0.330**
0.117
-0.024
0.245*
0.039
0.353***
0.223*
0.809***
0.59****
10
G
P
1
1
-0.054
0.029
-0.122
-0.065
0.017
0.047
0.441***
0.13
0.021
-0.002
-0.323**
-0.136
11
G
P
1
1
0.349**
0.330 **
-0.318**
-0.245*
0.099
0.044
0.097
0.132
0.542***
0.497***
12
G
P
1
1
0.520
0.459***
0.039
0.083
0.154
0.106
0.636***
0.527***
13
G
P
1
1
0.009
0.047
0.362
0.109
0.273*
0.170
14
G
P
1
1
0.421***
0.118
0.124
-0.004
15
G
P
1
1
0.326**
0.201
Note: Significant at *- 5% level, ** - 1% and*** - 0.1% level of significance
Note: 1- Days to 50% flowering, 2- Days to maturity, 3- Pollen fertility, 4- No. of primary branches plant-1,5-No.of secondary branches plant-1, 6- Plant height, 7-
Pods plant-1, 8-Seeds pod-1,9-Seeds plant-1, 10- 100-seed weight, 11-Biological yield plant-1, 12- Yield (kg/ha), 13- Harvest index, 14- seed protein content, 15-
Dal recovery% and 16-Yield plant-1.
Int.J.Curr.Microbiol.App.Sci (2018) 7(11): 2770-2776
2774
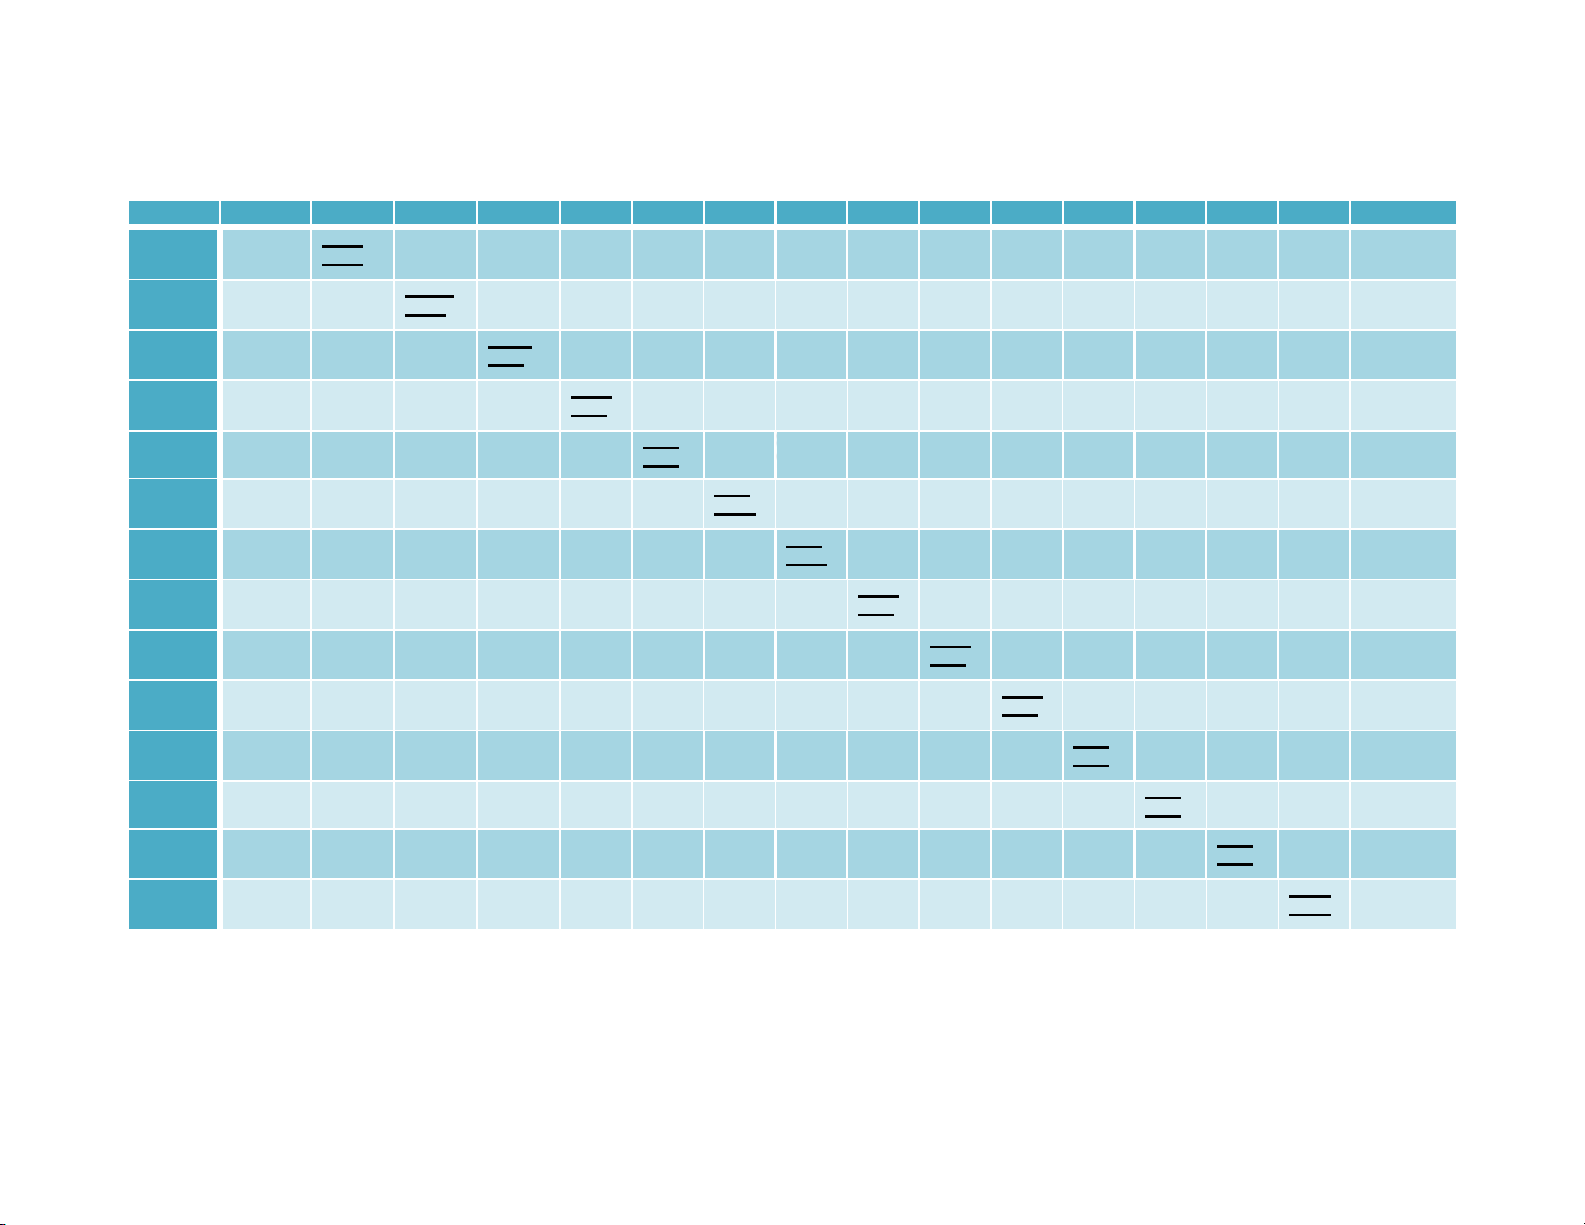
Table.2 Genotypic and Phenotypic path co-efficient for yield and yield components in pigeonpea
Character
Pathcoeff.
1
2
3
4
5
6
7
8
9
10
11
12
13
14
rg and rp
1
G
P
-13.13
-0.362
-10.121
-0.388
23.331
-0.499
0.182
0.071
-0.068
0.136
0.023
-0.024
-0.353
0.128
0.072
0.076
0.325
0.118
-0.083
-0.129
-0.577
0.139
0.071
-0.011
0.000
-0.027
0.034
0.087
-0.297**
-0.254*
2
G
P
-11.309
-0.275
-11.752
-0.223
22.814
-0.341
0.609
0.118
-0.099
0.117
0.038
-0.007
-0.384
0.090
0.089
0.066
0.408
0.078
-0.045
-0.038
-0.883
0.123
0.068
0.008
0.000
0.001
-0.008
0.031
-0.453***
-0.298**
3
G
P
-12.804
0.837
-11.206
0.809
23.942
0.547
0.381
-0.210
-0.085
-0.265
0.030
0.043
-0.379
-0.228
0.080
-0.151
0.377
-0.199
-0.069
0.173
-0.728
-0.266
0.066
-0.008
0.000
0.039
0.015
-0.125
-0.379***
-0.284**
4
G
P
2.380
-0.012
7.132
-0.029
-9.083
-0.022
-1.014
0.122
0.138
0.033
0.049
0.024
-0.064
0.006
-0.102
0.002
-0.452
0.012
-0.032
0.012
1.565
0.037
0.215
0.001
0.001
0.004
0.044
-0.010
0.735***
0.260**
5
G
P
7.072
-0.056
9.333
-0.067
-16.277
-0.064
-1.108
0.076
0.117
0.297
-0.017
-0.013
0.599
0.085
-0.042
-0.011
-0.774
0.087
-0.005
0.017
1.894
0.108
0.209
-0.022
0.001
0.016
-0.026
-0.010
0.971***
0.579***
6
G
P
-1.433
-0.011
-2.126
-0.005
3.419
-0.012
-0.234
-0.063
-0.01
0.014
0.212
-0.270
0.014
-0.020
-0.138
-0.046
0.037
-0.000
-0.081
-0.074
-0.115
-0.015
0.239
-0.024
0.001
-0.032
-0.006
-0.026
-0.221*
-0.154
7
G
P
4.593
-0.073
4.472
-0.072
-8.984
-0.077
0.064
0.019
0.074
0.118
0.003
0.024
1.008
-0.390
-0.095
-0.006
-1.122
0.192
0.090
-0.051
0.542
0.081
0.054
0.014
0.002
0.046
-0.038
0.026
0.663***
0.579***
8
G
P
4.951
-0.001
5.524
-0.001
-10.008
-0.001
-0.537
0.000
0.027
-0.000
0.154
0.001
0.505
-0.000
-0.191
0.007
-0.035
-0.001
-0.114
0.001
-0.031
0.000
-0.222
-0.001
-0.001
-0.000
-0.043
0.001
-0.022
-0.093
9
G
P
3.457
-0.032
3.885
-0.03
-7.306
-0.033
-0.368
0.019
0.079
0.059
-0.006
0.000
0.918
0.093
-0.006
-0.009
-1.238
0.195
0.092
-0.029
1.193
0.063
0.139
-0.004
0.001
0.033
-0.034
0.006
0.809***
0.59****
10
G
P
-4.448
-0.005
-2.179
-0.002
6.74
-0.004
-0.134
-0.003
0.002
-0.002
0.071
-0.006
-0.374
0.004
-0.089
-0.003
0.474
0.004
-0.242
0.288
-0.101
-0.001
0.019
-0.001
0.000
0.000
-0.062
-0.003
-0.323**
-0.136
11
G
P
4.074
-0.057
5.574
-0.071
-9.362
-0.065
-0.845
0.085
0.129
0.109
-0.013
0.013
0.294
0.059
0.003
0.008
-0.791
0.094
0.013
0.006
1.858
0.289
-0.377
-0.053
0.000
0.029
-0.015
0.009
0.542***
0.497***
12
G
P
-0.791
0.004
-0.673
-0.004
1.334
-0.001
-0.182
0.001
0.022
-0.019
0.043
0.019
0.046
0.009
0.036
-0.023
-0.145
-0.005
-0.004
0.009
-0.592
-0.048
1.184
0.196
0.001
0.021
-0.001
0.01
0.273*
0.170
13
G
P
-1.342
0.003
-0.125
0.0001
1.471
0.003
-0.308
0.002
0.035
0.004
0.042
0.008
0.406
0.009
0.037
-0.000
-0.436
0.013
-0.005
-0.000
0.181
0.001
0.428
0.006
0.004
0.059
-0.059
0.007
0.326**
0.201
14
G
P
3.205
0.003
-0.669
0.002
-2.623
0.003
0.318
0.002
0.023
0.000
0.009
-0.002
0.273
-0.001
-0.058
-0.002
-0.303
-0.001
-0.107
-0.003
0.186
-0.001
0.011
0.001
0.002
0.001
-0.141
-0.019
0.124
-0.004
Residual effect=0.4788 for Genotypic path and Residual effect=0.5680 for Phenotypic path coefficients. Diagonal values = direct effects Off-diagonal values =
indirect effects.
Note: 1-Days to 50% flowering, 2-Days to maturity, 3-Pollen fertility%, 4-No.of primary branches plant-1,5-No.of secondary branches plant-1, 6-Plant height, 7-
Pods plant-1, 8-Seeds pod-1,9-Seeds plant-1, 10-100-seed weight, 11-Biological yield plant-1, 12-Harvest index, 13-Dal recovery% and 14-seed protein content.
rg and rp – Genotypic correlation and Phenotypic correlation

![Đa dạng sinh học: Chương 7 [Thông tin chi tiết]](https://cdn.tailieu.vn/images/document/thumbnail/2017/20170821/kloiroong10/135x160/31503278065.jpg)


%20--%3e%3cdefs%3e%3cstyle%3e%20.st0%20{%20fill:%20%23fff;%20}%20.st1%20{%20fill:%20%237800fa;%20}%20%3c/style%3e%3c/defs%3e%3cpath%20class='st1'%20d='M117.78,12.18H43.11c2.9,3.47,4.65,7.94,4.65,12.82,0,5.6-2.3,10.66-6.01,14.29h76.02l7.22-13.56-7.22-13.56Z'/%3e%3cg%3e%3cpath%20class='st0'%20d='M53.58,26.17h-.59v-1.46h.59v-4.96h2.83c1.78,0,2.67.94,2.67,2.82v5.76c0,1.87-.89,2.81-2.67,2.81h-2.83v-4.96ZM55.36,21.37v3.34h1.1v1.46h-1.1v3.34h1.01c.61,0,.91-.37.91-1.1v-5.93c0-.74-.3-1.1-.91-1.1h-1.01Z'/%3e%3cpath%20class='st0'%20d='M65.99,31.14h-1.8l-.31-2.07h-2.19l-.31,2.07h-1.64l1.82-11.39h2.62l1.82,11.39ZM65.28,18.04c-.25.46-.51.77-.75.94-.21.15-.47.22-.79.22-.26,0-.57-.07-.92-.22l-.38-.15c-.14-.05-.26-.07-.37-.07-.3,0-.53.18-.71.54l-.91-.68c.25-.46.51-.77.75-.94.21-.14.48-.21.79-.21.26,0,.57.07.92.21l.38.15c.14.05.26.07.37.07.3,0,.53-.18.71-.54l.91.68ZM61.91,27.52h1.73l-.87-5.76-.87,5.76Z'/%3e%3cpath%20class='st0'%20d='M74.53,26.89v1.52c0,1.91-.89,2.86-2.67,2.86s-2.67-.95-2.67-2.86v-5.93c0-1.91.89-2.86,2.67-2.86s2.67.95,2.67,2.86v1.11h-1.69v-1.22c0-.75-.31-1.12-.93-1.12s-.93.37-.93,1.12v6.15c0,.74.31,1.11.93,1.11s.93-.37.93-1.11v-1.63h1.69Z'/%3e%3cpath%20class='st0'%20d='M81.4,31.14h-1.8l-.31-2.07h-2.19l-.31,2.07h-1.64l1.82-11.39h2.62l1.82,11.39ZM75.9,19.2l1.52-1.91h1.71l1.51,1.91h-1.61l-.76-.95-.75.95h-1.61ZM77.32,27.52h1.73l-.87-5.76-.87,5.76ZM83.1,15.99l-1.76,1.91h-1.26l1.17-1.91h1.86Z'/%3e%3cpath%20class='st0'%20d='M84.86,19.75c1.78,0,2.67.94,2.67,2.82v1.48c0,1.87-.89,2.81-2.67,2.81h-.85v4.28h-1.79v-11.39h2.64ZM84.01,21.37v3.86h.85c.58,0,.87-.36.87-1.08v-1.71c0-.71-.29-1.07-.87-1.07h-.85Z'/%3e%3cpath%20class='st0'%20d='M93.51,19.75c1.78,0,2.67.94,2.67,2.82v1.48c0,1.87-.89,2.81-2.67,2.81h-.85v4.28h-1.79v-11.39h2.64ZM92.66,21.37v3.86h.85c.58,0,.87-.36.87-1.08v-1.71c0-.71-.29-1.07-.87-1.07h-.85Z'/%3e%3cpath%20class='st0'%20d='M98.8,31.14h-1.79v-11.39h1.79v4.88h2.03v-4.88h1.83v11.39h-1.83v-4.88h-2.03v4.88Z'/%3e%3cpath%20class='st0'%20d='M105.36,24.55h2.46v1.62h-2.46v3.34h3.09v1.63h-4.88v-11.39h4.88v1.63h-3.09v3.18ZM108.17,17.29l-1.76,1.91h-1.26l1.17-1.91h1.86Z'/%3e%3cpath%20class='st0'%20d='M112.2,19.75c1.78,0,2.67.94,2.67,2.82v1.48c0,1.87-.89,2.81-2.67,2.81h-.85v4.28h-1.79v-11.39h2.64ZM111.35,21.37v3.86h.85c.58,0,.87-.36.87-1.08v-1.71c0-.71-.29-1.07-.87-1.07h-.85Z'/%3e%3c/g%3e%3ccircle%20class='st1'%20cx='25'%20cy='25'%20r='20'/%3e%3cpath%20class='st0'%20d='M32.78,19.27c2.92,0,4.43,2.55,5.28,5.33l.71,2.17c.14.38-.33.75-.71.75h-5.61c.19-.33.24-.71.09-1.08l-.75-2.45c-.43-1.32-.99-2.64-1.79-3.77.75-.57,1.65-.94,2.78-.94h0ZM25,18.38c3.25,0,4.9,2.78,5.89,5.89l.76,2.45c.14.42-.33.8-.8.8h-11.69c-.42,0-.94-.38-.8-.8l.75-2.45c.99-3.11,2.64-5.89,5.89-5.89h0ZM25,11.35c1.74,0,3.11,1.37,3.11,3.11s-1.37,3.11-3.11,3.11-3.11-1.41-3.11-3.11,1.41-3.11,3.11-3.11h0ZM17.27,19.27c1.08,0,1.98.38,2.73.94-.8,1.13-1.37,2.45-1.74,3.77l-.8,2.45c-.14.38-.05.75.09,1.08h-5.56c-.42,0-.9-.38-.75-.75l.71-2.17c.9-2.78,2.41-5.33,5.33-5.33h0ZM17.27,12.91c1.51,0,2.78,1.27,2.78,2.83s-1.27,2.83-2.78,2.83-2.83-1.27-2.83-2.83,1.27-2.83,2.83-2.83h0ZM32.78,12.91c1.56,0,2.78,1.27,2.78,2.83s-1.23,2.83-2.78,2.83-2.83-1.27-2.83-2.83,1.27-2.83,2.83-2.83h0ZM27.07,28.56v.09c0,.57-.24,1.08-.61,1.46h0v.05c-.38.33-.9.57-1.46.57s-1.08-.24-1.46-.61h0c-.38-.38-.61-.9-.61-1.46v-.09h1.41v.09c0,.19.05.38.19.47v.05c.09.09.28.19.47.19s.38-.09.47-.19v-.05c.14-.09.24-.28.24-.47t-.05-.09h1.41ZM30.99,28.56v.09c0,1.65-.66,3.16-1.74,4.24-1.08,1.08-2.59,1.79-4.24,1.79s-3.16-.71-4.24-1.79l-.05-.05c-1.04-1.08-1.7-2.55-1.7-4.2v-.09h1.41v.09c0,1.27.47,2.4,1.27,3.25h.05c.85.85,1.98,1.37,3.25,1.37s2.4-.52,3.25-1.37c.85-.8,1.37-1.98,1.37-3.25v-.09h1.37ZM34.99,28.56v.09c0,2.78-1.13,5.28-2.92,7.07-1.79,1.79-4.29,2.92-7.07,2.92s-5.23-1.13-7.07-2.92c-1.79-1.79-2.92-4.29-2.92-7.07v-.09h1.41v.09c0,2.4.94,4.53,2.5,6.08,1.56,1.56,3.72,2.5,6.08,2.5s4.52-.94,6.08-2.5c1.56-1.56,2.5-3.68,2.5-6.08v-.09h1.41Z'/%3e%3c/svg%3e)