
http://www.iaeme.com/IJMET/index.asp 1275 editor@iaeme.com
International Journal of Mechanical Engineering and Technology (IJMET)
Volume 10, Issue 03, March 2019, pp. 1275–1284, Article ID: IJMET_10_03_130
Available online at http://www.iaeme.com/ijmet/issues.asp?JType=IJMET&VType=10&IType=3
ISSN Print: 0976-6340 and ISSN Online: 0976-6359
© IAEME Publication Scopus Indexed
INFLUENCE OF DIFFERENT CUTTER HELIX
ANGLE AND CUTTING CONDITION ON
SURFACE ROUGHNESS DURING END-
MILLING OF C45 STEEL
Dung Hoang Tien
Hanoi University of Industry, Vietnam
Nhu -Tung Nguyen*
Hanoi University of Industry, Vietnam
Trung Do Duc
Hanoi University of Industry, Vietnam
*Corresponding Author
ABSTRACT
This experimental study investigated the effects of milling conditions on the finished
surface roughness. With four controllable factors-three levels (cutting velocity,
feedrate, radial depth of cut, and cutter helix angle), the nineteen experiments were
performed with performance measurements of surface roughness. By ANOVA analysis,
the effect of cutting conditions on the surface roughness were analyzed and modeled.
The most suitable regression of surface roughness was a quadratic regression with the
confidence level is more than 97%, and this model was successfully verified by
experimental results with very promising results. Besides, by using ANOVA method, the
optimization process of surface roughness was performed. The optimum value of
surface roughness is 0.2259 μm that was obtained at cutting velocity of 143.4904 m/min,
a feedrate of 0.01 mm/flute, at a radial depth of cut of 0.1 mm, and a cutter helix angle
of 45o. The approach method of the present study can be applied in industrial machining
to improve the surface quality in finished face milling the C45 Steel.
Key words: Surface roughness, ANOVA method, C45 Steel.
Cite this Article: Dung Hoang Tien, Nhu -Tung Nguyen and Trung Do Duc,
Influence of Different Cutter Helix Angle and Cutting Condition on Surface
Roughness During End-Milling of C45 Steel, International Journal of Mechanical
Engineering and Technology 10(3), 2019, pp. 1275–1284.
http://www.iaeme.com/IJMET/issues.asp?JType=IJMET&VType=10&IType=3

Influence of Different Cutter Helix Angle and Cutting Condition on Surface Roughness During
End-Milling of C45 Steel
http://www.iaeme.com/IJMET/index.asp 1276 editor@iaeme.com
1. INTRODUCTION
In Industrial manufacturing, milling is one of the most important processes in manufacturing.
In milling processes, optimizing the cutting conditions is very important to predict the surface
quality, geometrical accuracy, etc. Following this research directions, the Taguchi method and
ANOVA analysis have been widely used in industrial engineering analysis. Moreover, the
Taguchi method employs a special design of orthogonal array through reducing the number of
experiments to investigate the effect of the entire machining parameters.
Recently, this method has been widely employed in several industrial fields, and research
work. Lin, Chen, Wang, Lee [1] and Lajis, Mohd Radzi, ANOVA analysis was used to research
the effect of main machining parameters such as machining polarity, peak current, pulse
duration, and so on, on the wire-cut electrical discharge machining (WEDM) characteristics
such as material removal rate, surface roughness [2].
The surface roughness and cutting force are important machining characteristics to
evaluating the productivity of machining processes. In milling processes, by using Taguchi
method and ANOVA analysis, the cutting forces and surface roughness could be investigated
based on a number of factors such as depth of cut, feedrate, cutting speed, cutting time,
workpiece hardness, etc. Several research works had been conducted in different conditions and
had also been applied for different workpieces and tool materials such as Kıvak [3], Ozcelik,
Bayramoglu [4], Turgut, Çinici, and Findik [5], Karakas, Acır, Übeyli, and Ögel [6], and
Jayakumar [7].
However, although there were already many studies on surface roughness, it seems that the
cutter helix angle had not been mentioned. In this study, the influence of cutting conditions and
cutter helix angle on the machining surface roughness was investigated. The minimum value of
surface roughness was determined with the optimization values of cutting conditions and cutter
helix angle.
2. EXPERIMENTAL METHOD
2.1. The experiment setup
2.1.1. Workpiece and tool
The workpiece material was C45 steel. The compositions of C45 are listed in Table 1 and the
The properties of the C45 were the following: hardness 160-220 HB, Young’s modulus = 190-
210 GPa, Poisson’s ratio = 0.27-0.30, tensile strength = 569 MPa. The workpiece dimensions
are 70 mm × 70 mm × 40 mm.
Table 1 Chemical compositions of 45C
Composite (%)
C
Mn
Si
P
S
Fe
Min
0.42
0.6
0.15
-
-
Max
0.48
0.9
0.35
0.030
0.035
Balance
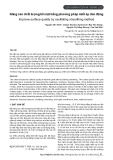
The three tools were chosen as follows. Cutter: Flat-end mill tool with cutter material is
Hard alloy KF440, number of flute Nf = 4, rake angle αr = 50, and the diameter was 8 mm. The
cutter helix angle of three tools: β1 = 150, β1 = 300, β1 = 450. The geometry of three tools are
described in Figure. 1.

Dung Hoang Tien, Nhu -Tung Nguyen and Trung Do Duc
http://www.iaeme.com/IJMET/index.asp 1277 editor@iaeme.com
Figure 1. The three tools with different cutter helix angle
2.1.2. Machine Set-Up and Cutting force measurements
The experiments were performed at a five-axis vertical machining center (DMU 50 - 5 Axis
Milling) as described in Figure. 2. All experiments were peformed under dry machining
condition. The surface roughness (Ra) of the product was measured by MITUTOYO-Surftest
SJ-210 Portable Surface Roughness Tester (Japan) as shown in Figure. 3. The surface roughness
was measured parallel to the machined surface from three different points and repeated three
times following three repeated times of each cutting test. The average values of the
measurements were evaluated.
2.2. Experiment design
In this research, the cutting velocity (Vc), feed rate (ft), radial depth of cut (ar), and cutter helix
angle (β) were selected as control factors and their levels were expressed in the Table 2. The
experimental plan was performed with 19 experiments and detailed as in Table 3. Besides, the
response surface methodology (RSM) technique has been used to design of experiments and
analysis of experimental results. RSM is used to model and analysis the response variables that
are influence by several controllable input variables [8].
Figure 2. DMU 50 - 5 Axis Milling
machine
Figure 3. Setting of surface roughness
measurement

Influence of Different Cutter Helix Angle and Cutting Condition on Surface Roughness During
End-Milling of C45 Steel
http://www.iaeme.com/IJMET/index.asp 1278 editor@iaeme.com
Table 2. Milling parameters and their levels
No.
Machining parameters
Level 1
Level 2
Level 3
1
Cutting velocity [m/min]
60
130
200
2
Feed per flute [mm/flute]
0.01
0.08
0.15
3
Radial depth of cut [mm]
0.1
0.3
0.5
4
Cutter helix angle [Degree]
15
30
45
Table 3. The experimental design and results
Run
Machining parameters
Ra
[µm]
Vc [m/min]
ft
[mm/flute]
ar
[mm]
β
[o]
1
60
0.01
0.1
15
0.623
2
200
0.01
0.1
15
0.553
3
60
0.15
0.1
15
0.878
4
200
0.15
0.1
15
0.795
5
60
0.01
0.5
15
0.566
6
200
0.01
0.5
15
0.559
7
60
0.15
0.5
15
1.220
8
200
0.15
0.5
15
1.045
9
60
0.01
0.1
45
0.322
10
200
0.01
0.1
45
0.21
11
60
0.15
0.1
45
0.48
12
200
0.15
0.1
45
0.461
13
60
0.01
0.5
45
0.623
14
200
0.01
0.5
45
0.571
15
60
0.15
0.5
45
0.895
16
200
0.15
0.5
45
0.781
17
130
0.08
0.3
30
0.624
18
130
0.08
0.3
30
0.647
19
130
0.08
0.3
30
0.618
3. ANALYSIS AND EVALUATION OF EXPERIMENTAL RESULTS
3.1. Analysis of Variance (ANOVA) for surface roughness
The experimental results were investigated and listed in Table 3. In this study, the influence of
the cutting velocity, feed rate, radial depth of cut, and cutter helix angle on the surface roughness
was analyzed by ANOVA. This analysis was performed with 95% confidence level and 5%
significance level. This indicates that the obtained models are considered to be statistically
significant. The coefficient of determination (R2), that coefficient is defined as the ratio of the
explained variation to the total variation and is a measure of the fit degree. When R2 approaches
to unity, it indicates a good correlation between the experimental and the predicted values.
According to Table 4, the contributions of each factor on surface roughness were listed in
the last column. It is clear from the results of ANOVA that the most important factor affecting
on the surface roughness was feedrate (38.766%). The other factors affect differently on the
surface roughness. The second and third factors influencing the surface roughness were radial
depth of cut (22.78%) and cutter helix angle (21.809%). The fourth factor influencing on the
surface roughness was cutting velocity (2.669%).
Table 4. Results of ANOVA for surface roughness

Dung Hoang Tien, Nhu -Tung Nguyen and Trung Do Duc
http://www.iaeme.com/IJMET/index.asp 1279 editor@iaeme.com
Number of obs: 27
R-squared:
0.9881
Root MSE: 0.0209
Adj R-squared:
0.9613
Source
Sum of
squares
Degree of
freedom
Mean
square
F-value
Prob > F
Percent
contribution
[%]
Model
1.0007
11
0.0910
21.52
0.0000
Vc
0.0275
2
0.0138
3.25
0.0100
2.669
ft
0.3994
1
0.3994
94.48
0.0025
38.766
ar
0.2347
1
0.2347
55.53
0.0000
22.780
β
0.2247
1
0.2247
53.15
0.0001
21.809
Vc*ft
0.0014
1
0.0014
0.33
0.0002
0.136
Vc*ar
0.0003
1
0.0003
0.06
0.5822
0.029
Vc* β
0.0001
1
0.0001
0.02
0.8127
0.009
ft*ar
0.0320
1
0.0320
7.58
0.8880
3.106
ft* β
0.0348
1
0.0348
8.23
0.0284
3.378
ar* β
0.0458
1
0.0458
10.83
0.0240
4.445
Error
0.0296
7
0.0042
2.873
Total
1.0303
18
0.0572
100
3.2. Regression and Verification of surface roughness model
In this study, one dependent variable is surface roughness, whereas the independent variables
are the cutting velocity (Vc), feed rate (ft), radial depth of cut (ar), and cutter helix angle (β). The
surface roughness model was modeled by quadratic regression and exponent regression as
expressed in Eq. 1 and Eq. 2.
The exponential regression of surface roughness:
{𝑅𝑎=9.317∗𝑉𝑐−0.119∗𝑓𝑡0.117∗𝑎𝑟
0.252∗𝛽−0.378
𝑅2= 82.49%, 𝑅𝐴𝑗𝑑
2 = 77.49% (1)
The quadratic regression of surface roughness:
{
R𝑎=0.77490−0.00406∗V𝑐+2.87908∗𝑓𝑡−0.14795∗𝑎𝑟−0.00191𝑉𝑐∗f𝑡
−0.00027∗𝑉𝑐∗a𝑟+0.000002∗V𝑐∗β+3.19643∗𝑓𝑡∗𝑎𝑟
−0.04440∗f𝑡∗β+0.000014∗V𝑐2−0.000167∗β2
R2 = 97.13%, RAjd
2 = 92.61% (2)
There is a very good relation between predicted values and test values. The R2 values of the
equations obtained by quadratic regression model for surface roughness was found to be
97.13%. The comparison and verification results of surface roughness model were described in
Figure. 4. As seen from this figure, the predicted results of two models were very close to the
experimental results. However, the predicted results of quadratic model are closer to
experimental results than other one. So, the most suitable regression of surface roughness was
a Quadratic regression as given in Eq. 2. These results showed that the Quadratic regression
model was shown to be successfully investigated of surface roughness in milling processes of
C45 steel.


![Giáo trình Cấu trúc dữ liệu và giải thuật - Trường CĐ Cơ điện Hà Nội [Mới nhất]](https://cdn.tailieu.vn/images/document/thumbnail/2026/20260323/lionelmessi01/135x160/58171774381670.jpg)


![Giáo trình Tiện nâng cao (Nghề Cắt gọt kim loại, Trình độ Cao đẳng) - Trường Cao đẳng Cơ điện Hà Nội [Mới nhất]](https://cdn.tailieu.vn/images/document/thumbnail/2026/20260323/lionelmessi01/135x160/48101774403543.jpg)


