
TNU Journal of Science and Technology
229(06): 104 - 111
http://jst.tnu.edu.vn 104 Email: jst@tnu.edu.vn
INVESTIGATION OF THE FLUORESCENCE QUENCHING DEPENDING ON
EXCITATION WAVELENGTHS OF RHODAMINE B TO QUANTIFY SILVER
NANOPARTICLES VIA THE INNER FILTER EFFECT
Tran Thu Trang *
TNU - University of Sciences
ARTICLE INFO
ABSTRACT
Received:
17/01/2024
Silver nanoparticles (Ag NPs) with a size of around 9 nm were
fabricated and quantified through fluorescence quenching of rhodamine
B (RhB). A series of solutions composed of RhB with various
concentrations of Ag NPs ranging from 0.09 pM to 0.98 pM were
prepared, and optical properties were investigated by absorption and
fluorescence spectroscopies. The fluorescence quenching of RhB was
observed for the mixing solution of RhB and Ag NPs. The fluorescence
measurement condition was optimized by controlling excitation
wavelengths to obtain the highest efficiency of fluorescence quenching.
The examination of the fluorescence quenching depending on excitation
wavelengths indicated that under the excitation wavelength of 400 nm,
the highest efficiency of fluorescence quenching of RhB was achieved.
At this optimized condition, the lowest concentration of Ag NPs that
could be quantified reaches 0.09 pM. It shows a good limitation in the
detection of Ag NPs in comparison with the previous works. The
mechanism of fluorescence quenching of RhB with the presence of Ag
NPs has been revealed as the result of the inner filter effect.
Revised:
25/3//2024
Published:
25/3//2024
KEYWORDS
Silver nanoparticles
Rhodamine B
Fluorescence quenching
Inner filter effect (IFE)
Quantification of silver
nanoparticles
NGHIÊN CỨU SỰ DẬP TẮT HUỲNH QUANG CỦA RHODAMINE B
PHỤ THUỘC VÀO BƯỚC SÓNG KÍCH THÍCH ĐỂ ĐỊNH LƯỢNG
HẠT NANO BẠC THÔNG QUA HIỆU ỨNG NỘI DẬP TẮT
Trần Thu Trang
Trường Đại học Khoa học - ĐH Thái Nguyên
THÔNG TIN BÀI BÁO
TÓM TẮT
Ngày nhận bài:
17/01/2024
Hạt nano bạc (Ag NPs) kích thước khoảng 9 nm đã được tổng hợp và
nghiên cứu định lượng thông qua sự dập tắt huỳnh quang của phân tử
màu rhodamine B (RhB). Một hệ các dung dịch bao gồm RhB và Ag
NPs với nồng độ Ag NPs thay đổi từ 0,09 pM đến 0,98 pM đã được
chuẩn bị và nghiên cứu tính chất quang bằng phổ hấp thụ và phổ huỳnh
quang. Sự dập tắt huỳnh quang của RhB đã quan sát được trong các hệ
dụng dịch Ag NPs và RhB. Điều kiện đo phổ huỳnh quang đã được tối
ưu để thu được hiệu suất dập tắt huỳnh quang cao nhất. Qua khảo sát sự
dập tắt huỳnh quang phụ thuộc vào các bước sóng kích thích khác nhau
đã cho thấy hiệu suất dập tắt huỳnh quang xảy ra cao nhất khi kích thích
ở bước sóng 400 nm. Ở điều kiện kích thích 400 nm, nồng độ Ag NPs
thấp nhất để có thể phát hiện được đạt tới 0,09 pM. Đây là giới hạn phát
hiện Ag NPs tốt so với các công bố trước. Cơ chế của sự dập tắt huỳnh
quang được chỉ ra là do hiện tượng nội dập tắt (Inner filter effect).
Ngày hoàn thiện:
25/3//2024
Ngày đăng:
25/3//2024
TỪ KHÓA
Hạt nano bạc
Rhodamine B
Dập tắt huỳnh quang
Hiệu ứng inner filter effect
Định lượng nano bạc
DOI: https://doi.org/10.34238/tnu-jst.9606
Email: trangtt@tnus.edu.vn

TNU Journal of Science and Technology
229(06): 104 - 111
http://jst.tnu.edu.vn 105 Email: jst@tnu.edu.vn
1. Introduction
Fluorescence quenching is one of the most common techniques that has been used in chemical
sensing and biosensing [1], [2]. At first, fluorescence quenching due to the inner filter effect was
considered an error. The primary inner filter effect describes a quenching of fluorescence due to
the attenuation of the excitation beam, and the secondary inner filter effect presents the
reabsorption of the emitted radiation by absorbers [3], [4]. The significant changes in
fluorescence intensity correlated to the different concentrations of analyte can be exploited as a
sensor. Moreover, the slight changes in concentration of the absorber are inferred into
exponential changes in the fluorescence signal, making the advantage of fluorescence in
detecting low concentrations of analytes.
Silver nanoparticles (Ag NPs) possess a high extinction coefficient in the order of 108 cm-1M-1
or even more, which is much larger than conventional absorbers [5]. Additionally, the surface
plasmon absorption of Ag NPs can be easily turned by controlling their size, shape, or
environment [6], [7]. Analytical methods for quantification of silver nanoparticles, in particular,
and metal nanoparticles, in general, are still inadequately studied. Pacioni et al. reported
quantifying silver and gold nanoparticles using rhodamine 6G [8]. Rhodamin 6G and 4-
hydroxycoumarin were also used to study fluorescence quenching with the presence of silver
nanoparticles [9]. These previous works concluded that Froster energy transfer played an
essential role in the quenching mechanism. Fluorescence sensing based on the inner filter effect
(EFE) has currently been explored as a simple approach for detection in various analytics.
Cayuela et al. have detected silver nanoparticles in cosmetics by fluorescence quenching of
cacbon dots through the IFE mechanism [10].
In this report, Ag NPs were synthesized and quantified through the fluorescence quenching of
the fluorophore - Rhodamine B (labeled as RhB). Upon examination of various excitation
wavelengths, the Ag NPs and RhB system revealed that the most efficient fluorescence
quenching was under excitation wavelength at 400 nm. The lowest concentration of Ag NPs in
which the photosystems of Ag NPs and RhB are still detected reaches 0.09 pM. It was deduced
that the inner filter effect acted as the crucial mechanism of fluorescence quenching of RhB with
the presence of RhB. The study indicated a good of limited detection of Ag NPs through
fluorescence quenching of RhB.
2. Materials and methods
2.1. Materials
Silver nitrate (AgNO3, 99.92%) was used as silver precursor; sodium borohydride (NaBH4,
99.9%) acted as both reducing and capping agents. Trisodium citrate dihydrate (TSC, 99%) was
also used as a reducing chemical; sodium hydroxide (NaOH, 99%), rhodamine B (RhB, Aldrich).
All experiments used deionized water from a Millipore purification system for solution
preparation.
2.2. Chemical synthesis of silver nanoparticles
Silver nanoparticles were synthesized by the reduction process of AgNO3 by NaBH4. The
formation of silver nanoparticles started with a simple aqueous phase mixing of AgNO3 with
TCS and NaBH4 [11], [12]. Briefly, a mixture of 2 ml AgNO3 (0.02 M), 400 µl TSC (0.6 M), and
200 ml deionized water was magnetically stirred at room temperature for 15 minutes. Next, 800
µl of NaBH4 was added dropwise to the mixture. Finally, 200 µl of NaOH (1M) was added to the
solution. Following that, the whole mixture was magnetically stirred for 15 minutes. The solution
changed the color to yellow-brown, indicating the formation of Ag NPs.
TNU Journal of Science and Technology
229(06): 104 - 111
http://jst.tnu.edu.vn 106 Email: jst@tnu.edu.vn
2.3. Instrumentation
Absorption spectra were carried out using a UV-Vis spectrometer (Jasco V-770, Japan). The
fluorescence spectra were implemented in fluorescence spectroscopy (model FLS 1000,
Scotland). The excitation wavelengths were chosen at 349, 370, 400, 430, 480, 510, and 530 nm.
The measurements for each solution were kept under the same conditions for each excitation
wavelength.
The morphology of Ag NPs was examined using a transmission electron microscope (TEM)
and high-resolution transmission electron microscopy (HRTEM). The crystal structure was
investigated by X-ray powder diffraction (XRD) using monochromatic Cu-Kα radiation on a
Bruker D8 Advances diffractometer (Germany).
3. Results and discussion
3.1. Morphology and crystal structure of silver nanoparticles
Firstly, the morphology and size of as-synthesized silver nanoparticles (Ag NPs) were
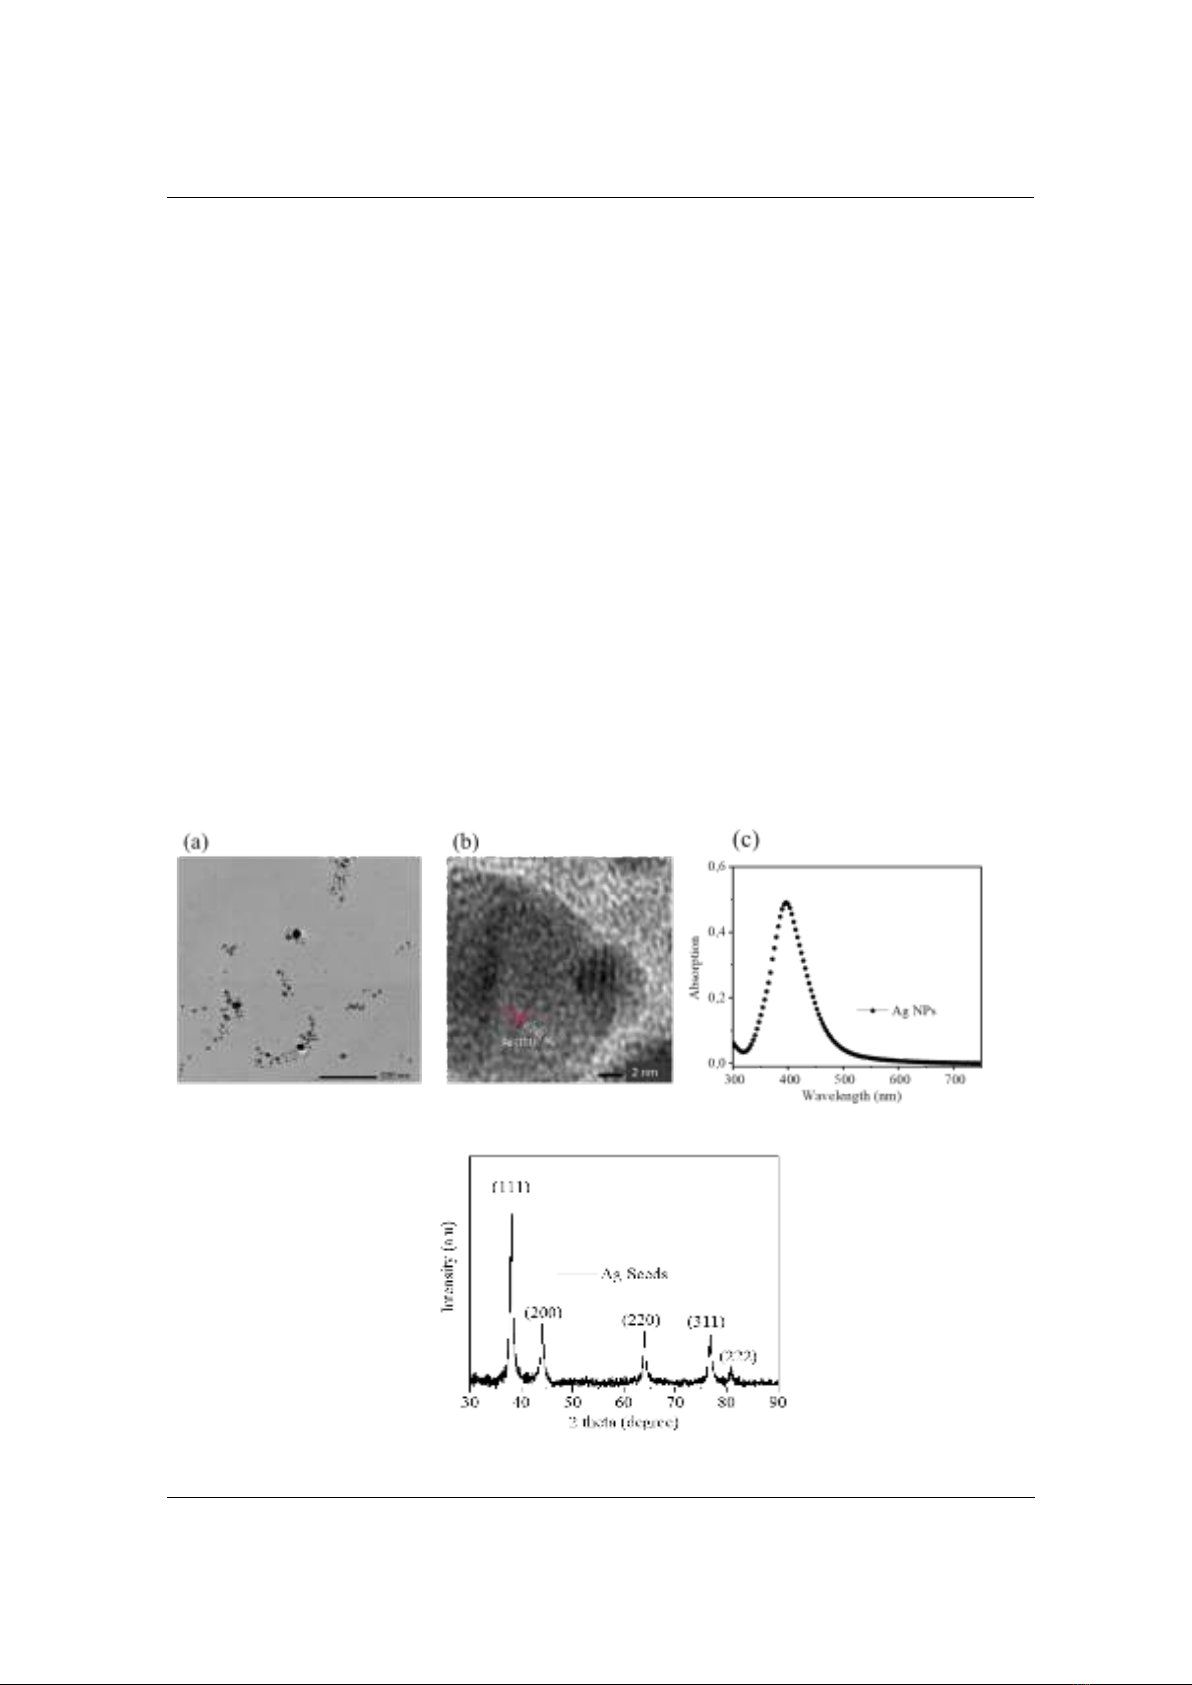
examined by using TEM and HRTEM, as indicated in Figure 1. Figure 1a presents that Ag NPs
are mostly spherical. The distance between adjacent lattice fringers of Ag was determined using
HRTEM and indicated approximately 0.234 nm (Figure 1b). This result is consistent with the
(111) plane of silver, and the continuous fringe pattern obtained in the HRTEM image evidences
the single crystalline nature of silver NPs [13], [14]. Furthermore, the absorption spectrum of
silver NPs (Figure 1c) shows the characteristic band at 399 nm. The morphology of Ag NPs was
again strengthened with the characteristic of absorption band at 399 nm. This absorption band
stems from the localized surface plasmon band of spherical silver NPS with an average diameter
range of about 10 nm [13], [15], [16].
Figure 1. (a) TEM and (b) HRTEM images of Ag NPs; (c) absorption spectrum of silver NPs
Figure 2. XRD pattern of silver nanoparticles
TNU Journal of Science and Technology
229(06): 104 - 111
http://jst.tnu.edu.vn 107 Email: jst@tnu.edu.vn
In order to reinforce the structure of silver NPs, XRD measurement was implemented. As
presented in Figure 2, all the peaks which are observed at 2θ = 37.90, 440, 63.30, and 76.70 are
identified as the characteristic diffraction peaks of the face-centered cubic structure of silver
(JCPDS card no. 04-0783) [17]. Therefore, the results describe the high purity and crystallization
of silver NPs.
3.2. Rhodamine B as a fluorescence sensor for silver NPs detection
3.2.1. Absorption spectra study
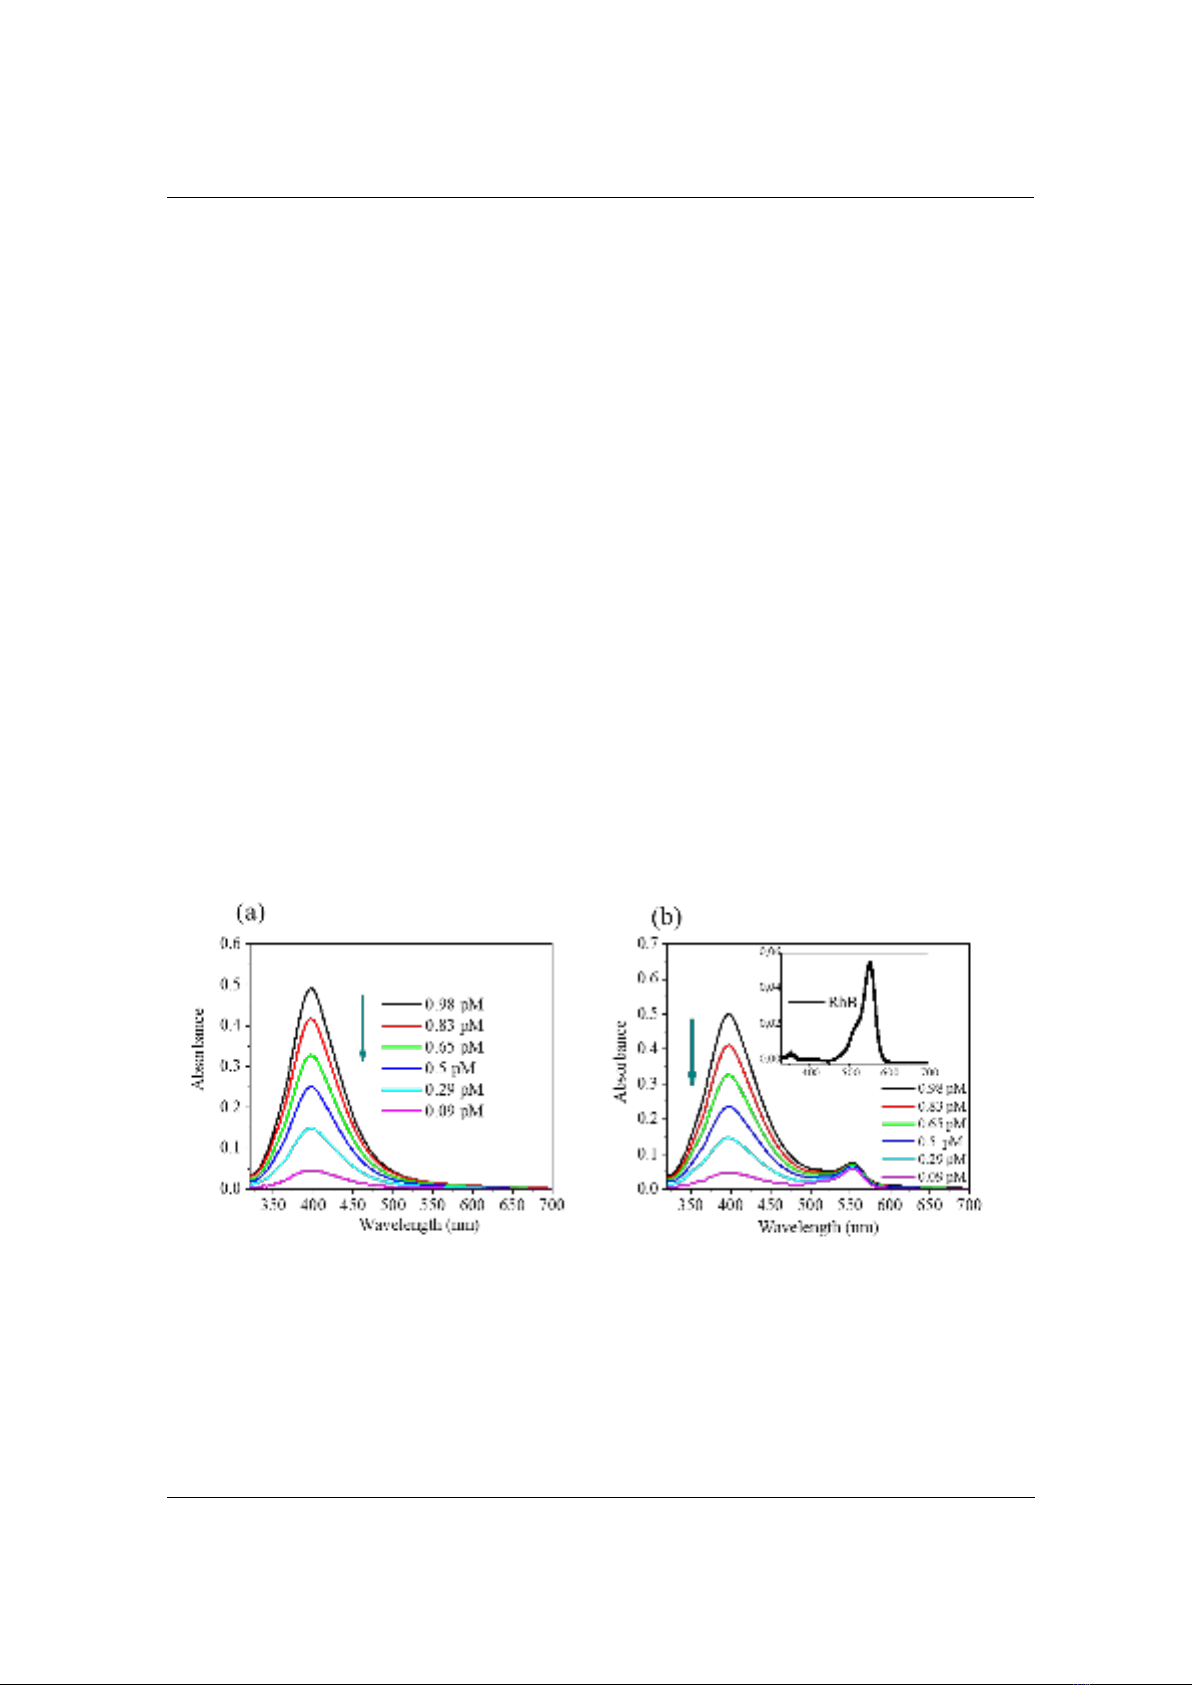
In order to investigate the ability to detect Ag NPs by RhB, firstly, a series of samples
composed of Ag NPs and RhB in aqueous solution were prepared with the concentration of Ag
NPs varying from 0.09 pM to 0.98 pM. Because Ag NPs solution is completely dispersed and
homogeneous, the concentration of Ag NPs was approximately estimated using Beer-Lambert
law: A = ×L×C; in which is molar extinction coefficient (mol-1.cm-1); L path length (cm), in
this case, is the width of cuvet (1 cm); and C is concentration (mol); and A is optical density
obtained from absorption spectra of Ag NPs (Figure 3a). In this work, the extinction coefficient
of Ag NPs is about 5.5 × 10⁸ (mol-1.cm-1) [16]. For an instant to calculate the concentration of Ag
NPs corresponds to A = 0.5; C = A/(×L) = 0.5/(5.5 × 108 ×1)= 0.98 ×10⁻⁹ M = 0.98 pM. Figure 3
describes the absorption spectra of Ag NPs and Ag NPs with a fixed concentration of RhB at 0.5
µM. The inset figure is the absorption spectrum of RhB (0.5 µM) in water with a center band at
553 nm. The concentration of RhB was chosen at 0.5 µM with the purpose of keeping its optical
density lower than 0.1, which is the value providing reliable fluorescent signals [3]. In addition to
that, the lower concentration of fluorophore corresponds to the higher sensitivity with the
presence of an absorber. In Figure 3, it is clear that the absorption spectra of the mixing solution
of Ag NPs and RhB describe the overall characteristics of the two components of the absorption
spectra of Ag NPs (centered at 399 nm) and RhB (centered at 553 nm). Thus, it could be deduced
that there was no interaction between Ag NPs and RhB to form other states.
Figure 3. Absorption spectra of various concentrations of (a) silver NPs and (b) silver NPs
with the presence of RhB (0.5 µM). Inset figure: Absorption spectrum of RhB (0.5 µM)
3.2.2. Study RhB as a fluorescent sensor for Ag NPs detection
In this work, Ag NPs were selected as an analyte to probe using RhB and acted as a
fluorophore. A series of samples of mixing solutions of Ag NPs and RhB with varying Ag NPs
concentrations were investigated for fluorescence properties compared with RhB under different
excitation wavelengths. To examine the optimization of the detection of Ag NPs, the excitation
wavelengths were carried out at eight distinct wavelengths ranging from 300 nm to 530 nm. More
TNU Journal of Science and Technology
229(06): 104 - 111
http://jst.tnu.edu.vn 108 Email: jst@tnu.edu.vn
specifically, wavelength excitations at 300 nm, 349 nm, 370 nm, 400 nm, 430 nm, 480 nm, 510
nm, and 530 nm were used to excite the mixing solutions of RhB and Ag NPs, with the
concentration of Ag NPs varying from 0 pM to 0.98 pM. All the solutions were kept under
identical conditions for fluorescence measurements under each excitation wavelength.
Interestingly, the fluorescence behavior's dependence on the excitation wavelength was
apparently observed. For better visualization, the dependence of the fluorescent intensity of RhB
+ Ag NPs solutions under three distinct excitation wavelengths at 300 nm, 400 nm, and 530 nm is
plotted and presented in Figure 4.
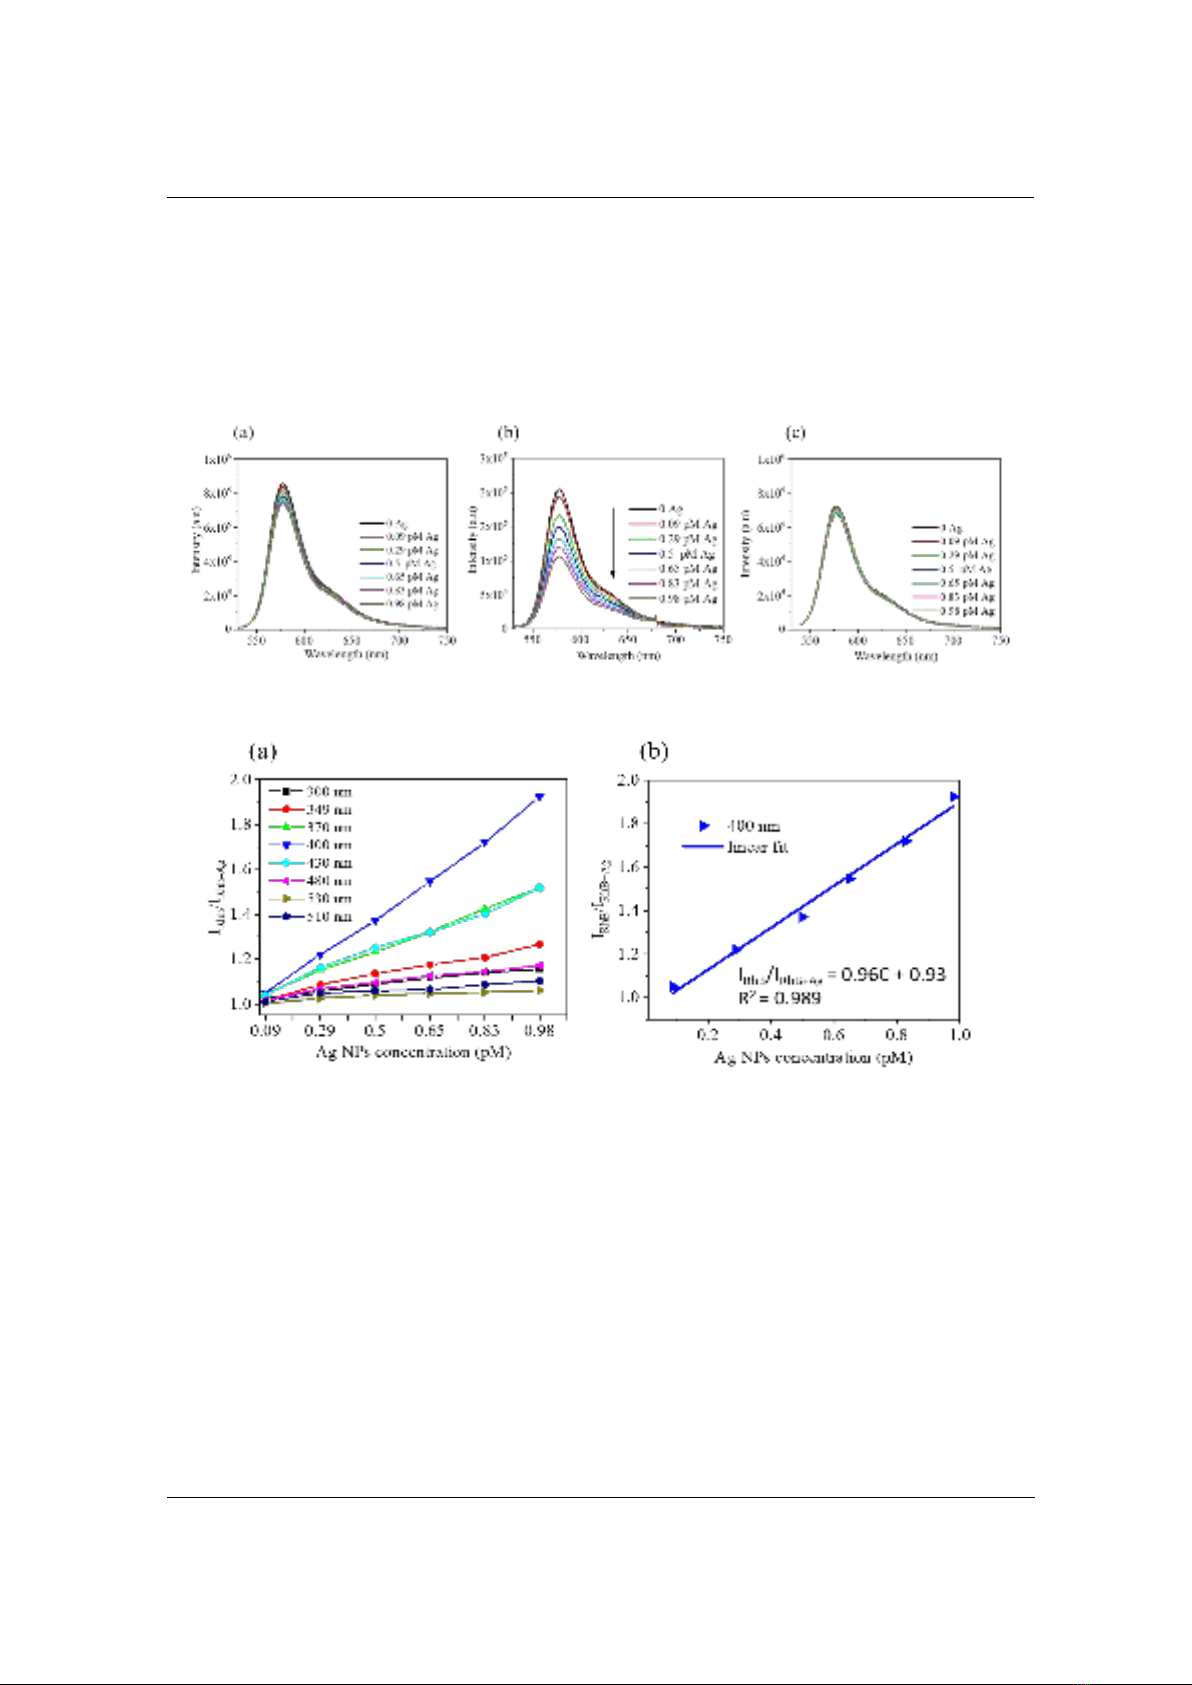
Figure 4. Fluorescence intensity of RhB (0.5 µM) with the different concentrations of Ag NPs
under excitation wavelengths at (a) 300 nm, (b) 400 nm, and (c) 530 nm
Figure 5. (a) Calibration curves of fluorescence quenching of RhB versus the varying concentration
of Ag NPs under eight different excitation wavelengths; (b) the linear fitted curve of the quenching
under excitation wavelength at 400 nm
It can be seen that the fluorescent intensity of mixing solutions of RhB + Ag NPs depends not
only on the excitation wavelength but also on the concentration of Ag NPs. Figure 4 shows that
the fluorescence of the mixing solutions between RhB and Ag NPs was significantly quenched
under the excitation wavelength at 400 nm and was much more efficient than in the case of the
excitation wavelengths at 300 nm and 530 nm. Under using excitation wavelength at 400 nm, the
lowest concentration of Ag NPs could be reached of 0.09 pM, at which the fluorescent intensity
of RhB + Ag NPs can still clearly distinguish from that of RhB. To confirm the optimized
experimental conditions, the calibration curves under distinct excitation wavelengths (at 300 nm,
349 nm, 370 nm, 400 nm, 430 nm, 480 nm, 510 nm, and 530 nm) were plotted in Figure 5a.
Upon addition of various concentrations of Ag NPs (from 0 pM ÷ 0.98 pM) into RhB solution,
the fluorescent intensity of RhB decreases gradually with the increasing concentration of Ag NPs.
Figure 5b indicates a good linear relationship between IRhB/IRhB+Ag and the concentration of Ag

![Công Thức Vật Lý Đại Cương: Nắm Vững Kiến Thức Cơ Bản [Chuẩn Nhất]](https://cdn.tailieu.vn/images/document/thumbnail/2025/20250702/kexauxi10/135x160/74531767988159.jpg)