
Open Access
Available online http://ccforum.com/content/11/5/R100
Page 1 of 9
(page number not for citation purposes)
Vol 11 No 5
Research
Goal-directed fluid management based on pulse pressure
variation monitoring during high-risk surgery: a pilot randomized
controlled trial
Marcel R Lopes1, Marcos A Oliveira1, Vanessa Oliveira S Pereira1, Ivaneide Paula B Lemos1,
Jose Otavio C Auler Jr2 and Frédéric Michard3
1Department of Anesthesia and Critical Care, Santa Casa de Misericórdia de Passos, 164 rua Santa Casa, 37900-020, Passos, MG, Brazil
2Department of Anesthesia and Critical Care, INCOR-University of São Paulo, 44 Dr. Enéas de Carvalho Aguiar Avenida, 05403-000, São Paulo, SP,
Brazil
3Department of Anesthesia and Critical Care, Béclère Hospital – University Paris XI, 157 rue de la Porte de Trivaux, 92141, Clamart, France
Corresponding author: Frédéric Michard, michard.frederic@free.fr
Received: 30 Apr 2007 Accepted: 7 Sep 2007 Published: 7 Sep 2007
Critical Care 2007, 11:R100 (doi:10.1186/cc6117)
This article is online at: http://ccforum.com/content/11/5/R100
© 2007 Lopes et al.; licensee BioMed Central Ltd.
This is an open access article distributed under the terms of the Creative Commons Attribution License (http://creativecommons.org/licenses/by/2.0),
which permits unrestricted use, distribution, and reproduction in any medium, provided the original work is properly cited.
Abstract
Introduction Several studies have shown that maximizing stroke
volume (or increasing it until a plateau is reached) by volume
loading during high-risk surgery may improve post-operative
outcome. This goal could be achieved simply by minimizing the
variation in arterial pulse pressure (ΔPP) induced by mechanical
ventilation. We tested this hypothesis in a prospective,
randomized, single-centre study. The primary endpoint was the
length of postoperative stay in hospital.
Methods Thirty-three patients undergoing high-risk surgery
were randomized either to a control group (group C, n = 16) or
to an intervention group (group I, n = 17). In group I, ΔPP was
continuously monitored during surgery by a multiparameter
bedside monitor and minimized to 10% or less by volume
loading.
Results Both groups were comparable in terms of demographic
data, American Society of Anesthesiology score, type, and
duration of surgery. During surgery, group I received more fluid
than group C (4,618 ± 1,557 versus 1,694 ± 705 ml (mean
±SD), P < 0.0001), and ΔPP decreased from 22 ± 75 to
9±1% (P < 0.05) in group I. The median duration of
postoperative stay in hospital (7 versus 17 days, P < 0.01) was
lower in group I than in group C. The number of postoperative
complications per patient (1.4 ± 2.1 versus 3.9 ± 2.8, P < 0.05),
as well as the median duration of mechanical ventilation
(1 versus 5 days, P< 0.05) and stay in the intensive care unit
(3 versus 9 days, P< 0.01) was also lower in group I.
Conclusion Monitoring and minimizing ΔPP by volume loading
during high-risk surgery improves postoperative outcome and
decreases the length of stay in hospital.
Trial registration NCT00479011
Introduction
Several reports [1-4] have shown that monitoring and maximiz-
ing stroke volume by volume loading during high-risk surgery
decreases the incidence of postoperative complications and
the length of stay in the intensive care unit (ICU) and in the
hospital. Unfortunately, this strategy has so far required the
measurement of stroke volume by a cardiac output monitor as
well as a specific training period for the operators [5].
By increasing pleural pressure, mechanical inspiration induces
cyclic variations in cardiac preload that may be turned into
cyclic changes in left ventricular stroke volume and arterial
pulse pressure (the difference between systolic and diastolic
pressure) [6]. The variation in arterial pulse pressure (ΔPP)
induced by mechanical ventilation is known to be a very accu-
rate predictor of fluid responsiveness; that is, of the position
on the preload/stroke volume relationship (the Frank-Starling
ASA = American Society of Anesthesiology; ΔPP = variation in arterial pulse pressure; HES = hydroxyethylstarch; ICU = intensive care unit.

Critical Care Vol 11 No 5 Lopes et al.
Page 2 of 9
(page number not for citation purposes)
curve) [7-11]. In brief, in patients operating on the flat portion
of the Frank-Starling curve (and hence insensitive to cyclic
changes in preload induced by mechanical ventilation), ΔPP is
low, and volume loading does not result in a significant
increase in stroke volume [6]. Conversely, in patients operat-
ing on the steep portion of the preload/stroke volume relation-
ship (and hence sensitive to cyclic changes in preload induced
by mechanical ventilation), ΔPP is high, and volume loading
leads to a significant increase in stroke volume [6]. By increas-
ing cardiac preload, volume loading induces a rightward shift
on the preload/stroke volume relationship and hence a
decrease in ΔPP. Patients who have reached the plateau of
the Frank-Starling relationship can be identified as patients in
whom ΔPP is low [6,12]. The clinical and intraoperative goal
of 'maximizing stroke volume by volume loading' can therefore
be achieved simply by minimizing ΔPP [12].
We performed the present study to investigate whether moni-
toring and minimizing ΔPP by volume loading during high-risk
surgery may improve postoperative outcome.
Materials and methods
Patients
After approval by the ethical committee of Santa Casa de Mis-
ericórdia de Passos (Passos, MG, Brazil) and written informed
consent, 33 patients undergoing high-risk surgery were
enrolled between 22 September 2005 and 23 January 2006
and randomized to either a control group (group C) or an inter-
vention group (group I). Patients were selected according to a
preoperative decision (by the surgeon and the intensivist) that
postoperative care would be undertaken in the ICU because
of co-morbidities or/and the surgical procedure. Patients less
than 18 years old, with cardiac arrhythmias, with a body mass
index of more than 40, or undergoing surgery with an open
thorax, neurosurgery or emergency surgery, were excluded.
Intraoperative monitoring
Heart rate, arterial pressure (radial arterial line, 20 gauge),
pulse oximetry, and capnography (Capnostat Mainstream CO2
sensor, Respironics Inc., Murrysville, PA, USA) were moni-
tored in all patients during the surgical procedure with the use
of a multiparameter bedside monitor (DX 2020; Dixtal, São
Paulo, SP, Brazil). In patients in group I, the arterial pressure
curve was recorded via a specific module (IBPplus; Dixtal),
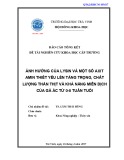
allowing the automatic calculation of ΔPP by the monitor as
follows (Figure 1). Each respiratory cycle is identified from the
capnogram, systolic and diastolic arterial pressures are meas-
ured on a beat-to-beat basis, and pulse pressure is calculated
as the difference between systolic and diastolic pressure.
Maximum and minimum values for pulse pressure (PPmax and
PPmin, respectively) are determined over each respiratory
cycle, and ΔPP is calculated as a percentage as described
Figure 1
Automatic calculation of variation in arterial pulse pressure (ΔPP) from the recordings of arterial pressure and capnographic signals on a regular bed-side monitorAutomatic calculation of variation in arterial pulse pressure (ΔPP) from the recordings of arterial pressure and capnographic signals on a regular bed-
side monitor.

Available online http://ccforum.com/content/11/5/R100
Page 3 of 9
(page number not for citation purposes)
originally [13]:
ΔPP = 100 × (PPmax - PPmin)/[(PPmax + PPmin)/2]
The mean value of ΔPP is automatically calculated over three
consecutive floating periods of eight respiratory cycles, and
the median value of this triple determination is displayed on the
bedside monitor and updated after each new respiratory cycle
(Figure 1).
Protocol
Randomization was performed preoperatively by using sealed
envelopes. During the surgical procedure, patients were man-
aged in accordance with our institution's standard of care.
Group C received fluid intraoperatively at the discretion of the
anesthetist, whereas group I received additional hydroxyethyl-
starch 6% (HES) boluses to minimize and maintain ΔPP ≤
10%. This ΔPP cutoff value was chosen according to previous
reports showing that when ΔPP ≤ 10%, an increase in stroke
volume of 10% or more as a result of volume loading is very
unlikely [7-11,13]. During the postoperative period, both
groups were managed by intensivists (in the ICU), and clini-
cians (in the wards) not involved in the intraoperative manage-
ment or in data collection. These individuals were not informed
of patient allocation.
Data collection
Over the study period all data were collected prospectively
and patients were followed up until hospital discharge. Preop-
erative and intraoperative data collection was undertaken by
one of the investigators (VOSP), whereas postoperative data
collection was undertaken by another (IPBL), who was not
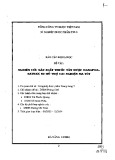
aware of the allocation group. Figure 2 shows the trial profile.
Before surgery, the sex, age, weight, height, history of renal
failure requiring dialysis or not, cirrhosis, chronic obstructive
pulmonary disease, hypertension, peripheral vascular disease,
coronary artery disease, other cardiac disease, diabetes melli-
tus, and cerebrovascular disease were recorded. The body
mass index was calculated according to the standard formula
(BMI = weight/height2). Serum creatinine concentration, pro-
thrombin time, hemoglobin concentration, and platelet con-
centration were obtained from routine preoperative biological
tests. During the surgical procedure, tidal volume, ventilatory
frequency, infused volume of crystalloid solutions, HES, and
blood products were recorded. Heart rate, mean arterial pres-
sure, percutaneous arterial oxygen saturation, and hemoglobin
concentration were collected both at the beginning and at the
end of the surgical procedure. The duration of surgery was
also recorded. After the surgical procedure, the following
parameters were collected both at admission to the ICU and
24 hours later: mean arterial pressure, heart rate, percutane-
ous arterial oxygen saturation. During the 24 hours after
admission to the ICU, venous lactate concentrations were
measured every 6 hours and the mean lactate value was cal-
culated over the first 24-hour period in the ICU. The need for
continuous vasoactive (dopamine or/and norepinephrine
(noradrenaline)) support was also recorded.
Postoperative ICU infections (pneumonia, abdominal, urinary
tract, line-related sepsis and wound infections), respiratory
complications (pulmonary embolism, acute lung injury, and
respiratory support for more than 24 hours exclusive of acute
lung injury), cardiovascular complications (arrhythmia, hypo-
tension, acute pulmonary edema, acute myocardial infarction,
stroke, and cardiac arrest exclusive of fatal outcome), abdom-
inal complications (Clostridium difficile diarrhea, acute bowel
obstruction, upper gastrointestinal bleed, and anastomotic
leak), hematologic complications (platelet count less than
100,000/μl or prothrombin time less than 50%), and renal
complications (urine output less than 500 ml/day or serum
creatinine more than 170 μmol/l or dialysis for acute renal fail-
ure) were collected in accordance with criteria used previously
by other investigators [3,14,15].
Statistical analysis
Data were analysed by comparing patients in group C with
those in group I on an intention-to-treat basis. The primary out-
come measure was the duration of postoperative stay in hos-
pital. On the basis of our own hospital registry, the mean
duration of postoperative stay in hospital in group C was a pri-
ori estimated at 16 ± 8 days (mean ± SD). In accordance with
previous publications [1,2], we postulated that the mean dura-
tion of postoperative stay in hospital in group I could be 35%
lower. A sample size of 33 patients in each group was calcu-
lated for a 0.05 difference (two-sided) with a power of 80%
[16]. An intermediate analysis after the enrolment of the first
33 patients was planned, to readjust the population sample
size if necessary. Secondary outcome measures were the
number of postoperative complications per patient, as well as
the duration of mechanical ventilation and stay in the ICU.
Figure 2
Trial profileTrial profile.

Critical Care Vol 11 No 5 Lopes et al.
Page 4 of 9
(page number not for citation purposes)
Results are expressed as mean ± SD, or as median [interquar-
tile ranges] for the duration of mechanical ventilation, stay in
the ICU, and stay in hospital. Comparisons between groups C
and I were performed with a non-parametric Mann-Whitney U
test (quantitative data) or a χ2 test (qualitative data). In group
I, the effect of HES administration on ΔPP during surgery was
assessed with a non-parametric Wilcoxon rank-sum test. Lin-
ear correlations were tested by using the Spearman rank
method. A P value less than 0.05 was considered statistically
significant.
Results
Over the 4-month (22 September 2005 to 23 January 2006)
enrolment study period, 237 patients were admitted to our
medico-surgical ICU, 57 of these after a surgical procedure.
Among these 57 postoperative patients, 33 patients fulfilled
the inclusion criteria and agreed to participate in the study. Six-
teen patients were randomly assigned to group C and 17 to
group I (Figure 2). Thestudy was stopped after the intermedi-
ate analysis (33 patients enrolled) because we observed a sig-
nificant decrease in the length of stay in hospital (primary
endpoint) in group I.
Before surgery
Before surgery, the groups were comparable in terms of sex
ratio, age, weight, height, body mass index, American Society
of Anesthesiology (ASA) score, type of surgery, and preoper-
ative biological tests (Table 1). They were also comparable in
terms of co-morbidities, except in regard to peripheral vascular
disease, where the observed incidence was significantly
higher (P = 0.04) in group I.
During surgery
The duration of the surgical procedure, as well as respiratory
settings (tidal volume and ventilatory frequency) were compa-
rable in both groups (Table 2). During the surgical procedure,
the amount of HES and the total amount of fluid (including
crystalloid, HES, and blood products) was significantly greater
in group I than in group C (Table 2). None of the patients
received continuous vasoactive support during surgery. In
group I (ΔPP was not measured in group C), ΔPP decreased
significantly from 22 ± 7% to 9 ± 1% (mean ± SD; P <
0.0001) over the time frame of the surgical procedure, and
was 10% or less at the end of the surgical procedure in all
except four patients (range 7 to 11).
After surgery
On admission to the ICU, the mean arterial pressure was sig-
nificantly greater in group I (Table 3); 24 hours after admission
to the ICU, fewer patients required vasoactive support in
group I, and blood lactate was lower in this group (Table 3).
Postoperative complications are listed in Table 4. The number
of patients with postoperative complications is shown in Fig-
ure 3. Fewer patients developed complications in group I (7
patients (41%) versus 12 patients (75%), P = 0.049). The
number of complications per patient was lower in group I than
in group C (1.4 ± 2.1 per patient versus 3.9 ± 2.8 per patient,
P = 0.015). The median [interquartile range] duration of
mechanical ventilation (1 [1 to 2] versus 5 [1 to 12] days, P <
0.05), stay in the ICU (3 [2 to 4] versus 9 [4.5 to 15.5] days,
P < 0.01), and stay in hospital (7 [6 to 8.25] versus 17 [8 to
20] days, P < 0.01) was significantly lower in group I than in
group C (Figure 4). Over the study period (until hospital
Table 1
Patients' characteristics before surgery
Characteristic Group
C (n = 16) I (n = 17)
Sex, M/F 12/4 11/6
Age (years) 62 ± 10 63 ± 16
Weight (kg) 68 ± 16 66 ± 16
Height (cm) 170 ± 8 164 ± 9
Body mass index (kg/
m2)
23 ± 4 24 ± 5
ASA II score 3 3
ASA III score 9 8
ASA IV score 4 6
Chronic disease
Renal failure
requiring dialysis
10
Renal failure
without dialysisa56
Cirrhosis 0 1
Chronic obstructive
pulmonary disease
68
Hypertension 13 13
Peripheral vascular
disease
39
b
Coronary artery
disease
13
Other cardiopathy 5 8
Diabetes mellitus 5 7
Cerebrovascular
disease
13
Preoperative biological
tests
Serum creatinine
(μmol/l)
124 ± 90 132 ± 55
Prothrombin time
(percentage)
87 ± 13 80 ± 19
Hemoglobin (g/dl) 11.3 ± 2.0 11.9 ± 2.5
Platelets (/μl) 305,000 ± 108,000 301,000 ± 110,000
ASA, American Society of Anesthesiology physical status; C, control;
I, intervention. aSerum creatinine more than 130 μmol/l; bP < 0.05,
control group versus intervention group.

Available online http://ccforum.com/content/11/5/R100
Page 5 of 9
(page number not for citation purposes)
discharge), five patients died (on days 7, 11, 18, 19, and 26)
in group C, whereas two patients died (on days 7 and 22) in
group I (P = 0.171). In group C, the cause of death was septic
shock and ARDS in four cases (pneumonia n = 1, abdominal
sepsis n = 2, pneumonia and urosepsis n = 1), and acute pul-
monary edema in one case. In group I, the cause of death was
unexplained cardiac arrest in one case, and acute respiratory
failure in one case (tracheostomy complication). Because
death does influence the duration of mechanical ventilation,
the duration of stay in the ICU, and the duration of stay in hos-
pital, we also compared these parameters when considering
only survivors (n = 26). The median [interquartile range] dura-
tion of mechanical ventilation, stay in the ICU, and stay in hos-
pital was 1 [1 to 2] versus 2 [0.25 to 5.5] days (P = 0.29), 3
[2.25 to 4] versus 6 [3.25 to 11.75] days (P = 0.014), and 7
[6 to 8] versus 16 [7.5 to 20.25] days (P = 0.024) in survivors
of group I (n = 15) and group C (n = 11), respectively.
Discussion
Our study shows that monitoring and minimizing ΔPP by fluid
loading during high-risk surgery decreases the incidence of
postoperative complications and also the duration of mechan-
ical ventilation, stay in the ICU, and stay in hospital.
Hypovolemia can pass undetected before, during, and after
major surgery. Aside from the inevitable losses in the intraop-
erative period mainly due to bleeding, most patients are still
starved for a minimum of 6 hours preoperatively to reduce the
risk of acid aspiration syndrome. Additionally, patients under-
Table 2
Type of surgery, physiologic status, and fluid administered
during the surgical procedure
Parameter Group
C (n = 16) I (n = 17)
Type of surgery
Upper gastrointestinal 4 4
Hepato-biliary 2 3
Lower gastrointestinal 8 10
Urology 1 0
Other 1 0
Respiratory settings
Tidal volume (ml/kg) 9.1 ± 0.5 8.6 ± 0.6
Ventilatory frequency (/min) 13 ± 1 13 ± 1
Physiologic status at start of
surgery
Heart rate (/min) 66 ± 9 77 ± 17
Mean arterial pressure (mmHg) 96 ± 16 90 ± 18
SpO2(percentage) 97 ± 3 97 ± 3
ΔPP (percentage) 22 ± 7
Hemoglobin (g/dl) 11.3 ± 2.0 11.9 ± 2.5
Physiologic status at end of
surgery
Heart rate (/min) 86 ± 19 80 ± 17
Mean arterial pressure (mmHg) 68 ± 20 78 ± 14
SpO2 (percentage) 97 ± 3 97 ± 3
ΔPP (percentage) 9 ± 1a
Hemoglobin (g/dl) 9.8 ± 1.4 9.6 ± 1.6
Fluid administered
Volume of crystalloid infused
(ml)
1,563 ± 602 2,176 ± 1,060
Volume of colloid infused (ml) 0 2,247 ± 697b
Volume of red blood cells
infused (ml)
131 ± 268 159 ± 320
Number of patients who
received red blood cells
45
Volume of FFP infused (ml) 0 35 ± 106
Number of patients who
received FFP
02
Total volume infused (ml) 1,694 ± 705 4,618 ± 1,557b
Total volume infused (ml/kg per
hour)
7 ± 2 21 ± 8b
Duration of surgery (hours) 3.7 ± 1.4 3.9 ± 2.0
SpO2, percutaneous arterial oxygen saturation; ΔPP, variation in
arterial pulse pressure; FFP, fresh frozen plasma; C, control; I,
intervention. aP < 0.05, end of surgery versus start of surgery; bP <
0.0001, control group versus intervention group.
Table 3
Hemodynamic and physiologic status on admission to ICU and
24 hours later
Status Group
C (n = 16) I (n = 17)
On admission to ICU
Mean arterial pressure (mmHg) 66 ± 20 80 ± 18a
Heart rate (/min) 90 ± 18 85 ± 20
SpO2 (percentage) 96 ± 4 96 ± 2
Lactate (mmol/l) 1.5 ± 1.1 1.1 ± 0.8
At 24 h after admission to ICU
Mean arterial pressure (mmHg) 80 ± 12 82 ± 11
Heart rate (/min) 92 ± 21 85 ± 18
SpO2 (%) 97 ± 3 95 ± 3
Vasoactive support (n) 8 2a
Lactate (mmol/l) 1.9 ± 1.1 0.7 ± 0.8b
Mean lactate over 24 h (mmol/l) 2.4 ± 1.1 1.2 ± 0.4c
ICU, intensive care unit; SpO2, percutaneous arterial oxygen
saturation; C, control; I, intervention. aP < 0.05, bP < 0.01, cP <
0.001, control group versus intervention group.


%20--%3e%3cdefs%3e%3cstyle%3e%20.st0%20{%20fill:%20%23fff;%20}%20.st1%20{%20fill:%20%237800fa;%20}%20%3c/style%3e%3c/defs%3e%3cpath%20class='st1'%20d='M117.78,12.18H43.11c2.9,3.47,4.65,7.94,4.65,12.82,0,5.6-2.3,10.66-6.01,14.29h76.02l7.22-13.56-7.22-13.56Z'/%3e%3cg%3e%3cpath%20class='st0'%20d='M53.58,26.17h-.59v-1.46h.59v-4.96h2.83c1.78,0,2.67.94,2.67,2.82v5.76c0,1.87-.89,2.81-2.67,2.81h-2.83v-4.96ZM55.36,21.37v3.34h1.1v1.46h-1.1v3.34h1.01c.61,0,.91-.37.91-1.1v-5.93c0-.74-.3-1.1-.91-1.1h-1.01Z'/%3e%3cpath%20class='st0'%20d='M65.99,31.14h-1.8l-.31-2.07h-2.19l-.31,2.07h-1.64l1.82-11.39h2.62l1.82,11.39ZM65.28,18.04c-.25.46-.51.77-.75.94-.21.15-.47.22-.79.22-.26,0-.57-.07-.92-.22l-.38-.15c-.14-.05-.26-.07-.37-.07-.3,0-.53.18-.71.54l-.91-.68c.25-.46.51-.77.75-.94.21-.14.48-.21.79-.21.26,0,.57.07.92.21l.38.15c.14.05.26.07.37.07.3,0,.53-.18.71-.54l.91.68ZM61.91,27.52h1.73l-.87-5.76-.87,5.76Z'/%3e%3cpath%20class='st0'%20d='M74.53,26.89v1.52c0,1.91-.89,2.86-2.67,2.86s-2.67-.95-2.67-2.86v-5.93c0-1.91.89-2.86,2.67-2.86s2.67.95,2.67,2.86v1.11h-1.69v-1.22c0-.75-.31-1.12-.93-1.12s-.93.37-.93,1.12v6.15c0,.74.31,1.11.93,1.11s.93-.37.93-1.11v-1.63h1.69Z'/%3e%3cpath%20class='st0'%20d='M81.4,31.14h-1.8l-.31-2.07h-2.19l-.31,2.07h-1.64l1.82-11.39h2.62l1.82,11.39ZM75.9,19.2l1.52-1.91h1.71l1.51,1.91h-1.61l-.76-.95-.75.95h-1.61ZM77.32,27.52h1.73l-.87-5.76-.87,5.76ZM83.1,15.99l-1.76,1.91h-1.26l1.17-1.91h1.86Z'/%3e%3cpath%20class='st0'%20d='M84.86,19.75c1.78,0,2.67.94,2.67,2.82v1.48c0,1.87-.89,2.81-2.67,2.81h-.85v4.28h-1.79v-11.39h2.64ZM84.01,21.37v3.86h.85c.58,0,.87-.36.87-1.08v-1.71c0-.71-.29-1.07-.87-1.07h-.85Z'/%3e%3cpath%20class='st0'%20d='M93.51,19.75c1.78,0,2.67.94,2.67,2.82v1.48c0,1.87-.89,2.81-2.67,2.81h-.85v4.28h-1.79v-11.39h2.64ZM92.66,21.37v3.86h.85c.58,0,.87-.36.87-1.08v-1.71c0-.71-.29-1.07-.87-1.07h-.85Z'/%3e%3cpath%20class='st0'%20d='M98.8,31.14h-1.79v-11.39h1.79v4.88h2.03v-4.88h1.83v11.39h-1.83v-4.88h-2.03v4.88Z'/%3e%3cpath%20class='st0'%20d='M105.36,24.55h2.46v1.62h-2.46v3.34h3.09v1.63h-4.88v-11.39h4.88v1.63h-3.09v3.18ZM108.17,17.29l-1.76,1.91h-1.26l1.17-1.91h1.86Z'/%3e%3cpath%20class='st0'%20d='M112.2,19.75c1.78,0,2.67.94,2.67,2.82v1.48c0,1.87-.89,2.81-2.67,2.81h-.85v4.28h-1.79v-11.39h2.64ZM111.35,21.37v3.86h.85c.58,0,.87-.36.87-1.08v-1.71c0-.71-.29-1.07-.87-1.07h-.85Z'/%3e%3c/g%3e%3ccircle%20class='st1'%20cx='25'%20cy='25'%20r='20'/%3e%3cpath%20class='st0'%20d='M32.78,19.27c2.92,0,4.43,2.55,5.28,5.33l.71,2.17c.14.38-.33.75-.71.75h-5.61c.19-.33.24-.71.09-1.08l-.75-2.45c-.43-1.32-.99-2.64-1.79-3.77.75-.57,1.65-.94,2.78-.94h0ZM25,18.38c3.25,0,4.9,2.78,5.89,5.89l.76,2.45c.14.42-.33.8-.8.8h-11.69c-.42,0-.94-.38-.8-.8l.75-2.45c.99-3.11,2.64-5.89,5.89-5.89h0ZM25,11.35c1.74,0,3.11,1.37,3.11,3.11s-1.37,3.11-3.11,3.11-3.11-1.41-3.11-3.11,1.41-3.11,3.11-3.11h0ZM17.27,19.27c1.08,0,1.98.38,2.73.94-.8,1.13-1.37,2.45-1.74,3.77l-.8,2.45c-.14.38-.05.75.09,1.08h-5.56c-.42,0-.9-.38-.75-.75l.71-2.17c.9-2.78,2.41-5.33,5.33-5.33h0ZM17.27,12.91c1.51,0,2.78,1.27,2.78,2.83s-1.27,2.83-2.78,2.83-2.83-1.27-2.83-2.83,1.27-2.83,2.83-2.83h0ZM32.78,12.91c1.56,0,2.78,1.27,2.78,2.83s-1.23,2.83-2.78,2.83-2.83-1.27-2.83-2.83,1.27-2.83,2.83-2.83h0ZM27.07,28.56v.09c0,.57-.24,1.08-.61,1.46h0v.05c-.38.33-.9.57-1.46.57s-1.08-.24-1.46-.61h0c-.38-.38-.61-.9-.61-1.46v-.09h1.41v.09c0,.19.05.38.19.47v.05c.09.09.28.19.47.19s.38-.09.47-.19v-.05c.14-.09.24-.28.24-.47t-.05-.09h1.41ZM30.99,28.56v.09c0,1.65-.66,3.16-1.74,4.24-1.08,1.08-2.59,1.79-4.24,1.79s-3.16-.71-4.24-1.79l-.05-.05c-1.04-1.08-1.7-2.55-1.7-4.2v-.09h1.41v.09c0,1.27.47,2.4,1.27,3.25h.05c.85.85,1.98,1.37,3.25,1.37s2.4-.52,3.25-1.37c.85-.8,1.37-1.98,1.37-3.25v-.09h1.37ZM34.99,28.56v.09c0,2.78-1.13,5.28-2.92,7.07-1.79,1.79-4.29,2.92-7.07,2.92s-5.23-1.13-7.07-2.92c-1.79-1.79-2.92-4.29-2.92-7.07v-.09h1.41v.09c0,2.4.94,4.53,2.5,6.08,1.56,1.56,3.72,2.5,6.08,2.5s4.52-.94,6.08-2.5c1.56-1.56,2.5-3.68,2.5-6.08v-.09h1.41Z'/%3e%3c/svg%3e)