
TNU Journal of Science and Technology
229(06): 129 - 139
http://jst.tnu.edu.vn 129 Email: jst@tnu.edu.vn
EFFECT OF GRINDING PARAMETERS ON SURFACE ROUGHNESS
AND CUTTING FORCE WHEN SURFACE GRINDING 90CrSi STEEL
BY HAI DUONG GRINDING WHEEL
Luu Anh Tung1*, Nguyen Ngoc Thieu1, Ha Toan Thang2
1TNU - University of Technology, 2Vietnam-Korea College of Technology in Bac Giang
ARTICLE INFO
ABSTRACT
Received:
15/01/2024
The parameters of the cutting mode and the cooling lubrication regime
play an important role in determining the efficiency and quality of the
surface grinding process. In this study, the full factorial design (2k) was
used to investigate the effect of grinding parameters of the cutting
mode and the cooling lubrication regime on the surface roughness and
the normal force when surface grinding 90CrSi steel by Hai Duong
grinding wheel. Minitab 19 software is used to design the L32
experiment with 5 input parameters: cooling flow (LL), coolant
concentration (ND), feed rate (Sd), table speed (VB) and grinding depth
(t). The analysis results show that the interaction between ND, Sd and
VB has the greatest influence on the surface roughness (Ra) after
grinding, while the depth of cut has the greatest influence on the normal
force (Fy). In addition, a regression model determining surface
roughness and normal force has been proposed. These results can be
applied directly in production, helping to select products, improve
product quality and reduce related costs.
Revised:
14/5/2024
Published:
14/5/2024
KEYWORDS
Surface grinding
90CrSi steel
Full factorial design
Hai Duong grinding wheel
Annova
ẢNH HƯỞNG CỦA MỘT SỐ THÔNG SỐ QUÁ TRÌNH
ĐẾN NHÁM BỀ MẶT VÀ LỰC CẮT KHI MÀI PHẲNG THÉP 90CrSi QUA TÔI
BẰNG ĐÁ MÀI HẢI DƯƠNG
Lưu Anh Tùng1*, Nguyễn Ngọc Thiệu1, Hà Toàn Thắng2
1Trường Đại học Kỹ thuật Công nghiệp - ĐH Thái Nguyên, 2Trường Cao đẳng Công nghệ Việt – Hàn Bắc Giang
THÔNG TIN BÀI BÁO
TÓM TẮT
Ngày nhận bài:
15/01/2024
Các thông số của chế độ cắt và chế độ trơn nguội đóng vai trò quan
trọng trong việc xác định hiệu quả và chất lượng của quá trình mài
phẳng. Trong nghiên cứu này, thí nghiệm đầy đủ (2k) được sử dụng để
khảo sát ảnh hưởng của một số thông số công nghệ của chế độ cắt và
chế độ bôi trơn làm mát đến nhám bề mặt và lực cắt pháp tuyến khi mài
phẳng thép 90CrSi qua tôi bằng đá mài Hải Dương. Phần mềm Minitab
19 được sử dụng để thiết kế thí nghiệm L32 với 5 thông số đầu vào là
lưu lượng làm mát (LL), nồng độ dung dịch làm mát (ND), lượng chạy
dao dọc (Sd), vận tốc bàn máy (VB) và chiều sâu mài (t). Kết quả phân
tích cho thấy tương tác giữa ND, Sd và VB có ảnh hưởng lớn nhất đến
nhám bề (Ra) mặt sau khi mài, trong khi chiều sâu cắt ảnh hưởng lớn
nhất đến lực cắt pháp tuyến (Fy). Ngoài ra, mô hình hồi quy xác định
nhám bề mặt và lực cắt pháp tuyến đã được đề xuất. Những kết quả này
có thể áp dụng trực tiếp trong sản xuất, giúp lựa chọn, cải thiện chất
lượng sản phẩm và giảm chi phí liên quan.
Ngày hoàn thiện:
14/5/2024
Ngày đăng:
14/5/2024
TỪ KHÓA
Mài phẳng
Thép 90CrSi
Thiết kế thí nghiệm đầy đủ
Đá mài Hải Dương
Phân tích phương sai
DOI: https://doi.org/10.34238/tnu-jst.9598
* Corresponding author. Email: luuanhtung@tnut.edu.vn

TNU Journal of Science and Technology
229(06): 129 - 139
http://jst.tnu.edu.vn 130 Email: jst@tnu.edu.vn
1. Introduction
Grinding is a process that is primarily influenced by heat [1]. The temperature in the cutting
zone during grinding can reach a range of 1000°C to 1500°C [2]. At this temperature, a range of
surface imperfections may arise in the machined parts following grinding. These include
microcracks caused by tensile residual stress, material softening due to carbon release, and surface
layer burning, among others. Hence, the thermal energy that enters the workpiece needs to be
swiftly dissipated using a suitable coolant lubrication system. In addition, the choice of a suitable
cutting regimen also has a vital impact. In addition to cooling the workpiece, the cooling of the
grinding wheel (particularly crucial for diamond or resin-bonded grinding wheels) diminishes
friction, removes debris from the machining area, and cleans the grinding wheel, thereby improving
the surface quality of the machined components [1]. Multiple coolant types and cutting strategies
have been examined using various techniques to introduce coolants into the grinding area.
In their study, E.J. da Silva and colleagues [3] performed high-speed grinding experiments on
52100 bearing steel using CBN grinding wheels. They used four different types of coolants: 20%
synthetic vegetable oil, water, 3% synthetic vegetable oil, and neat oil. The purpose of the study
was to assess the wear of the grinding wheel and the surface roughness after machining, with a
material removal rate of 6764 mm3/mm. In their study, S. Shaji and V. Radhakrishnan [4]
investigated the grinding process of carbon steel and bearing steel. They examined three different
coolant environments: dry, flood with 5% oil-based coolant, and CaF2-oil-based grinding aid. An
investigation was conducted to examine the impact of these coolant environments on cutting
forces, the ratio of Fz to Fy, surface roughness, and cutting heat. There has been a significant
research focus on the introduction of coolant into the cutting zone and the various types of
coolants used in flat grinding, driven by the growing trend of environmental protection. Some of
the coolants that have garnered considerable research interest include Minimum Quantity
Lubrication (MQL) [1], [5] – [11], water [4], dry [4], [8], [12], vegetable-based emulsion [13],
and environmentally friendly coolant [14]. Nevertheless, flood cooling remains extensively
employed because of its straightforward implementation, offering superior efficiency while
satisfying technical specifications.
Moreover, the cutting process employed during grinding has also garnered significant
attention from numerous researchers. Mustafa Kemal Külekci [15] employed the Taguchi method
to minimize surface roughness while grinding flat AISI 1040 steel with EKR46K grinding
wheels. This was achieved by optimizing cutting speed, table speed, and depth of cut. Binu
Thomas and colleagues [16] conducted an optimization study on the cutting parameters for
grinding SiC ceramic material with a grit size of 320. They used diamond grinding wheels and
employed model analysis and experimentation to ensure the desired surface roughness.
Therefore, the speed of the grinding wheel, the depth of cut, and the speed of the table have a
significant impact on the surface roughness after grinding and show similar patterns [17]. Subrata
Talapatra and Ishat Islam [18] utilized the Taguchi method to optimize the material hardness,
table speed, and depth of cut in the grinding process of 52100 bearing steel with WA36G5VBE
aluminum oxide grinding wheels. Their objective was to minimize surface roughness.
Periyasamy et al. [19] employed Response Surface Methodology (RSM) to optimize the feed
rate, depth of cut, and dressing depth for grinding AISI 1080 steel with A60V5V grinding
wheels. Furthermore, several inquiries have concentrated on identifying the most suitable
parameters for the grinding process, including the determination of grinding wheel speed, table
speed, dressing depth, and so on, for flat grinding [20] – [23], cylindrical grinding [24] – [26],
and external cylindrical grinding [27], [28]. In addition, researchers have also investigated multi-
objective optimization for the flat grinding process [29] – [31].
The above analysis shows that the cutting mode and the cooling lubrication regime have
received a lot of attention from researchers. However, studies almost exclusively focus on the

TNU Journal of Science and Technology
229(06): 129 - 139
http://jst.tnu.edu.vn 131 Email: jst@tnu.edu.vn
cutting mode or the cooling lubrication regime. Research on the simultaneous impact of both the
cutting mode and the cooling lubrication regime on surface roughness and normal shear force
during grinding has not received enough attention. This paper presents the results of 32 experiments
(L32) that aimed to examine the impact of grinding parameters on surface roughness and cutting
force during the surface grinding of 90CrSi steel using the Hai Duong grinding wheel.
2. Experiments setup
In order to assess the impact of various technological factors on the surface roughness and
tangential cutting force during the grinding of flat 90CrSi steel using Hai Duong grinding stones,
a full 2k experiment was designed using Minitab 19 software. The specific experimental
conditions are outlined in Table 1. The coolant concentration has a range of values as
recommended by the manufacturer and other parameters have a range of values currently in use
at the Precision Mechanical Engineering Enterprise, Thai Ha company. The experiment utilizes a
90CrSi alloy steel tooling material that has undergone heat treatment to achieve a hardness level
of 55-58 HRC. The chemical composition of the material is provided in Table 2. The specimen
measures 100 millimeters in length, 60 millimeters in width, and 25 millimeters in height.
Furthermore, the experimental arrangement is illustrated in Figure 1.
The study selected five input parameters: coolant concentration ND (%), coolant flow rate LL
(liters/minute), longitudinal tool feed Sd (mm/single pass), table speed VB (m/minute), and
grinding depth t (mm). The levels and respective values of these parameters are displayed in
Table 3. The experimental matrix L32 (25) is depicted in Table 4.
Table 1. The experimental conditions for surface grinding 90CrSi steel
Grinding machine
Moto-Yokohama – Japan
Grinding wheel
Cn46TB2GV1.300.32.127.30 m/s – Hai Duong, Vietnam (Figure 2)
Rotation speed of grinding wheel
1800 rev/min
Metalworking lubricants
Caltex Aquatex 3180
Lubricant method
Flood
Dresser
Multi diamond dresser, 3908-0088C, type 2 - Russia
Dressing modes
3 times with a depth of 0.02 mm, 1 time with a depth of 0.01 mm
with the same feed rate of 1.6 m/min
Flow measurement instrument
Z-5615 Panel Flowmeter – Thailand
Surface roughness measuring device
SJ201 – Mitutoyo – Japan
Three Component Dynamometer
Kistler 9257BA – Switzerland
Table 2. Chemical composition of elements of 90CrSi tool alloy steel
Chemical composition (%)
C
Si
Mn
P≤
S≤
Cr≤
Mo≤
Ni≤
V≤
W≤
Others
0.85-0.95
1.2 -1.6
0.3 -0.6
0.03
0.03
0.95 - 1.25
0.2
0.35
0.15
0.2
Cu ≤ 0.3; Ti ≤ 0.03
Table 3. Levels and corresponding values of experimental input parameters
Level
Variable
Lowest
Highest
Real
Encode
Real
Encode
Coolant flow LL (lit/min)
10
-1
20
+1
Coolant concentration ND [%]
3
-1
5
+1
Cross feed Sd [mm/strock]
8
-1
12
+1
Table speed VB [m/min]
8
-1
12
+1
Depth of cut t [mm]
0.01
-1
0.02
+1
Following the establishment of the system, experiments were systematically conducted in a
predetermined sequence within the same machine run at the Precision Mechanical Engineering
Enterprise, Thai Ha company. The Kistler 9257BA was used to measure the normal cutting force
TNU Journal of Science and Technology
229(06): 129 - 139
http://jst.tnu.edu.vn 132 Email: jst@tnu.edu.vn
Fy during the 3rd grinding cycle (Figure 3). The surface roughness was measured using the SJ201
roughness measuring device after the third grinding cycle (Figure 4). The experiment was
conducted three times. The surface roughness value and cutting force are calculated as the mean
of three experimental runs, as illustrated in Table 5.
Table 4. Arrange experimental matrix L32 (25)
StdOrder
RunOrder
CenterPt
Blocks
LL
[lit/min]
ND
[%]
Sd
[mm/strock]
VB
[m/min]
t
[mm]
28
1
1
1
20
5
8
12
0.02
3
2
1
1
10
5
8
8
0.01
5
3
1
1
10
3
12
8
0.01
27
4
1
1
10
5
8
12
0.02
…
6
31
1
1
20
3
12
8
0.01
17
32
1
1
10
3
8
8
0.02
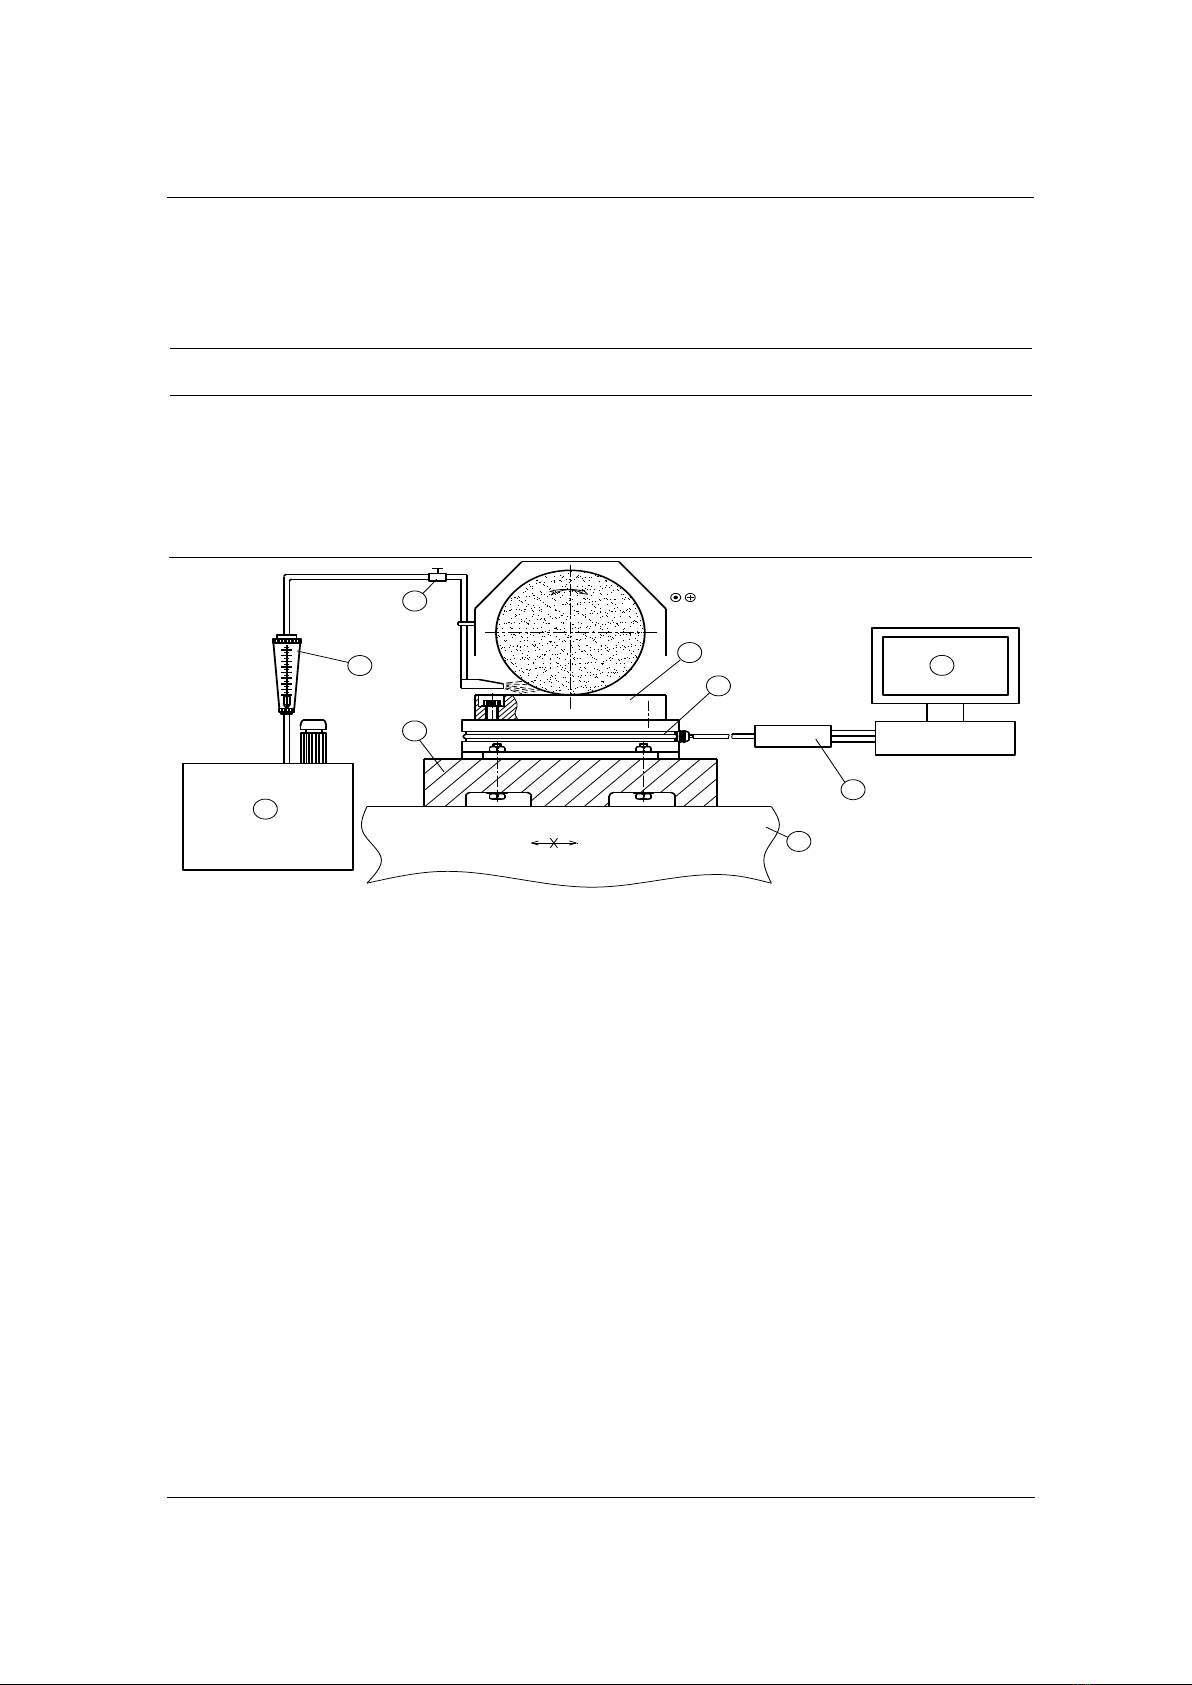
Figure 1. Experimental setup
1 – Workpiece
2 – Kistler 9257BA
3 – Adapter
4 – Flow control valve
5 – Flow measurement instrument
6 – Coolant container
7 – Magnetic table
8 – Computer
3. Results and discussion
3.1. Identify the main influencing factors
The qualitative determination of the experimental parameters that primarily influence the
surface roughness Ra and the normal cutting force Fy is achieved through the utilization of the
main effects graph (Figure 5).
In Figure 5a, five graphs illustrating the impact of 5 input parameters are displayed in five
distinct boxes, specifically regarding the surface roughness Ra. The upper-left quadrant of the
graph illustrates the impact of the LL parameter. Upon examining the graph, it can be observed
that as the value of LL changes from 10 lit/min to 20 lit/min, the objective function Ra undergoes
a variation from 0.617 μm to 0.586 μm. The gradient of this graph is calculated by subtracting the
y-coordinates (0.617 - 0.586) and dividing the result by the difference in x-coordinates, which is
2. Therefore, the slope of the graph is 0.0155. The slopes of Ra with respect to changes in ND,
Sd, VB, and t are as follows: 0.041, 0.007, 0.014, and 0.012, respectively. The qualitative
comparison reveals that the ND graph has the highest slope, followed by LL, VB, t, and finally Sd.
Hence, it is clear that ND exerts the most significant impact, whereas Sd has the least significant
impact on the objective function of surface roughness, Ra.
Vd
Vb
Sd
1
2
3
7
6
5
4
8
9

TNU Journal of Science and Technology
229(06): 129 - 139
http://jst.tnu.edu.vn 133 Email: jst@tnu.edu.vn
Table 5. Results of measuring surface roughness and normal cutting force of experimental L32
StdOrder
RunOrder
CenterPt
Blocks
LL
ND
Sd
VB
t
Ra
[m]
Fy
[N]
28
1
1
1
20
5
8
12
0.02
0.496
141.7
3
2
1
1
10
5
8
8
0.01
0.893
65
5
3
1
1
10
3
12
8
0.01
0.616
93.3
27
4
1
1
10
5
8
12
0.02
0.606
166.7
32
5
1
1
20
5
12
12
0.02
0.752
183.3
25
6
1
1
10
3
8
12
0.02
0.546
146.7
15
7
1
1
10
5
12
12
0.01
0.687
99.7
16
8
1
1
20
5
12
12
0.01
0.663
110.7
22
9
1
1
20
3
12
8
0.02
0.67
151
4
10
1
1
20
5
8
8
0.01
0.609
76.7
20
11
1
1
20
5
8
8
0.02
0.774
121.7
18
12
1
1
20
3
8
8
0.02
0.416
105
24
13
1
1
20
5
12
8
0.02
0.63
154.3
13
14
1
1
10
3
12
12
0.01
0.546
97.7
8
15
1
1
20
5
12
8
0.01
0.449
86
9
16
1
1
10
3
8
12
0.01
0.549
102.7
26
17
1
1
20
3
8
12
0.02
0.638
142.3
2
18
1
1
20
3
8
8
0.01
0.444
67.3
1
19
1
1
10
3
8
8
0.01
0.44
51.3
21
20
1
1
10
3
12
8
0.02
0.583
145
12
21
1
1
20
5
8
12
0.01
0.428
89.7
11
22
1
1
10
5
8
12
0.01
0.796
119
7
23
1
1
10
5
12
8
0.01
0.51
88.3
19
24
1
1
10
5
8
8
0.02
0.815
105
30
25
1
1
20
3
12
12
0.02
0.605
159.3
14
26
1
1
20
3
12
12
0.01
0.611
100.7
29
27
1
1
10
3
12
12
0.02
0.665
148.3
31
28
1
1
10
5
12
12
0.02
0.649
131.7
23
29
1
1
10
5
12
8
0.02
0.514
152
10
30
1
1
20
3
8
12
0.01
0.604
81.7
6
31
1
1
20
3
12
8
0.01
0.583
85.7
17
32
1
1
10
3
8
8
0.02
0.452
91.7
In Figure 5b, the slopes of the objective function Fy with respect to changes in LL, ND, Sd,
VB, and t are 1.652, 3.806, 9.775, 11.957, and 25.944, respectively. Upon qualitative comparison,
it is evident that the graph's slope with respect to the parameter t is the highest, followed by VB,
Sd, ND, and finally LL. Therefore, the variable t has the most significant impact, while LL has
the least significant impact on the Fy objective function.
The data presented in Figures 5a and 5b clearly show that there is a direct relationship
between the flow rate and surface roughness, where an increase in flow rate leads to an increase
in surface roughness. Additionally, there is an inverse relationship between the flow rate and
cutting force, where an increase in flow rate results in a decrease in cutting force. An
augmentation in the coolant concentration, feed rate, table speed, and depth of cut all results in an
escalation of both surface roughness and cutting force. To clarify, the following explanation can
be provided: An augmentation in the rate of fluid movement diminishes the effectiveness of the
cooling lubricant, resulting in an escalation of the force exerted during cutting and a reduction in
the smoothness of the surface. An increased coolant concentration leads to a thickening of the
coolant, which in turn reduces its ability to escape. This results in an elevation of both cutting
force and surface roughness. Augmenting the feed rate leads to an expansion of the cutting area,
which refers to the contact between the cutting tool and the workpiece surface. This expansion


![Bài tập tối ưu trong gia công cắt gọt [kèm lời giải chi tiết]](https://cdn.tailieu.vn/images/document/thumbnail/2025/20251129/dinhd8055/135x160/26351764558606.jpg)