
Lecture 6. CONTINUOUS PROBABILITYLecture 6. CONTINUOUS PROBABILITY
Continuous Random Variable
Density Function
Parameter
Uniform Distribution
Normal Distribution
Cutoff point
[1] Chapter 6. pp. 255 - 294
PROBABILITY & STATISTICS – Bui Duong Hai – NEU – www.mfe.edu.vn/buiduonghai 1

6.1. Continuous Random Variable6.1. Continuous Random Variable
Continuous Random Variable: uncountable values
Available value is one interval: =(,)
Maybe: =−∞; =+∞
Probability that one point: ==0
Consider Probability at one interval: ( < < )
PROBABILITY & STATISTICS – Bui Duong Hai – NEU – www.mfe.edu.vn/buiduonghai 2
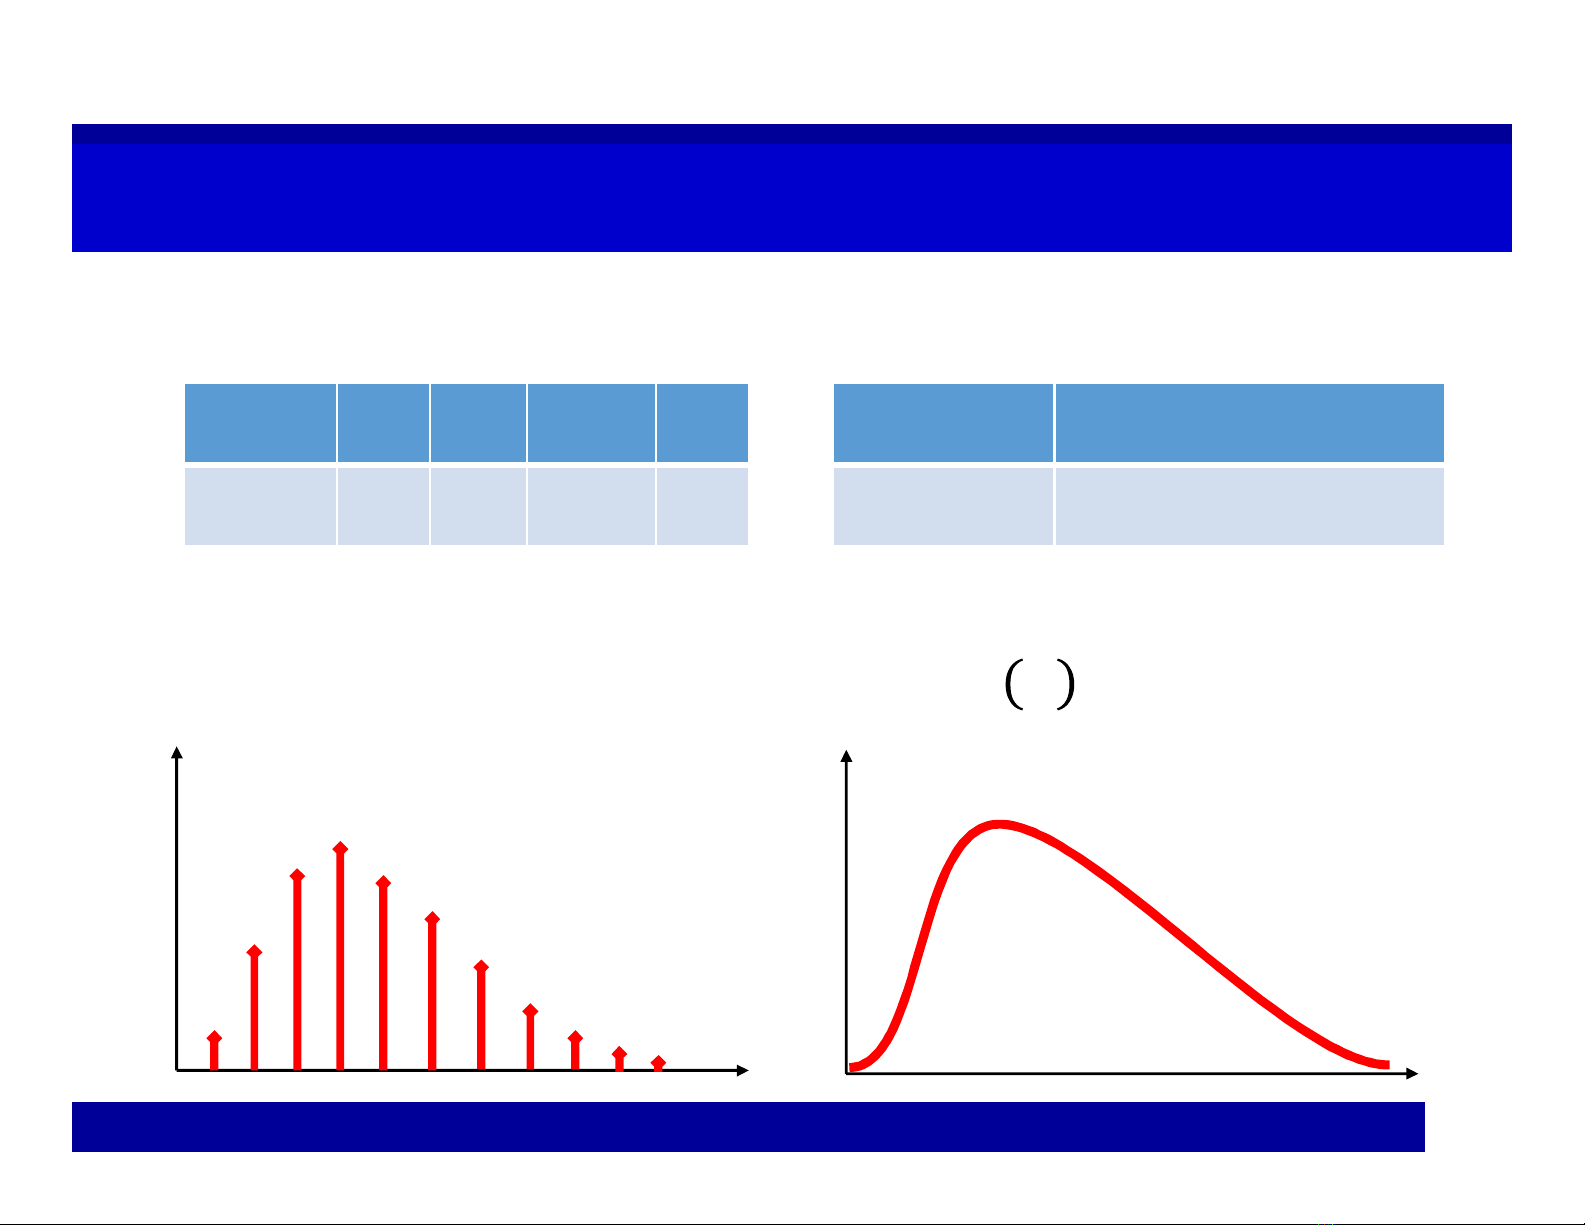
6.2. Density Function6.2. Density Function
Discrete Continuous
∑
=1
∫
=1
PROBABILITY & STATISTICS – Bui Duong Hai – NEU – www.mfe.edu.vn/buiduonghai 3
X…
Prob. …
X(,)
Density ()
f(x)
p
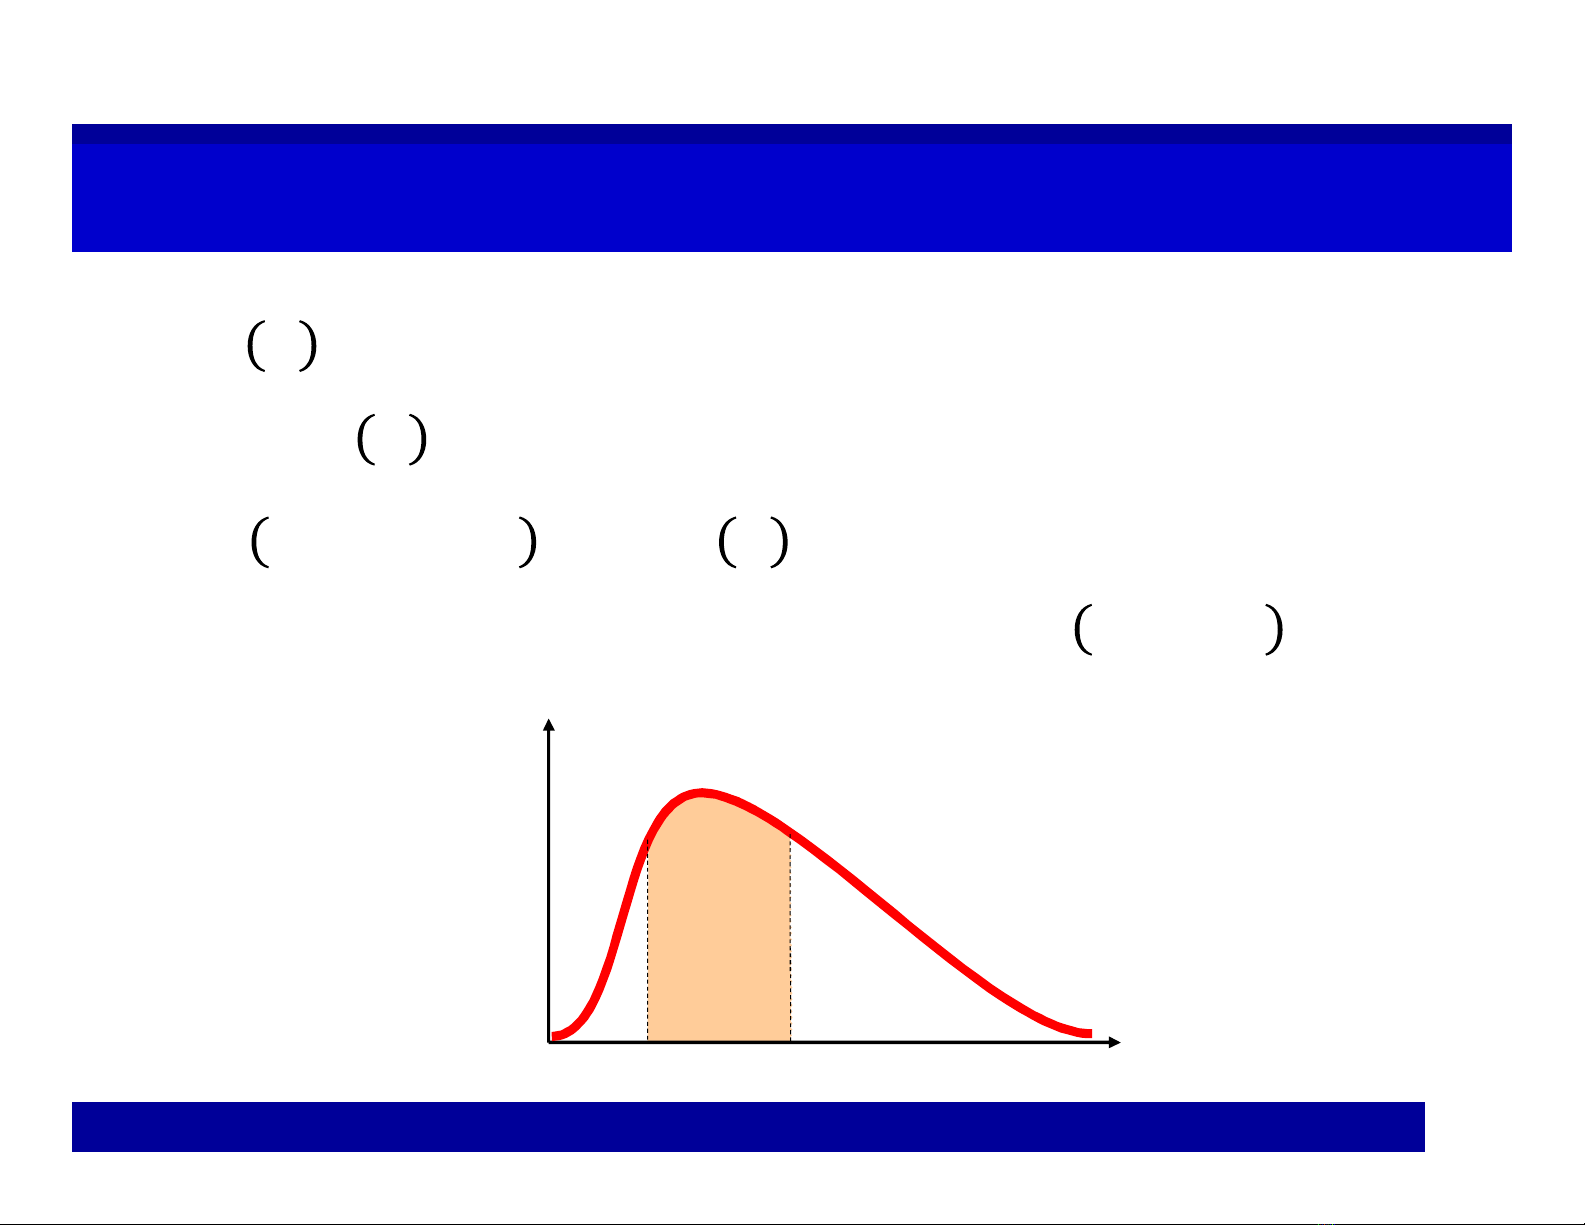
Density FunctionDensity Function
≥0
∫
=1
<< =
∫
Cutoff point level denoted by : >=
PROBABILITY & STATISTICS – Bui Duong Hai – NEU – www.mfe.edu.vn/buiduonghai 4
f(x)
a b
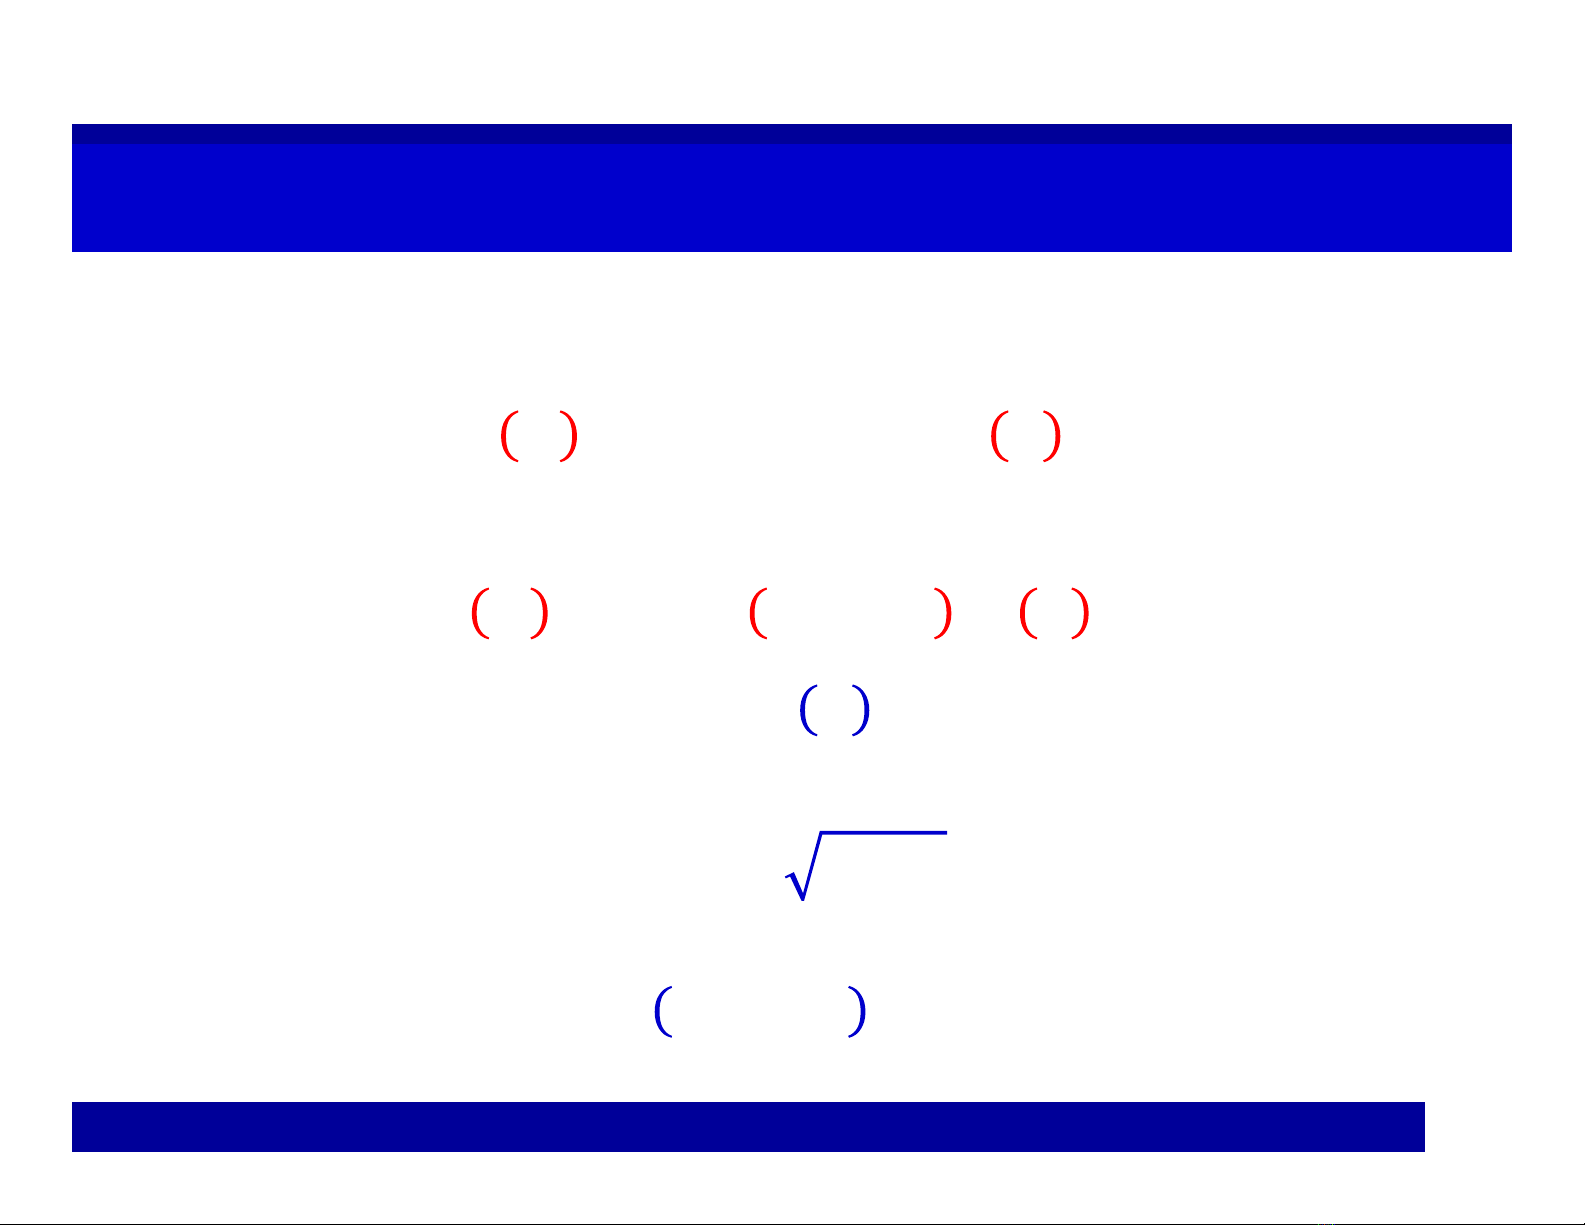
6.3. Parameter6.3. Parameter
Expected Value:
==
∫
Variance: =
∫
−
=
∫
−
Standard Deviation= ()
Cutoff point level , denoted by :
>
=
PROBABILITY & STATISTICS – Bui Duong Hai – NEU – www.mfe.edu.vn/buiduonghai 5


![Bài giảng Tính toán tiến hóa: Bài 6 - TS. Huỳnh Thị Thanh Bình [Mới nhất]](https://cdn.tailieu.vn/images/document/thumbnail/2023/20230211/kimphuong1001/135x160/8401676110802.jpg)


![Bài tập Đại số tuyến tính [chuẩn nhất]](https://cdn.tailieu.vn/images/document/thumbnail/2025/20250930/dkieu2177@gmail.com/135x160/79831759288818.jpg)