
Macroeconomic Analysis of Countries Selected for Tesla Model 3
Global Expansion
Background
Developing countries depend heavily on imports of foreign oil and heavy oil consumption is widely
unregulated that cause extreme air pollution. Electric cars can reduce dependency on oil fuel
consumption and greenhouse gas emission. Despite higher initial costs, electric vehicles have the
potential to save money and help communities become healthier and more energy independent.
Electric vehicles are making much more economic sense, and their environmental benefits will soon see
them become widely adopted. Forward thinking governments started to provide additional incentives
at the time of purchase,
Although initially electric vehicles by Tesla were very expensive and targeted for customers less sensitive
to price , the company business strategy more recently has also been focused on bringing down the cost
of battery, which in turn allow them to offer cheaper and higher volume cars. The most recent Model 3
and the Model Y, are priced much lower, and aimed at a higher volume market, selling over 100,000
vehicles each quarter. Tesla continuously updates the hardware of its cars rather than waiting for a new
model year, as opposed to nearly every other car manufacturer. Outside United States, Tesla opened its
first "Gigafactory" in China and Germany between 2019- 2020 and aim to expand market share in Asia,
Mideast and Europe.
Purpose
The purpose of this analysis is to leverage the macroeconomic indicator extract from public data source
that impact countries that can help inform decisions on choosing final candidate for Tesla Model 3
global expansion and investment project.
The analysis compares top 2 countries selected in previous assignment based on indexing and ranking.
Looking at both dynamic economic indicators trend over past 5 years as well as static indicator of most
recent year will help decide which one is best fit for investment project.
Data Source
GDP per capita, Inflation and unemployment, trade openness were extracted from The World Bank. The
World Bank
Corruption was extracted from Transparency International, Corruption Perceptions Index 2018 (CPI-
2018. Transparency International CPI
Dynamic Variables Analysis
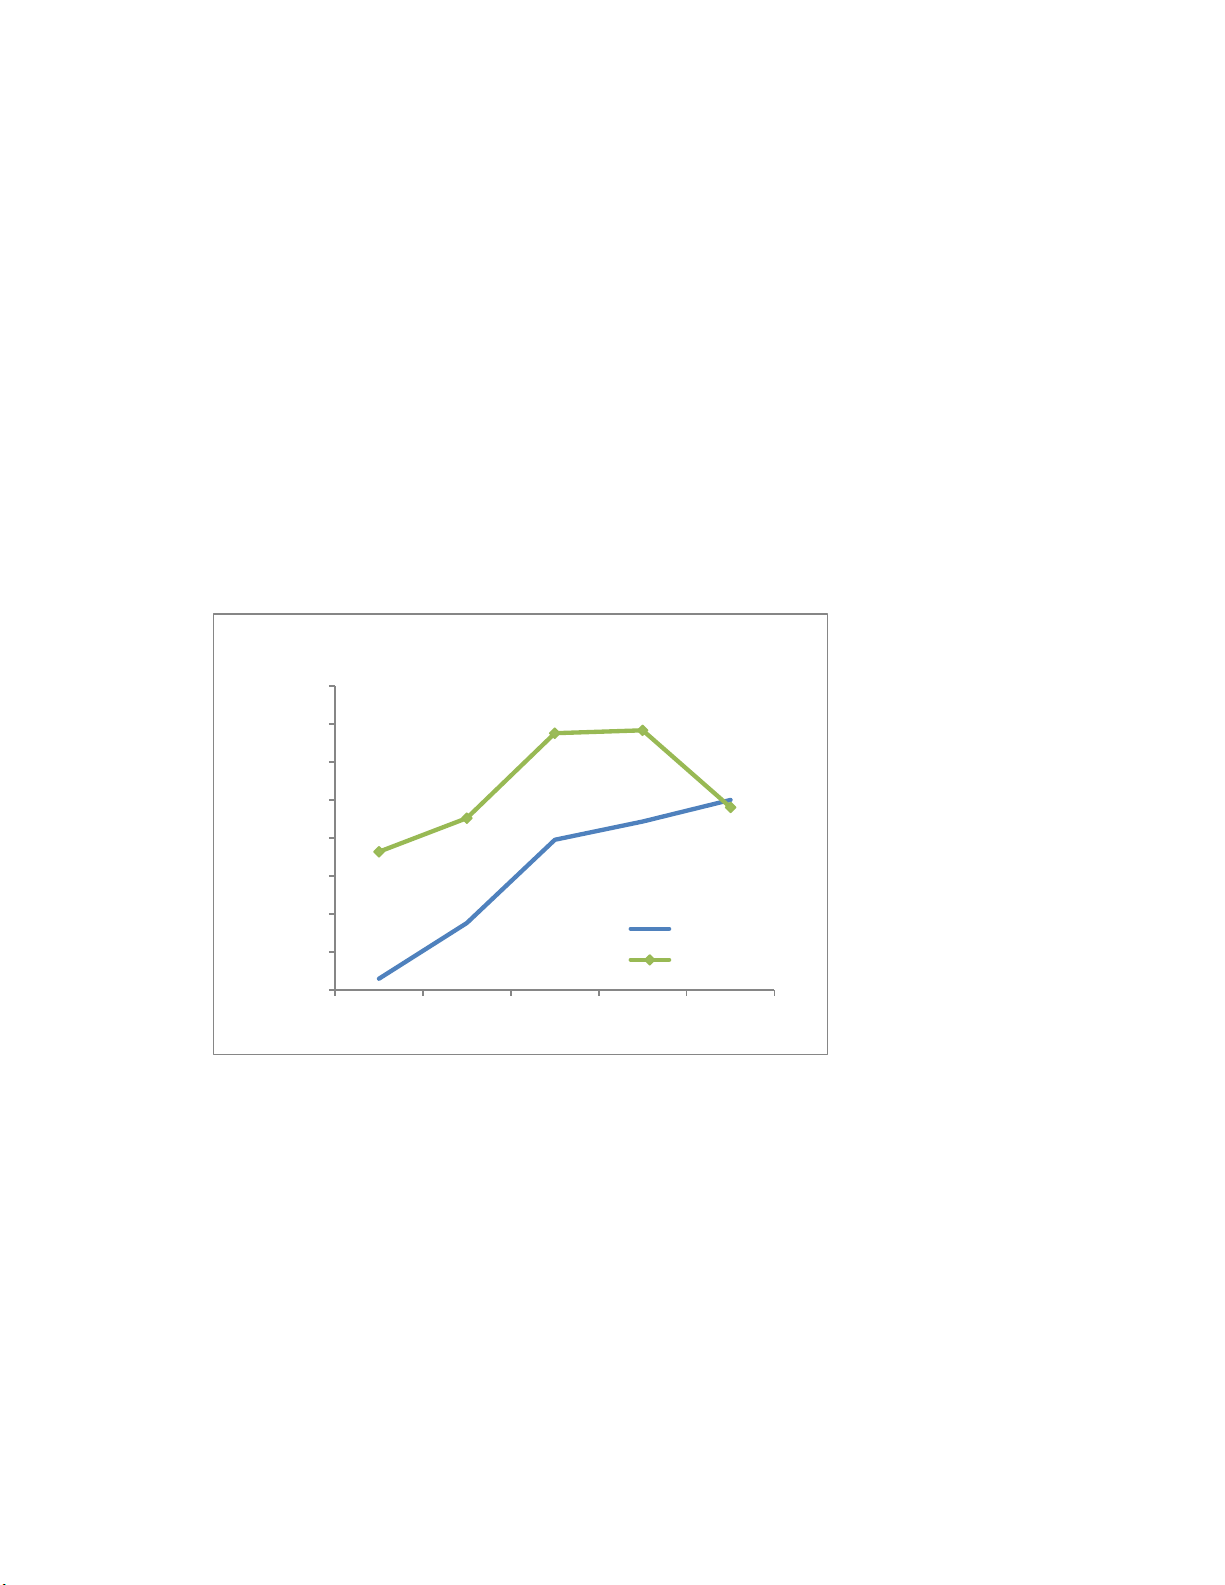
1. GDP per Capita Trend over 5 years
Gross Domestic Product (GDP) per capita shows a country's GDP divided by its total population.
Global analysis of per capita GDP helps provide comparable insight on economic prosperity and
economic developments across the globe.
Malaysia had higher GDP per capita than China (9,818 vs. 8,148) back to 2016. After 2016, Malaysia
growth started to slow down, plateau at ~11K in 2019 and dropped to ~10K in 2020. China however,
is shown to be continuously growing and reached similar level ~10K as Malaysia in 2020. If the
historical trend continues, we would expect to see more growth in China and exceed Malaysia in
next a few years.
With fast growth in GDP per capita, China consumer purchasing power will likely surplus Malaysia
and generates more demand for goods in near future.
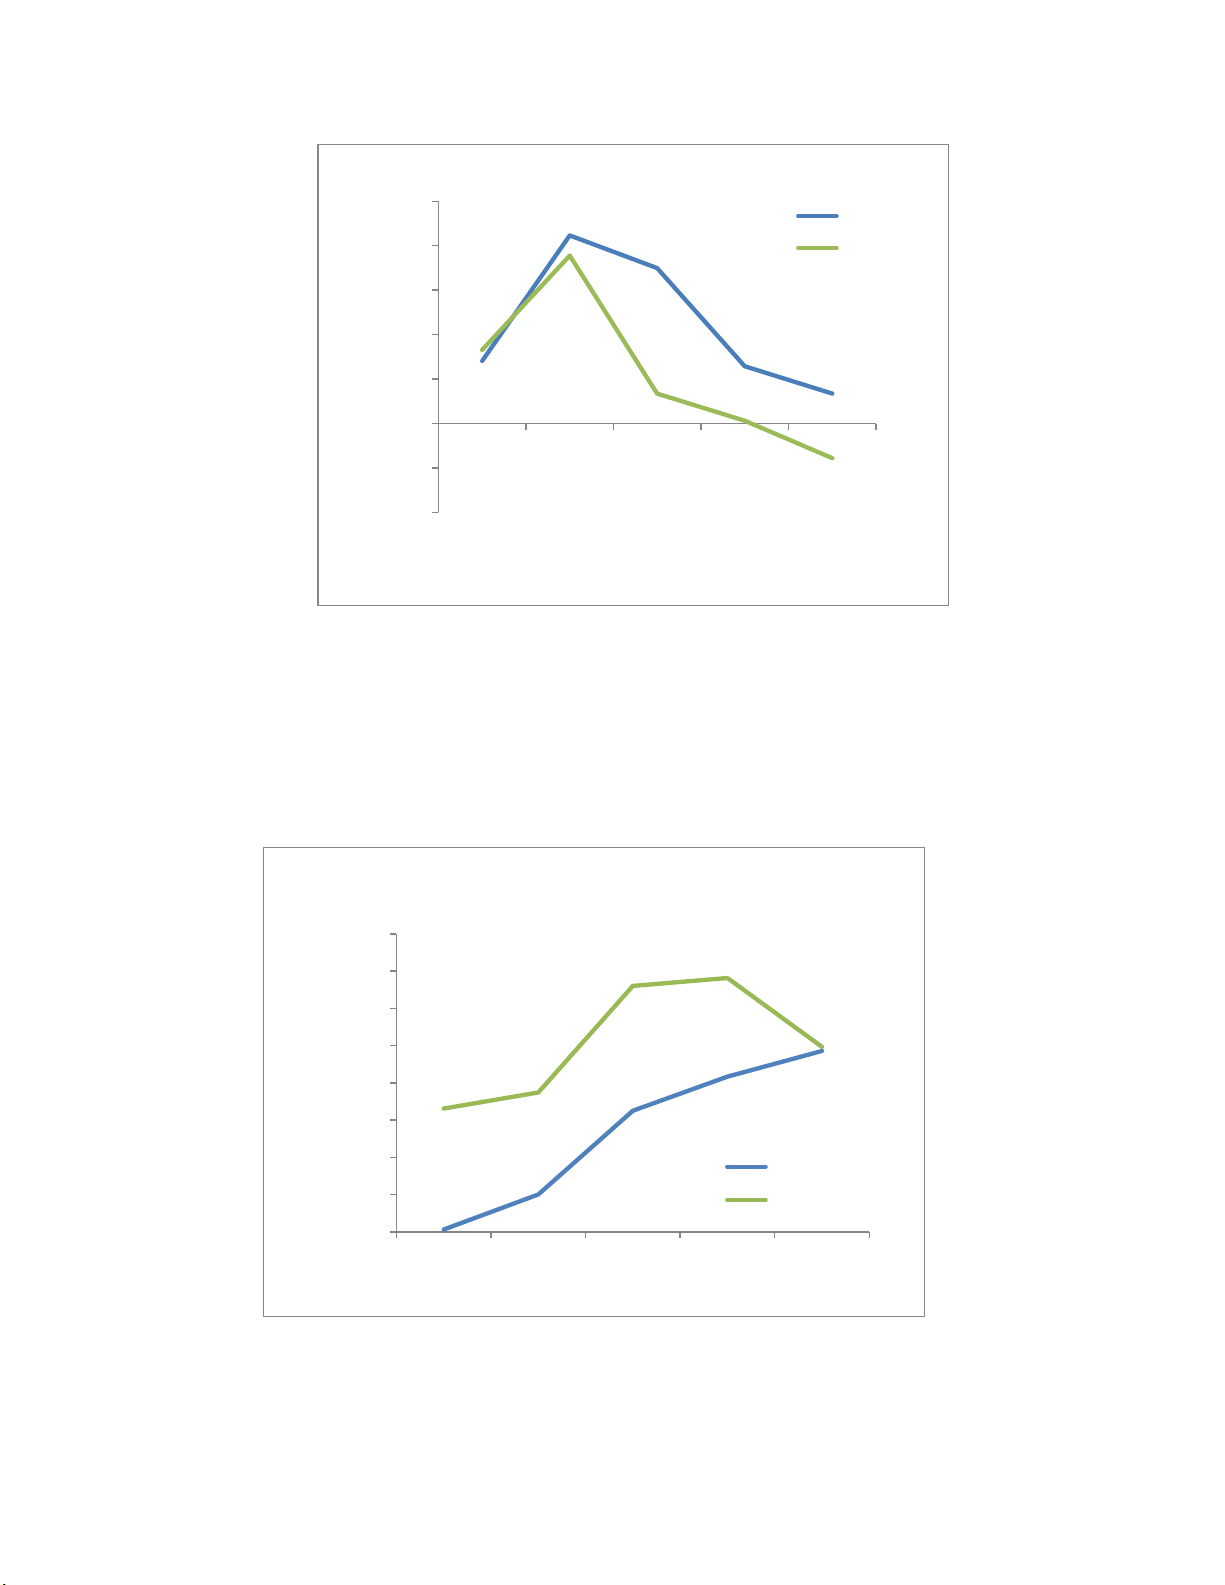
2. Inflation, GDP deflator (annual %)
The GDP price deflator, also known as the GDP deflator or the implicit price deflator, measures the
changes in prices for all of the goods and services produced in an economy. Using the GDP price deflator
helps economists compare the levels of real economic activity from one year to another. When looking
at inflation trend of China and Malaysia over the past 5 years, both countries show similar pattern that
inflation increased from ~1% to 4% in 2107 and then started to decline and below 1% in 2020, although
Malaysia we saw slightly stronger dampen.
9,818
10,259
11,378 11,414
10,402
8,148
8,879
9,977
10,217
10,500
8000
8500
9000
9500
10000
10500
11000
11500
12000
2016 2017 2018 2019 2020
GDP per capita (current US$)
Year
GDP per Capita Trend over 5 Years
China
Malaysia
If correcting GDP per capita with inflation rate as shown below, we still see similar trend that Malaysia
GDP growth slows down, while China is growing and expected to exceed Malaysia in next few year if
historical trend continues.
1.4
4.2
3.5
1.3
0.7
1.7
3.8
0.7
0.1
-0.8
-2.0
-1.0
0.0
1.0
2.0
3.0
4.0
5.0
2016 2017 2018 2019 2020
Inflation, GDP deflator (annual %)
Year
Inflation, GDP deflator Trend over 5 Years
China
Malaysia
8,033
8,504
9,628
10,085
10,430
9,655 9,872
11,301 11,407
10,483
8000
8500
9000
9500
10000
10500
11000
11500
12000
2016 2017 2018 2019 2020
Real GDP per capita (current US$)
Year
Real GDP per Capita Corrected with Inflation
Trend over 5 Years
China
Malaysia
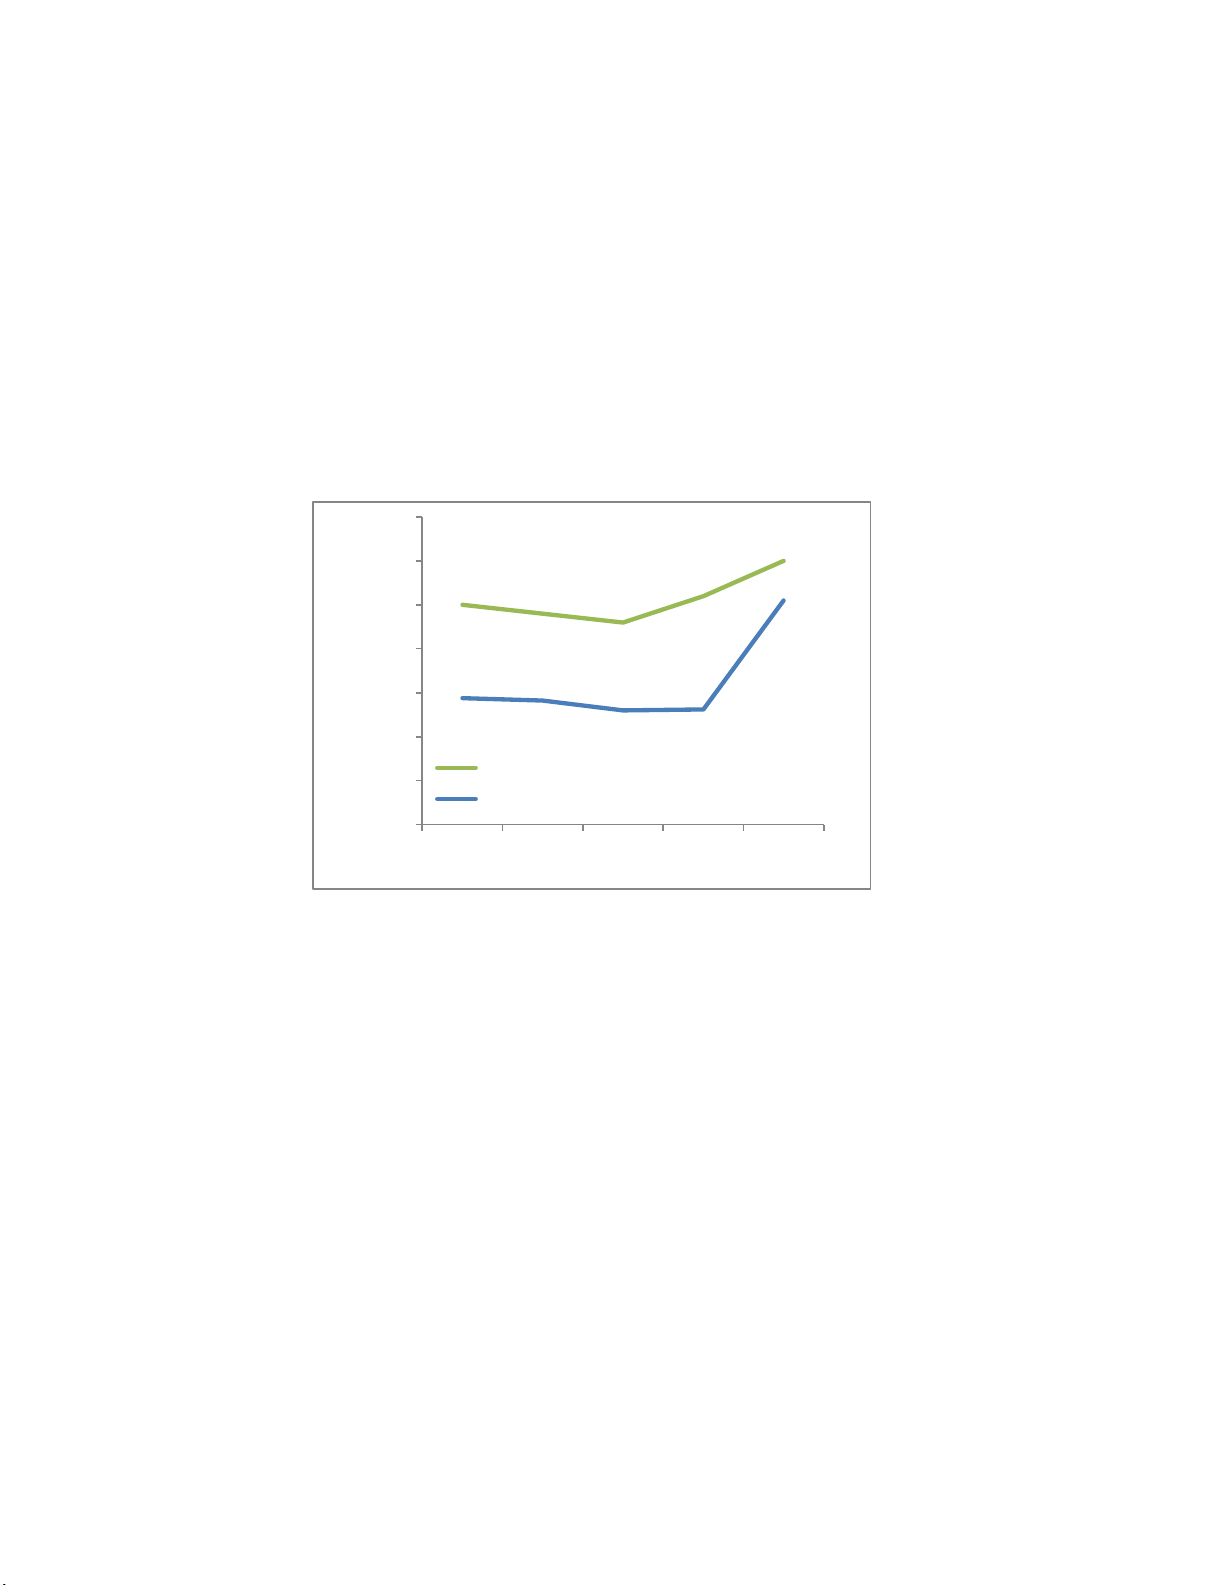
3. Unemployment
Unemployment refers to the share of the labor force that is without work but available for and seeking
employment. When the economy is in poor shape and jobs are scarce, the unemployment rate can be
expected to rise. When the economy is growing at a healthy rate and jobs are relatively plentiful, it can
be expected to fall.
When comparing unemployment between China and Malaysia, China’s rate has been relatively steady
around 4-5%, while Malaysia rate was lower around 3% before 2019 and increased to 4.5% in 2020.
Overall, the trend of both countries is steady with small fluctuation.
Static Variable Analysis
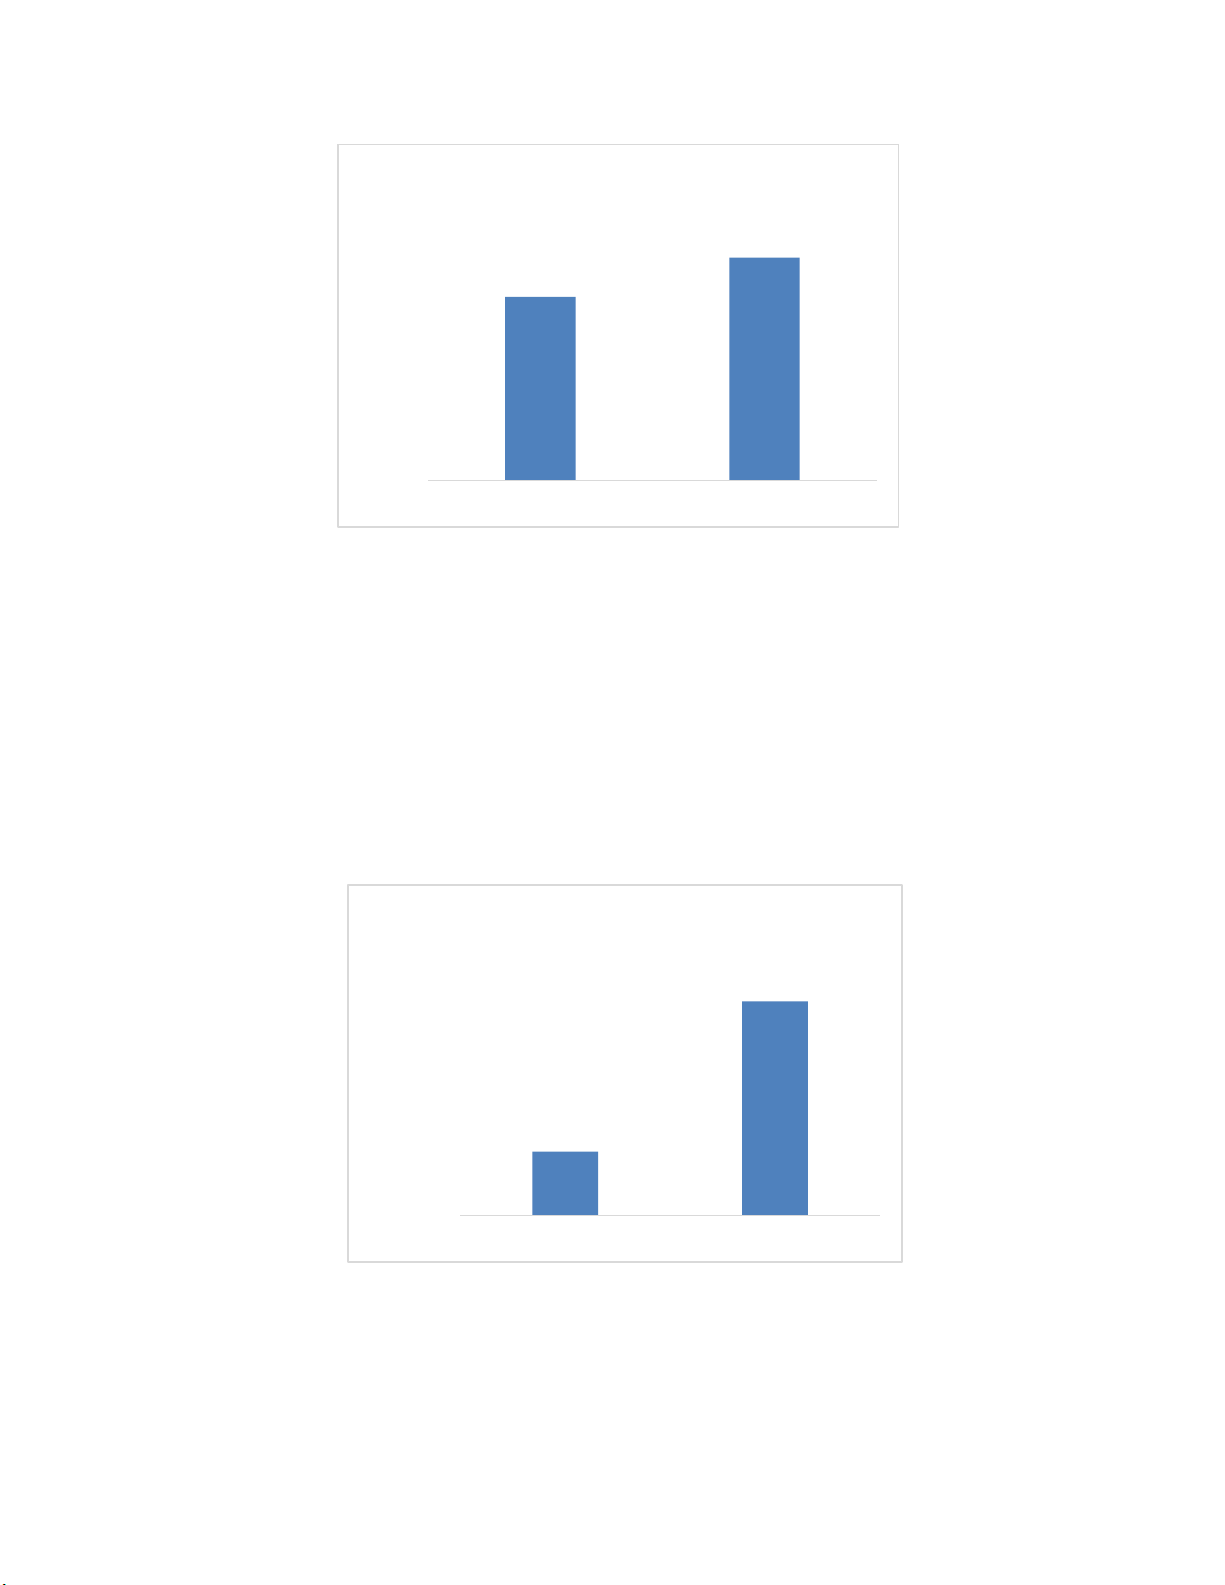
1. Corruption
The index, which ranks 180 countries and territories by their perceived levels of public sector corruption
according to experts and businesspeople, uses a scale of 0 to 100, where 0 is highly corrupt and 100 is
very clean. More than two-thirds of countries score below 50 on this year’s [2018] CPI, with an average
score of just 43." This indicator typically matters, because it is risky and expensive to do business in
corrupt countries.
When comparing China to Malaysia, China is scored as 42, similar to the global average 43, while
Malaysia is scored higher with less corruption and slightly better for foreigner business.
4.5 4.4 4.3
4.6
5
3.44 3.41 3.3 3.31
4.55
2
2.5
3
3.5
4
4.5
5
5.5
2016 2017 2018 2019 2020
Unemployment (% of total labor
force)
Year
Unemployment Rate Trend over 5
Years
China
Malaysia
2. Trade Openness (%GDP)
Trade is the sum of exports and imports of goods and services measured as a share of gross domestic
product. We will use trade expressed as percentage of GDP as a proxy for country's openness to trade.
This indicator matters because countries that are more open to trade are generally more hospitable to
foreign direct investment.
Malaysia has much higher rate as 117% comparing to China with 35%, indicating large influence of trade
on its domestic activities.
42
51
0
10
20
30
40
50
60
China Malaysia
Corruption
Corruption Index 2020
35%
117%
0%
20%
40%
60%
80%
100%
120%
140%
China Malaysia
Trade Openness (Trade, %GDP)
Trade Openness (%GDP) 2020


![Giáo Trình Kinh Tế Vi Mô Kế Toán Doanh Nghiệp Cao Đẳng [Mới Nhất]](https://cdn.tailieu.vn/images/document/thumbnail/2026/20260526/alfredodistefano10/135x160/26731780297773.jpg)
![Giáo Trình Kinh Tế Vi Mô: Nắm Vững Nguyên Tắc Cơ Bản [A-Z]](https://cdn.tailieu.vn/images/document/thumbnail/2026/20260526/alfredodistefano10/135x160/23961780297774.jpg)


![Giáo trình Kinh tế lao động - TS. Trương Thị Tâm [chuẩn nhất]](https://cdn.tailieu.vn/images/document/thumbnail/2026/20260508/hoatrami2026/135x160/25661778559564.jpg)

![Tài liệu học tập Phân tích lao động xã hội - TS. Trần Thị Minh Phương [mới nhất]](https://cdn.tailieu.vn/images/document/thumbnail/2026/20260508/hoatrami2026/135x160/10581778638569.jpg)
![Đề cương ôn tập Khoa học quản lý [năm học] chi tiết, chuẩn nhất](https://cdn.tailieu.vn/images/document/thumbnail/2026/20260506/camtucau2026/135x160/62691778123105.jpg)


%20--%3e%3cdefs%3e%3cstyle%3e%20.st0%20{%20fill:%20%23fff;%20}%20.st1%20{%20fill:%20%237800fa;%20}%20%3c/style%3e%3c/defs%3e%3cpath%20class='st1'%20d='M117.78,12.18H43.11c2.9,3.47,4.65,7.94,4.65,12.82,0,5.6-2.3,10.66-6.01,14.29h76.02l7.22-13.56-7.22-13.56Z'/%3e%3cg%3e%3cpath%20class='st0'%20d='M53.58,26.17h-.59v-1.46h.59v-4.96h2.83c1.78,0,2.67.94,2.67,2.82v5.76c0,1.87-.89,2.81-2.67,2.81h-2.83v-4.96ZM55.36,21.37v3.34h1.1v1.46h-1.1v3.34h1.01c.61,0,.91-.37.91-1.1v-5.93c0-.74-.3-1.1-.91-1.1h-1.01Z'/%3e%3cpath%20class='st0'%20d='M65.99,31.14h-1.8l-.31-2.07h-2.19l-.31,2.07h-1.64l1.82-11.39h2.62l1.82,11.39ZM65.28,18.04c-.25.46-.51.77-.75.94-.21.15-.47.22-.79.22-.26,0-.57-.07-.92-.22l-.38-.15c-.14-.05-.26-.07-.37-.07-.3,0-.53.18-.71.54l-.91-.68c.25-.46.51-.77.75-.94.21-.14.48-.21.79-.21.26,0,.57.07.92.21l.38.15c.14.05.26.07.37.07.3,0,.53-.18.71-.54l.91.68ZM61.91,27.52h1.73l-.87-5.76-.87,5.76Z'/%3e%3cpath%20class='st0'%20d='M74.53,26.89v1.52c0,1.91-.89,2.86-2.67,2.86s-2.67-.95-2.67-2.86v-5.93c0-1.91.89-2.86,2.67-2.86s2.67.95,2.67,2.86v1.11h-1.69v-1.22c0-.75-.31-1.12-.93-1.12s-.93.37-.93,1.12v6.15c0,.74.31,1.11.93,1.11s.93-.37.93-1.11v-1.63h1.69Z'/%3e%3cpath%20class='st0'%20d='M81.4,31.14h-1.8l-.31-2.07h-2.19l-.31,2.07h-1.64l1.82-11.39h2.62l1.82,11.39ZM75.9,19.2l1.52-1.91h1.71l1.51,1.91h-1.61l-.76-.95-.75.95h-1.61ZM77.32,27.52h1.73l-.87-5.76-.87,5.76ZM83.1,15.99l-1.76,1.91h-1.26l1.17-1.91h1.86Z'/%3e%3cpath%20class='st0'%20d='M84.86,19.75c1.78,0,2.67.94,2.67,2.82v1.48c0,1.87-.89,2.81-2.67,2.81h-.85v4.28h-1.79v-11.39h2.64ZM84.01,21.37v3.86h.85c.58,0,.87-.36.87-1.08v-1.71c0-.71-.29-1.07-.87-1.07h-.85Z'/%3e%3cpath%20class='st0'%20d='M93.51,19.75c1.78,0,2.67.94,2.67,2.82v1.48c0,1.87-.89,2.81-2.67,2.81h-.85v4.28h-1.79v-11.39h2.64ZM92.66,21.37v3.86h.85c.58,0,.87-.36.87-1.08v-1.71c0-.71-.29-1.07-.87-1.07h-.85Z'/%3e%3cpath%20class='st0'%20d='M98.8,31.14h-1.79v-11.39h1.79v4.88h2.03v-4.88h1.83v11.39h-1.83v-4.88h-2.03v4.88Z'/%3e%3cpath%20class='st0'%20d='M105.36,24.55h2.46v1.62h-2.46v3.34h3.09v1.63h-4.88v-11.39h4.88v1.63h-3.09v3.18ZM108.17,17.29l-1.76,1.91h-1.26l1.17-1.91h1.86Z'/%3e%3cpath%20class='st0'%20d='M112.2,19.75c1.78,0,2.67.94,2.67,2.82v1.48c0,1.87-.89,2.81-2.67,2.81h-.85v4.28h-1.79v-11.39h2.64ZM111.35,21.37v3.86h.85c.58,0,.87-.36.87-1.08v-1.71c0-.71-.29-1.07-.87-1.07h-.85Z'/%3e%3c/g%3e%3ccircle%20class='st1'%20cx='25'%20cy='25'%20r='20'/%3e%3cpath%20class='st0'%20d='M32.78,19.27c2.92,0,4.43,2.55,5.28,5.33l.71,2.17c.14.38-.33.75-.71.75h-5.61c.19-.33.24-.71.09-1.08l-.75-2.45c-.43-1.32-.99-2.64-1.79-3.77.75-.57,1.65-.94,2.78-.94h0ZM25,18.38c3.25,0,4.9,2.78,5.89,5.89l.76,2.45c.14.42-.33.8-.8.8h-11.69c-.42,0-.94-.38-.8-.8l.75-2.45c.99-3.11,2.64-5.89,5.89-5.89h0ZM25,11.35c1.74,0,3.11,1.37,3.11,3.11s-1.37,3.11-3.11,3.11-3.11-1.41-3.11-3.11,1.41-3.11,3.11-3.11h0ZM17.27,19.27c1.08,0,1.98.38,2.73.94-.8,1.13-1.37,2.45-1.74,3.77l-.8,2.45c-.14.38-.05.75.09,1.08h-5.56c-.42,0-.9-.38-.75-.75l.71-2.17c.9-2.78,2.41-5.33,5.33-5.33h0ZM17.27,12.91c1.51,0,2.78,1.27,2.78,2.83s-1.27,2.83-2.78,2.83-2.83-1.27-2.83-2.83,1.27-2.83,2.83-2.83h0ZM32.78,12.91c1.56,0,2.78,1.27,2.78,2.83s-1.23,2.83-2.78,2.83-2.83-1.27-2.83-2.83,1.27-2.83,2.83-2.83h0ZM27.07,28.56v.09c0,.57-.24,1.08-.61,1.46h0v.05c-.38.33-.9.57-1.46.57s-1.08-.24-1.46-.61h0c-.38-.38-.61-.9-.61-1.46v-.09h1.41v.09c0,.19.05.38.19.47v.05c.09.09.28.19.47.19s.38-.09.47-.19v-.05c.14-.09.24-.28.24-.47t-.05-.09h1.41ZM30.99,28.56v.09c0,1.65-.66,3.16-1.74,4.24-1.08,1.08-2.59,1.79-4.24,1.79s-3.16-.71-4.24-1.79l-.05-.05c-1.04-1.08-1.7-2.55-1.7-4.2v-.09h1.41v.09c0,1.27.47,2.4,1.27,3.25h.05c.85.85,1.98,1.37,3.25,1.37s2.4-.52,3.25-1.37c.85-.8,1.37-1.98,1.37-3.25v-.09h1.37ZM34.99,28.56v.09c0,2.78-1.13,5.28-2.92,7.07-1.79,1.79-4.29,2.92-7.07,2.92s-5.23-1.13-7.07-2.92c-1.79-1.79-2.92-4.29-2.92-7.07v-.09h1.41v.09c0,2.4.94,4.53,2.5,6.08,1.56,1.56,3.72,2.5,6.08,2.5s4.52-.94,6.08-2.5c1.56-1.56,2.5-3.68,2.5-6.08v-.09h1.41Z'/%3e%3c/svg%3e)