Quality zyxwvutsrqponmlkjihgfedcbaZYXWVUTSRQPONMLKJIHGFEDCBA
of
Service (QOS) and
Network Performance (NP) zyxwvutsrqponmlkjihgfedcbaZYXWVUTSRQPONMLKJIHGFEDCBA
The maintenance of good quality for any product or service (i.e. its ‘fitness for purpose’ and its
price) is of supreme importance to the consumer and therefore requires utmost management
attention. However, although it is easy enough to test a tangible product to destruction, measure-
ment of the quality of a service is more difficult. In telecommunication the customer is left with
nothing more tangible than his or her own perception of how well the communication went. On a
datalink the errors that have had to be corrected automatically are barely appreciated, while in
conversation unobtrusive bursts of line noise may go unnoticed. This is not to say that loss of
data throughput on a datalink caused by continual error correction is of no concern to the
customer, nor does it mean that noises which disturb conversation are acceptable. What we really
mean is that in measuring service quality, due regard must be paid to anything of importance that
the customer perceives and remembers. Concentration on setting and meeting quality targets
should be paramount in planning and administration. Insufficient attention to them is the road to
customer dissatisfaction and loss of business. This chapter reviews some aspects of communica-
tions quality and the practices of management, with examples of the commoner quality
parameters and control measures used by the world’s major operators. zyxwvutsrqponmlkjihgfedcbaZYXWVUTSRQPONMLKJIHGFEDCBA
34.1
FRAMEWORK FOR PERFORMANCE MANAGEMENT
Good management of whatever industry demands the use
of
simple, structured and
effective monitoring tools and control procedures
to
maintain the efficiency of the
internal business processes and the quality of the output. When all is running smoothly
a
minimum of effect should be required. However, to be able quickly to correct defects
or
cope
with abnormal circumstances, measurable means
of
reporting zyxwvutsrqponmlkjihgfedcbaZYXWVUTSRQPONMLKJIHGFEDCBA
faults
or
excep-
tions
and rapid procedures for identifying actionable tasks are required. The framework
for doing so needs to be structured and comprehensive. In Table 34.1
a
number of
simple management ‘dimensions’ together with possible management performance
tools/parameters within each dimension are presented.
As
you will note the dimensions
cover
a
range
of
areas, some requiring more tangible monitoring measures and control
procedures than others.
633
Networks and Telecommunications: Design and Operation, Second Edition.
Martin P. Clark
Copyright © 1991, 1997 John Wiley & Sons Ltd
ISBNs: 0-471-97346-7 (Hardback); 0-470-84158-3 (Electronic)
634
QUALITY zyxwvutsrqponmlkjihgfedcbaZYXWVUTSRQPONMLKJIHGFEDCBA
OF
SERVICE
(QOS)
AND NETWORK PERFORMANCE (NP)
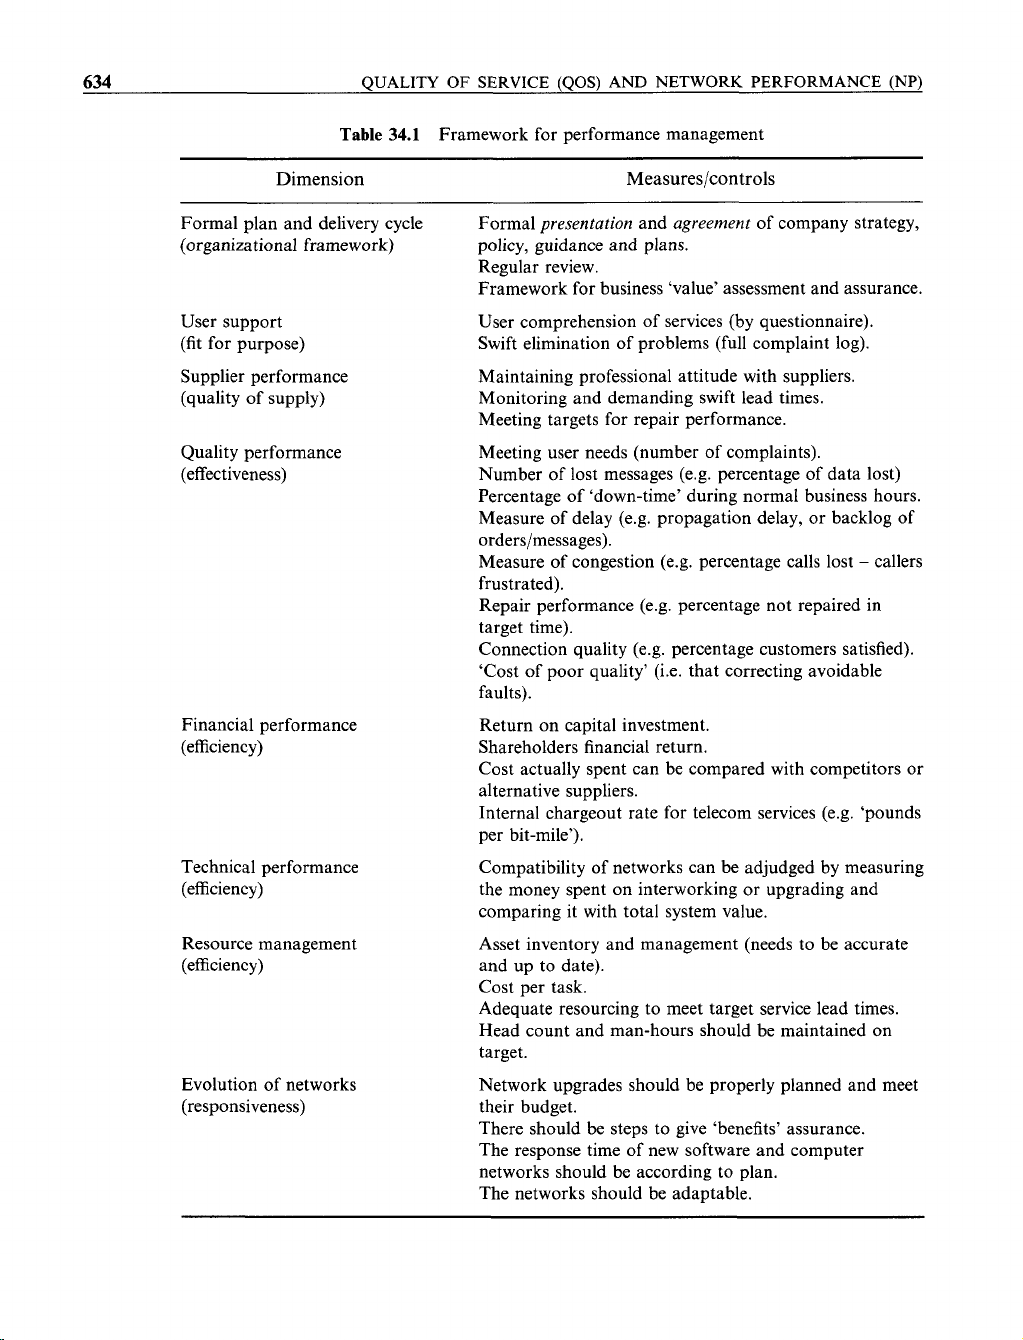
Table
34.1
Framework for performance management
Dimension Measures/controls
Formal plan and delivery cycle Formal zyxwvutsrqponmlkjihgfedcbaZYXWVUTSRQPONMLKJIHGFEDCBA
presentation
and
agreement
of company strategy,
(organizational framework) policy, guidance and plans.
Regular review.
Framework for business ‘value’ assessment and assurance.
User support
(fit for purpose)
Supplier performance
(quality of supply)
Quality performance
(effectiveness)
Financial performance
(efficiency)
Technical performance
(efficiency)
Resource management
(efficiency)
Evolution of networks
(responsiveness)
User comprehension of services (by questionnaire).
Swift elimination of problems (full complaint log).
Maintaining professional attitude with suppliers.
Monitoring and demanding swift lead times.
Meeting targets for repair performance.
Meeting user needs (number of complaints).
Number of lost messages (e.g. percentage
of
data lost)
Percentage of ‘down-time’ during normal business hours.
Measure of delay (e.g. propagation delay, or backlog of
orders/messages).
Measure of congestion (e.g. percentage calls lost zyxwvutsrqponmlkjihgfedcbaZYXWVUTSRQPONMLKJIHGFEDCBA
-
callers
frustrated).
Repair performance (e.g. percentage not repaired in
target time).
Connection quality (e.g. percentage customers satisfied).
‘Cost of poor quality’ (i.e. that correcting avoidable
faults).
Return on capital investment.
Shareholders financial return.
Cost actually spent can be compared with competitors or
alternative suppliers.
Internal chargeout rate for telecom services (e.g. ‘pounds
per bit-mile’).
Compatibility of networks can be adjudged by measuring
the money spent
on
interworking or upgrading and
comparing it with total system value.
Asset inventory and management (needs to be accurate
and up to date).
Cost per task.
Adequate resourcing to meet target service lead times.
Head count and man-hours should be maintained on
target.
Network upgrades should be properly planned and meet
their budget.
There should be steps to give ‘benefits’ assurance.
The response time of new software and computer
networks should be according to plan.
The networks should be adaptable.
QUALITY:
A
MAREKTING
VIEW zyxwvutsrqponmlkjihgfedcbaZYXWVUTSRQPONMLKJIHGFEDCBA
635
34.2
QUALITY: A MARKETING VIEW zyxwvutsrqponmlkjihgfedcbaZYXWVUTSRQPONMLKJIHGFEDCBA
To
look at a network from the customer’s viewpoint we need to understand his reasons
for using telecommunications services. It is a mistake to generalize about all customers
as ‘wanting to convey information over long distances’, as that takes no account of the
service in use, or of each customer’s individual purpose or zyxwvutsrqponmlkjihgfedcbaZYXWVUTSRQPONMLKJIHGFEDCBA
application.
It is, after all, a
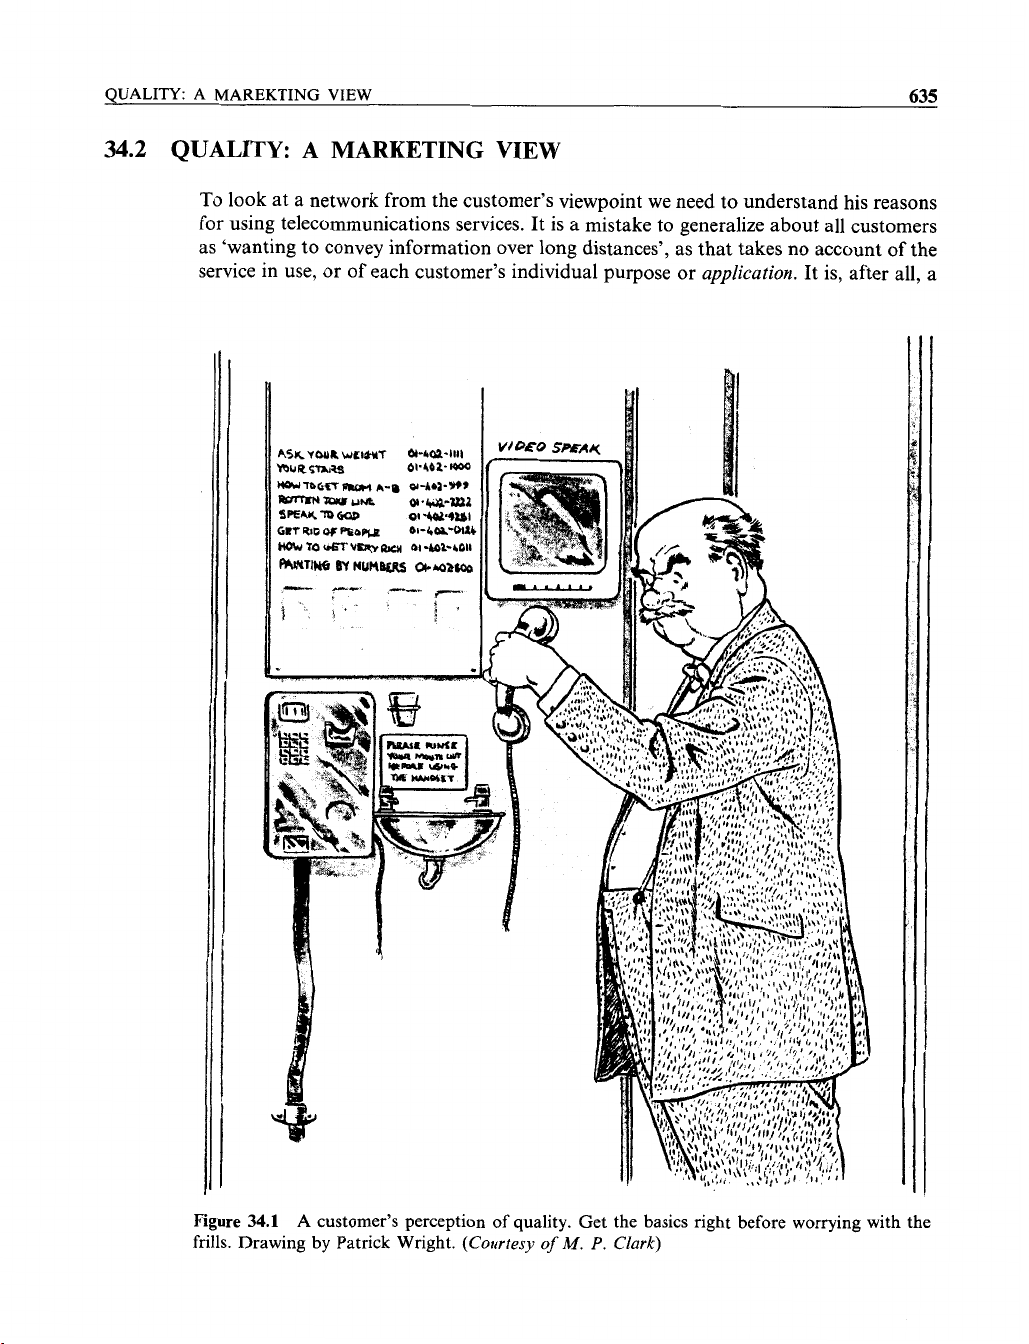
Figure
34.1
A
customer’s perception
of
quality. Get the basics right before worrying with the
frills. Drawing by Patrick Wright. zyxwvutsrqponmlkjihgfedcbaZYXWVUTSRQPONMLKJIHGFEDCBA
(Courtesy
of
M.
P.
Clurk)
636 zyxwvutsrqponmlkjihgfedcbaZYXWVUTSRQPONMLKJIHGFEDCBA
QUALITY
OF
SERVICE
(QOS)
AND NETWORK PERFORMANCE (NP)
fundamental of marketing that products should be attuned to the markets and
customers they are intended to serve. Thus the motivations and interests of someone
who is out for the evening in calling home from a payphone, are quite different from the
needs of a large multi-national company wishing to convey vast volumes of computer
data around the world on sophisticated and dedicated networks at any hour of the day
or night.
It may be that the same network infrastructure can accommodate the service needs of
a number of different markets or customer ‘clubs’ but it must do
so
without compromise.
One example of a network capable of supporting a number of services
is
the public
telephone network, and it must run at optimum quality not only for human conver-
sation, but also for facsimile machine interconnection. A more advanced example of
integrated services networks is the zyxwvutsrqponmlkjihgfedcbaZYXWVUTSRQPONMLKJIHGFEDCBA
integrated services digital network zyxwvutsrqponmlkjihgfedcbaZYXWVUTSRQPONMLKJIHGFEDCBA
(ZSDN)
discussed
in Chapter 10 and the
B-ZSDN
of Chapter
25.
Customers’ communication needs can often be met in a number of alternative fashions,
ranging from travelling in person, using the postal service, the telephone, telex, packet
switching, and high speed data telecommunications services. Pitching a given service to
meet a given need is the job of telecommunications marketing specialists who determine
its relevant qualities, expressed as a number of measurable parameters. An example of
such a ‘quality parameter’, used commonly by telephone network operators is the
percentage of calls completed.
Not only is this a fair measure of network congestion, it is
also a good predictor
of
the level of customer frustration.
34.3
QUALITY
OF
SERVICE (QOS) AND
NETWORK PERFORMANCE (NP)
You may have realized in our example above that the percentage of answered calls is
dependent not only on network congestion, but also on the availability of somebody at
the destination end to answer the telephone. Thus the
quality of service
enjoyed by the
customer depends on a number of factors in addition to the performance of the net-
work. ITU-T has also drawn this distinction, and its general recommendations on the
quality of telecommunications services recognize two separate categories of perfor-
mance measurement zyxwvutsrqponmlkjihgfedcbaZYXWVUTSRQPONMLKJIHGFEDCBA
0
quality of service
(QOS)
0
network performance
(NP)
Quality of service
measurements help a telecommunications service or network pro-
vider to gauge customers’ perceptions of the service.
Network performance
parameters,
on the other hand, are direct measurements of the performance of the network, in
isolation from customer and terminating equipment effects. Thus
quality of service
encompasses a wider domain than
network performance,
so
that it is possible to have a
case of poor overall
quality of service
even though the
network performance
may be
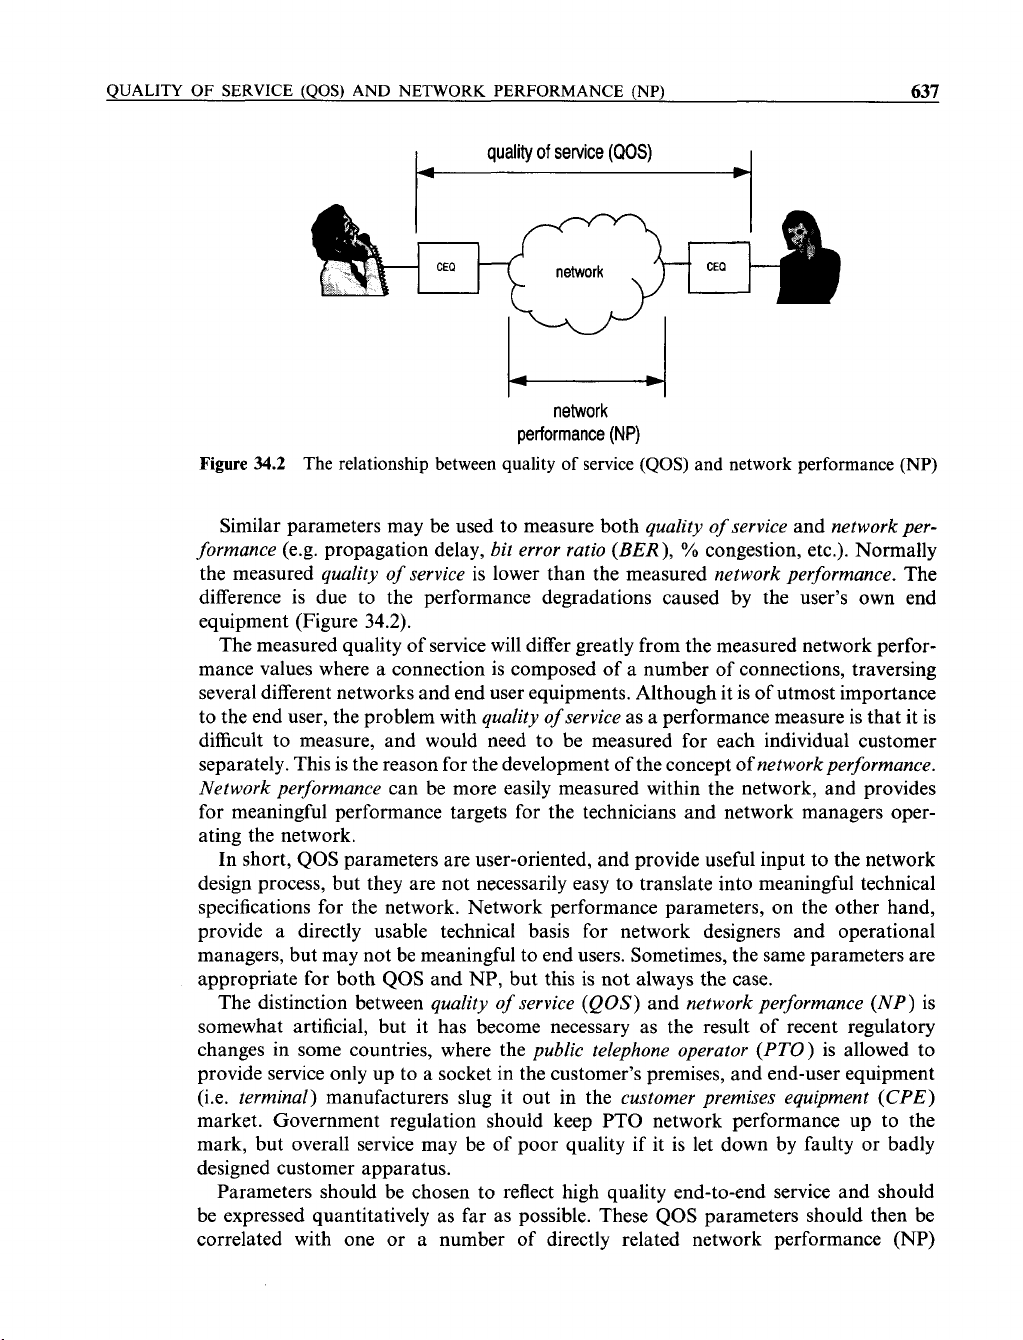
excellent. The relationship of
quality of service
to
network performance
is shown in
Figure
34.2.
QUALITY OF SERVICE (QOS) AND NETWORK PERFORMANCE (NP)
637 zyxwvutsrqponmlkjihgfedcbaZYXWVUTSRQPONMLKJIHGFEDCBA
quality zyxwvutsrqponmlkjihgfedcbaZYXWVUTSRQPONMLKJIHGFEDCBA
of
service zyxwvutsrqponmlkjihgfedcbaZYXWVUTSRQPONMLKJIHGFEDCBA
(QOS) zyxwvutsrqponmlkjihgfedcbaZYXWVUTSRQPONMLKJIHGFEDCBA
W
network
performance
(NP)
Figure
34.2 The relationship between quality of service zyxwvutsrqponmlkjihgfedcbaZYXWVUTSRQPONMLKJIHGFEDCBA
(QOS)
and network performance (NP)
Similar parameters may be used to measure both
quality zyxwvutsrqponmlkjihgfedcbaZYXWVUTSRQPONMLKJIHGFEDCBA
of
service
and
network per-
formance
(e.g. propagation delay,
bit error ratio
(BER),
%
congestion, etc.). Normally
the measured
quality
of
service
is lower than the measured
network performance.
The
difference is due to the performance degradations caused by the user’s own end
equipment (Figure
34.2).
The measured quality of service will differ greatly from the measured network perfor-
mance values where a connection is composed of a number of connections, traversing
several different networks and end user equipments. Although it is of utmost importance
to the end user, the problem with
quality
of
service
as a performance measure is that it is
difficult to measure, and would need to be measured for each individual customer
separately. This is the reason for the development of the concept of
networkperformance.
Network performance
can be more easily measured within the network, and provides
for meaningful performance targets for the technicians and network managers oper-
ating the network.
In short,
QOS
parameters are user-oriented, and provide useful input to the network
design process, but they are not necessarily easy to translate into meaningful technical
specifications for the network. Network performance parameters, on the other hand,
provide a directly usable technical basis for network designers and operational
managers, but may not be meaningful to end users. Sometimes, the same parameters are
appropriate for both
QOS
and NP, but this
is
not always the case.
The distinction between
quality
of
service
(QOS)
and
network performance
(NP)
is
somewhat artificial, but it has become necessary as the result of recent regulatory
changes in some countries, where the
public telephone operator
(PTO)
is allowed to
provide service only up to a socket in the customer’s premises, and end-user equipment
(i.e.
terminal)
manufacturers slug it out in the
customer premises equipment
(CPE)
market. Government regulation should keep PTO network performance up to the
mark, but overall service may be of poor quality if it is let down by faulty or badly
designed customer apparatus.
Parameters should be chosen to reflect high quality end-to-end service and should
be expressed quantitatively as far as possible. These
QOS
parameters should then be
correlated with one or a number of directly related network performance
(NP)
![Biến Tần FR-A700: Sổ Tay Hướng Dẫn Cơ Bản [Chi Tiết]](https://cdn.tailieu.vn/images/document/thumbnail/2019/20191130/cac1994/135x160/1741575103503.jpg)
![Xử lý số tín hiệu: Tài liệu thí nghiệm [Chuẩn SEO]](https://cdn.tailieu.vn/images/document/thumbnail/2018/20180821/danhvi27/135x160/7141534836177.jpg)


![Catalogue Insulators: [Thêm từ mô tả phù hợp với nội dung catalogue]](https://cdn.tailieu.vn/images/document/thumbnail/2015/20150608/sincos/135x160/6521433725774.jpg)


%20--%3e%3cdefs%3e%3cstyle%3e%20.st0%20{%20fill:%20%23fff;%20}%20.st1%20{%20fill:%20%237800fa;%20}%20%3c/style%3e%3c/defs%3e%3cpath%20class='st1'%20d='M117.78,12.18H43.11c2.9,3.47,4.65,7.94,4.65,12.82,0,5.6-2.3,10.66-6.01,14.29h76.02l7.22-13.56-7.22-13.56Z'/%3e%3cg%3e%3cpath%20class='st0'%20d='M53.58,26.17h-.59v-1.46h.59v-4.96h2.83c1.78,0,2.67.94,2.67,2.82v5.76c0,1.87-.89,2.81-2.67,2.81h-2.83v-4.96ZM55.36,21.37v3.34h1.1v1.46h-1.1v3.34h1.01c.61,0,.91-.37.91-1.1v-5.93c0-.74-.3-1.1-.91-1.1h-1.01Z'/%3e%3cpath%20class='st0'%20d='M65.99,31.14h-1.8l-.31-2.07h-2.19l-.31,2.07h-1.64l1.82-11.39h2.62l1.82,11.39ZM65.28,18.04c-.25.46-.51.77-.75.94-.21.15-.47.22-.79.22-.26,0-.57-.07-.92-.22l-.38-.15c-.14-.05-.26-.07-.37-.07-.3,0-.53.18-.71.54l-.91-.68c.25-.46.51-.77.75-.94.21-.14.48-.21.79-.21.26,0,.57.07.92.21l.38.15c.14.05.26.07.37.07.3,0,.53-.18.71-.54l.91.68ZM61.91,27.52h1.73l-.87-5.76-.87,5.76Z'/%3e%3cpath%20class='st0'%20d='M74.53,26.89v1.52c0,1.91-.89,2.86-2.67,2.86s-2.67-.95-2.67-2.86v-5.93c0-1.91.89-2.86,2.67-2.86s2.67.95,2.67,2.86v1.11h-1.69v-1.22c0-.75-.31-1.12-.93-1.12s-.93.37-.93,1.12v6.15c0,.74.31,1.11.93,1.11s.93-.37.93-1.11v-1.63h1.69Z'/%3e%3cpath%20class='st0'%20d='M81.4,31.14h-1.8l-.31-2.07h-2.19l-.31,2.07h-1.64l1.82-11.39h2.62l1.82,11.39ZM75.9,19.2l1.52-1.91h1.71l1.51,1.91h-1.61l-.76-.95-.75.95h-1.61ZM77.32,27.52h1.73l-.87-5.76-.87,5.76ZM83.1,15.99l-1.76,1.91h-1.26l1.17-1.91h1.86Z'/%3e%3cpath%20class='st0'%20d='M84.86,19.75c1.78,0,2.67.94,2.67,2.82v1.48c0,1.87-.89,2.81-2.67,2.81h-.85v4.28h-1.79v-11.39h2.64ZM84.01,21.37v3.86h.85c.58,0,.87-.36.87-1.08v-1.71c0-.71-.29-1.07-.87-1.07h-.85Z'/%3e%3cpath%20class='st0'%20d='M93.51,19.75c1.78,0,2.67.94,2.67,2.82v1.48c0,1.87-.89,2.81-2.67,2.81h-.85v4.28h-1.79v-11.39h2.64ZM92.66,21.37v3.86h.85c.58,0,.87-.36.87-1.08v-1.71c0-.71-.29-1.07-.87-1.07h-.85Z'/%3e%3cpath%20class='st0'%20d='M98.8,31.14h-1.79v-11.39h1.79v4.88h2.03v-4.88h1.83v11.39h-1.83v-4.88h-2.03v4.88Z'/%3e%3cpath%20class='st0'%20d='M105.36,24.55h2.46v1.62h-2.46v3.34h3.09v1.63h-4.88v-11.39h4.88v1.63h-3.09v3.18ZM108.17,17.29l-1.76,1.91h-1.26l1.17-1.91h1.86Z'/%3e%3cpath%20class='st0'%20d='M112.2,19.75c1.78,0,2.67.94,2.67,2.82v1.48c0,1.87-.89,2.81-2.67,2.81h-.85v4.28h-1.79v-11.39h2.64ZM111.35,21.37v3.86h.85c.58,0,.87-.36.87-1.08v-1.71c0-.71-.29-1.07-.87-1.07h-.85Z'/%3e%3c/g%3e%3ccircle%20class='st1'%20cx='25'%20cy='25'%20r='20'/%3e%3cpath%20class='st0'%20d='M32.78,19.27c2.92,0,4.43,2.55,5.28,5.33l.71,2.17c.14.38-.33.75-.71.75h-5.61c.19-.33.24-.71.09-1.08l-.75-2.45c-.43-1.32-.99-2.64-1.79-3.77.75-.57,1.65-.94,2.78-.94h0ZM25,18.38c3.25,0,4.9,2.78,5.89,5.89l.76,2.45c.14.42-.33.8-.8.8h-11.69c-.42,0-.94-.38-.8-.8l.75-2.45c.99-3.11,2.64-5.89,5.89-5.89h0ZM25,11.35c1.74,0,3.11,1.37,3.11,3.11s-1.37,3.11-3.11,3.11-3.11-1.41-3.11-3.11,1.41-3.11,3.11-3.11h0ZM17.27,19.27c1.08,0,1.98.38,2.73.94-.8,1.13-1.37,2.45-1.74,3.77l-.8,2.45c-.14.38-.05.75.09,1.08h-5.56c-.42,0-.9-.38-.75-.75l.71-2.17c.9-2.78,2.41-5.33,5.33-5.33h0ZM17.27,12.91c1.51,0,2.78,1.27,2.78,2.83s-1.27,2.83-2.78,2.83-2.83-1.27-2.83-2.83,1.27-2.83,2.83-2.83h0ZM32.78,12.91c1.56,0,2.78,1.27,2.78,2.83s-1.23,2.83-2.78,2.83-2.83-1.27-2.83-2.83,1.27-2.83,2.83-2.83h0ZM27.07,28.56v.09c0,.57-.24,1.08-.61,1.46h0v.05c-.38.33-.9.57-1.46.57s-1.08-.24-1.46-.61h0c-.38-.38-.61-.9-.61-1.46v-.09h1.41v.09c0,.19.05.38.19.47v.05c.09.09.28.19.47.19s.38-.09.47-.19v-.05c.14-.09.24-.28.24-.47t-.05-.09h1.41ZM30.99,28.56v.09c0,1.65-.66,3.16-1.74,4.24-1.08,1.08-2.59,1.79-4.24,1.79s-3.16-.71-4.24-1.79l-.05-.05c-1.04-1.08-1.7-2.55-1.7-4.2v-.09h1.41v.09c0,1.27.47,2.4,1.27,3.25h.05c.85.85,1.98,1.37,3.25,1.37s2.4-.52,3.25-1.37c.85-.8,1.37-1.98,1.37-3.25v-.09h1.37ZM34.99,28.56v.09c0,2.78-1.13,5.28-2.92,7.07-1.79,1.79-4.29,2.92-7.07,2.92s-5.23-1.13-7.07-2.92c-1.79-1.79-2.92-4.29-2.92-7.07v-.09h1.41v.09c0,2.4.94,4.53,2.5,6.08,1.56,1.56,3.72,2.5,6.08,2.5s4.52-.94,6.08-2.5c1.56-1.56,2.5-3.68,2.5-6.08v-.09h1.41Z'/%3e%3c/svg%3e)