
REGULAR ARTICLE
Modelling of as-fabricated porosity in UO
2
fuel by MFPR code
Vladimir I. Tarasov
*
and Mikhail S. Veshchunov
Nuclear Safety Institute (IBRAE), Russian Academy of Sciences, 52, B. Tulskaya, 115191, Moscow, Russia
Received: 3 October 2015 / Accepted: 16 February 2016
Published online: 15 April 2016
Abstract. For consistent modelling of behaviour of as-fabricated porosity in UO
2
fuel irradiated under various
conditions of in-pile and out-of-pile tests as well as under normal and abnormal conditions of nuclear reactor
operation, the additional analysis of experimental observations and critical assessment of available models are
presented. On this base, the mechanistic MFPR code, including physically-grounded models for the fuel porosity
evolution in UO
2
fuel under various irradiation and thermal regimes, is refined. These modifications complete the
consistent description of the fuel porosity evolution in the MFPR code and result in a notable improvement of the
code predictions.
1 Introduction
The in-pile dimensional behaviour of oxide fuels in nuclear
reactors is a well-known phenomenon of great technological
interest. It is generally established that at the beginning of
irradiation the fuel densifies due to shrinking of the as-
fabricated pores remaining from the fuel sintering process
with a wide distribution of their sizes [1,2]. The densifica-
tion is most pronounced in low density fuel, especially in the
case of fine-dispersed porosity with pores typically less than
one micron diameter.
Re-sintering in the furnace can be generally understood
and described analytically by thermal diffusion processes,
but not so in-pile densification: it was additionally assumed
by Stehle and Assmann [3] that in-pile densification is a
mixed athermal/thermal process, including the thermal
evaporation of vacancies from pores (which dominates at
relatively high temperatures above ≈1200 °C), and the
athermal atomization of pores into lattice vacancies by
fission spikes.
For consistent modelling of porosity behaviour in UO
2
fuel irradiated under various conditions of in-pile and out-
of-pile tests as well as under normal and abnormal
conditions of nuclear reactor operation, the critical
assessment of available models, their modification and
development of more advanced models for implementation
in the mechanistic codes, become rather an important task.
The code MFPR (Module for Fission Products Release) was
developed for analysis of fission products (FP) release from
irradiated UO
2
fuel in collaboration between IBRAE and
IRSN (Cadarache, France) [4,5]. The mechanistic approach
applied in this code allows the realistic consideration of fuel
porosity evolution, self-consistently with analysis of FP
release, based on physically-grounded parameters and
mechanisms.
Some important modifications of the existing models of
MFPR and development of new models for the fuel porosity
evolution in UO
2
fuel under various irradiation and thermal
regimes are presented in this paper.
2 Initial fuel porosity
Optical microscopy reveals that the majority of the internal
cavities are located on grain boundaries [6]; the pores are
generally non-spherical in shape. In the current analysis,
the pores are considered as intergranular lenticular voids
with the dihedral angle u=50°. Their volume, V, and
surface area, S, are [7]:
V¼4p
313
2cosuþ1
2cos3u
R3≡4p
3fVR3;
S¼4p1cosuðÞR2≡4pfSR2;ð1Þ
where the pore curvature radius, R, relates to the
experimentally measured median radius, r(which below
will be simply referenced to as ‘radius’) as:
rsinu
jR;ð2Þ
where j1:29 (see Appendix A of Ref. [8]).
* e-mail: tarasov@ibrae.ac.ru
EPJ Nuclear Sci. Technol. 2, 19 (2016)
©V.I. Tarasov and M.S. Veshchunov, published by EDP Sciences, 2016
DOI: 10.1051/epjn/2016013
Nuclear
Sciences
& Technologies
Available online at:
http://www.epj-n.org
This is an Open Access article distributed under the terms of the Creative Commons Attribution License (http://creativecommons.org/licenses/by/4.0),
which permits unrestricted use, distribution, and reproduction in any medium, provided the original work is properly cited.

In the typical fresh fuel, the pores sizes are distributed
within the interval 0.1–10 mm, their density distribution
function can be satisfactory approximated as [8]:
CrðÞ¼
C0
rer=r;ð3Þ
where C
0
is the total pore concentration and ris the mean
radius. The maximum contribution to the total porosity
makes pores with r¼3r.
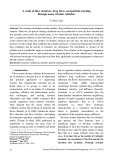
Figure 1 illustrates approximations of the experimental
distributions observed in reference [9] for normal grain (mean
grain diameter d
gr
=8mm) and large grain (23 mm) samples.
The normal grain data are approximated by equation (3)
with the mean radius of 0.35 mm and total porosity of 4.7%.
Note that pores with rfrom 0.5 to 2 mm contribute near 75%
to the total porosity. The large grain data are approximated
by a superposition of two exponents corresponding to two
pore populations, P1 and P2, with the mean radii of 0.45 and
3.0 mm, the partial porosities being 1.2 and 4.3% respectively.
3 Mechanisms of pore size relaxation
If the grain boundary self-diffusion is the rate controlling
mechanism of the thermal pore relaxation, the pore volume
change is described by the equation [10,11]:
d
dt V
therm ¼4pDgbwV
kT dPFSB ’ðÞ;ð4Þ
where D
gb
is the grain boundary diffusivity, w≈0.5 nm is
the thickness of the grain boundary layer, V= 4.09 10
–29
m
3
is the atomic volume, kis the Boltzmann constant, Tis
the temperature. The pressure difference, dP, is given by
equation:
dP¼NpkT
VNpB2g
RPh;ð5Þ
where N
p
is the number of gas atoms in the pore, P
h
is the
external pressure, Bis the van der Waals constant, ’is the
fractional coverage of the grain boundary by pores.
The factor F
SB
was derived in reference [10] for the
case of small identical pores uniformly distributed over an
infinitely large grain boundary, if the vacancy diffusion in
the grain boundary is rate controlling:
FSB ’ðÞ¼ln’þ1
21’ðÞ3’ðÞ
1
:ð6Þ
This function is of order of 1 for typical ’values of
10–20%, however it has logarithmic singularity at ’→0 and
cubic singularity at ’→1. Moreover, applicability of equation
(6) is unclear in the case of ensemble of different pores as well
as in the case of large pores, which size is comparable with
inter-pore distance or with grain face size. Therefore, for
simplification it was assumed in this paper that F
SB
=1.
As for the grain boundary diffusivity, considerable
uncertainty still exists in the literature. It was shown in
reference [8] that the best fit to the re-sintering data of
references [9]and[12] is provided by the Arrhenius correlation
for the diffusivity with parameters of Reynolds and Burton
[13]. For instance, simulations of the re-sintering conditions
(24 h at 1700 °C) in the Harada and Doi test resulted in the
density change of 1.15% for the normal grain and 0.175% for
the large grain samples (including reduction by 0.173% for
population P1 and 0.002% for P2), which should be compared
with the experimental values of 1.08% and 0.19% [9].
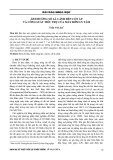
Dollins and Nichols [10], following Stehle and Assmann
[3], concluded that the thermal vacancy emission alone
is not sufficient to explain the healing of pores under
irradiation, especially at low temperatures. This is
illustrated in Figure 2 where the results are presented of
simulation of porosity evolution with equation (4) under
steady irradiation conditions in the Harada and Doi test
(the line denoted as ‘thermal’). In these calculations, the
mean pellet temperature was supposed to be equal to
1100 K, in accordance with reference [9].
100101102
Pore diameter (μm)
0.0
0.2
0.4
0.6
0.8
1.0
Porosity (%)
calc.
exp.
normal
grain
large
grain
Fig. 1. Initial pore size distributions in fuel samples of the Harada and Doi test [9] and their approximations.
2 V.I. Tarasov and M.S. Veshchunov: EPJ Nuclear Sci. Technol. 2, 19 (2016)

To overcome this difficulty, the irradiation-induced vacancy
knock-out mechanism was introduced in references [3,10]:
d
dt V
rad ¼8pfShlVGR2;ð7Þ
where his the number of vacancies that escape the pore per
each hit, l∼1mm is the “viable”track length of the fission
fragment, and Gis the fission rate. As for the key
parameter, h, the authors referenced the value of 600
deduced from the fuel sputtering experiments [14]; however,
they considered this value as the upper limit and set
h= 100. Note for comparison that in the subsequent
sputtering experiments [15] the value of h∼20 was
observed at typical stopping power of 20 keV/nm.
The above equation (7) has a trivial solution:
rt
ðÞ¼r0
ðÞ
vradt;ð8Þ
where vrad ¼2fSsinu=fVjðÞhlVG. With h= 100 and typi-
cal fission rate of 10
19
m
–3
s
–1
, this parameter equals to
≈10
–13
m/s, so that the pores with r<10 mm would
disappear during standard LWR campaign. With the
initial exponential pore size distribution, equation (3), the
total fuel porosity decays exponentially:
ptðÞ¼p0ðÞ 1þxþx2
2þx3
6
ex;ð9Þ
where x¼vradt=r. In particular, this equation predicts
decrease of the initial porosity in the typical LWR fuel by an
order of magnitude at burnup of 1 GWd/t, which is
considerably faster than the experimental observations.
Even if to decrease the parameter hdown to 20, the kinetics
of fuel densification remains strongly overestimated (the
curves ‘Dollins & Nichols’in Fig. 2).
In particular, equation (7) does not predict the
saturation of the densification process, which can be
explained considering that pores with the size greater than
some threshold value do not shrink, the threshold being
associated with the grain size [16]. Therefore, to take into
account this threshold effect, the cut-off of the irradiation
term was suggested in reference [8], which can be
implemented in equation (7) in the smoothed form:
d
dt V
rad ¼8pfShlVGR2max 0:12rpr
Ledge
;ð10Þ
where r
pr
is the pore projection radius and L
edge
≈0.69R
gr
is
the typical length of the grain edge
1
. With the choice h= 50,
this allows reasonably reproducing not only the experimen-
tal correlation [9] for the densification kinetics, Figure 2
(curve ‘modified’), but also the kinetics of the total fuel
density due to both pores and inter- and intragranular
fission gas bubbles, measured in references [17,18] and
presented in reference [9](Fig. 3).
4 Fission gas capture by pores
The initial number of gas atoms in pores per one grain can
be evaluated as:
N0¼p0
1p0
PsintVgr
kT sint
;ð11Þ
where p
0
is the initial porosity, T
sint
and P
sint
are the
temperature and pressure during fuel sintering. The total
number of gas atoms, N
rel
, released from one grain during
reactor campaign is equal to kbf
g
V
gr
, where k≈0.3 is the
010
20 30 40 50
Burnup (Gwd / t)
0
1
2
3
4
5
Fuel porosity (%)
Dollins & Nichols
η
= 20
η
= 100
modified
thermal
Fig. 2. Simulation of fuel porosity under irradiation in the
Harada and Doi test [9] with the thermal relaxation term, equation
(4), and different variants of the irradiation term, equation (7);
markers correspond to the experimental correlation [9], ‘modified’
corresponds to equation (10).
020 40 60
Burnup (Gwd / t)
93
94
95
96
97
98
Fuel density (%TD)
MFPR
experiment
[17, 18]
Fig. 3. Kinetics of the fuel density calculated by MFPR for
normal grain samples.
1
The relation between R
gr
and L
edge
is deduced equating the
volume of 9ffiffiffi
2
pL3
edge of the truncated octahedron, representing the
grain, to the volume of the equivalent sphere.
V.I. Tarasov and M.S. Veshchunov: EPJ Nuclear Sci. Technol. 2, 19 (2016) 3

fission gas yield per one fission, f
g
is the fractional release of
the gas atoms to the grain boundaries and bis the burnup
(number of fissions per unit volume). Therefore, one
evaluates that:
N0
Nrel ¼p0
1p0
Psint
kbfgkT sint
:ð12Þ
For the typical values T
sint
= 2000 K, P
sint
=10
5
Pa,
b=10
27
m
–3
and f
g
= 0.1, one evaluates this ratio as 0.6%
(whereas the ratio of N
0
to the total generated gas is an
order of magnitude less than this estimate).
The pores can capture the fission gas escaping from fuel
grains. The capture rate is estimated multiplying the pore
area, equation (1), by the gas flux density, F:
dNp
dt
cap ¼4pfSR2F;ð13Þ
where the gas flux density can be found as the time
derivative of the number of gas atoms released from the
grain per unit area of grain surface:
FtðÞ¼1
3kRgrfgtðÞbtðÞ:ð14Þ
In the case of constant fission rate, b(t)=Gt and thus:
FtðÞ¼d
dt FtðÞ¼1
3kRgrG~
fgtðÞ;ð15Þ
where ~
fgtðÞ≡fgtðÞþtf0gtðÞ. At the beginning of irradiation
fgtðÞ∼ffiffit
p,so~
fgtðÞ3fgtðÞ=2, whereas in the case of high
burnup ~
fgtðÞfgtðÞ.
On the other hand, the gas atoms can be knocked out
from pores by passing fission fragments (irradiation-
induced resolution). Following Nelson’s model [19], the
resolution rate for intergranular pores is estimated in
MFPR as [20]:
dNp
dt
res ¼b0GfS
fV
Np
1;Rl=2;
3l
4Rl3
16R3;R>l=2;
8
<
:ð16Þ
where b
0
is the resolution constant, lis the average distance
the ejected atom travels in pore, dis the width of the
resolution layer [19]. As explained in reference [21], the
original Nelson model is used for intergranular porosity
without modifications, suggested in reference [22] for
intragranular bubbles (in order to avoid duplication of
the backward flux of atoms, struck from pores, to the grain
boundary).
5 Qualitative analysis
At the beginning of irradiation, the pores are generally
under-compressed so that they tend to shrink due to both
thermal and irradiation mechanisms, equations (4) and
(10). As a result the internal gas pressure in pores increases
and eventually the pressure difference dP, equation (5),
approaches zero. Neglecting the van der Waals correction
(required for small bubbles with R<5mm), one derives the
relationship between the number of gas atoms in pore N
eq
and its curvature radius at equilibrium R
eq
:
Neq ¼4pfVR3
eq
3kT Phþ2g
Req
:ð17Þ
In the limiting cases one estimates the resolution term,
equation (16), as:
dNp
dt
res pfSb0lG
kT
2gReq;Req << 2g
Ph
;
PhR2
eq;Req >> 2g
Ph
:
8
>
<
>
:ð18Þ
Therefore, one gets estimates for the rhs of the complete
equation for N
p
in the equilibrium:
dNp
dt ¼dNp
dt
cap þdNp
dt
res
dNp
dt
cap
1R0
~
fgReq
;Req << 2g
Ph
;
1f0
~
fg
;Req >> 2g
Ph
;
8
>
>
>
<
>
>
>
:
ð19Þ
where R
0
, and f
0
are the constants depending on the model
parameters and external conditions:
R0≡3b0gl
2kRgrkT ;f0≡3b0lPh
4kRgrkT :ð20Þ
For the typical parameter values R
gr
=5mmand
T= 1100 K, one evaluates that R
0
≈7.6 mm, f
0
≈3.2. It
follows from these estimates for small pores (which quickly
equilibrate so that ~
fg<< 1) that dNp=dt <0, therefore
after equilibration small pores definitely lose the gas and
hence continue shrinking. The same conclusion can be
drawn for large equilibrated pores; however, with less
reliability in view of uncertainties of the resolution model
and the relevant parameters. Therefore, one expects that
pores of all sizes lose their gas after equilibration. The
opposite trend cannot be excluded under some extreme
conditions (high burnups at high temperature of the large
grain fuels). Note that these conclusions were drawn for the
equilibrated pores whereas the gas content in non-
equilibrium pores can be either reducing or growing.
6 Quantitative analysis
The above qualitative considerations are illustrated in
Figure 4 by MFPR numerical simulations of evolution of
pores with initial radii of 0.1, 1 and 10 mm (curves labelled
in the graph as 1, 2 and 3, respectively) under irradiation
conditions of the Harada and Doi test [9]: normal grain fuel
(d
gr
=8mm) with the initial porosity of 4.7% under
temperature of 1100 K, pressure of 3 MPa and fission rate
of 10
19
m
–3
s
–1
; the initial pore distribution was approxi-
mated by equation (3) with r¼0:35 mm.
4 V.I. Tarasov and M.S. Veshchunov: EPJ Nuclear Sci. Technol. 2, 19 (2016)

It is seen that the relatively small pores quickly
equilibrate, monotonically shrink and eventually disappear
(equilibration times are ∼610
5
,510
6
and 5 10
7
s
for pores with the initial radii of 0.1, 0.3 and 1 mm). The
large pores (≥3mm) are practically unchanged in their
sizes. The final fuel porosity averaged over the pore
ensemble turned out to be 2.8%.
As for the gas content, it monotonically decreases in
small pores (r0.5 mm in these calculations) because the
resolution mechanism dominates in the initial stage of
irradiation when the small pores effectively shrink, e.g. see
curve 1 in the right panel. For the larger pores, N
p
(t) can be
non-monotonic function, however it finally decreases (at
least after equilibration, see previous Sect. 5), e.g. curve 2.
The gas content in pores with r>1.2 mm increases to the
end of irradiation in comparison with the initial value;
however these pores remain under-pressurized (curve 3).
The maximum relative gas increase (∼37%) is attained in
pores with the initial radius of 2 mm. As for the overall gas
content in the pore ensemble, first it rapidly decreased by a
factor of ∼15 at burnup of ≈3 GWd/t and then slowly
increased; the gas content was near 80% of the initial value
to the end of the campaign (54 GWd/t); this change can be
estimated using equation (12) as ∼0.1% of the gas released
from the fuel grains.
To clarify the role of gas capture/resolution effects, the
calculations were repeated with fixed N
p
(dashed curves in
Fig. 4). It is seen on the left panel that the solid and dashed
curves are very close to each other except of the stage of quick
shrinking. However, at this stage the volumes of the pores are
much less in comparison with the initial values and hence do
not essentially contribute to the fuel porosity. As for the large
pores, their sizes are practically constant, so the two
approaches are close to each other too. In addition, the
contribution of the largest pores to the total porosity is
exponentially small (it can be evaluated by Eq. (9) with
x¼r=r). These qualitative considerations were confirmed
by our calculations which showed that the gas capture/
resolution effect influenced the final porosity by ≈0.01% only.
These calculations demonstrated that the pores cannot
be considered as effective traps of the fission gas released
from the nuclear fuel. In addition, it was justified that the
neglect of gas content variation in pores is a good
approximation in numerical calculations, as qualitatively
discussed in reference [8]. To check these conclusions, the
additional calculations have been performed with the same
initial pore distribution but varying one of the external
parameters: grain size, fission rate or irradiation tempera-
ture. In all these cases, the pore kinetics were found to be
qualitatively similar to that presented in Figure 4.
Simulations with the increased fission rate (5 10
19
m
–3
s
–1
) have shown that an increase of the overall gas
content (following a fast initial decrease by a factor of 8)
resulted in full compensation of the gas content in pores at
burnup of 75 GWd/t. These variations were within 0.1% of
the gas amount released from the grains, which is
comparable with the above considered cases. The gas
capture/resolution mechanisms were found to contribute to
the final fuel porosity (which was equal to 2.33%) very
similarly to the above examples. The greatest differences
were found in calculations with the increased temperature.
At T= 1500 K, the initial decrease of the gas content was
followed (at burnup of ≈1 GWd/t) by a slight increase,
which in turn followed again (at ≈4 GWd/t) by decrease up
to the end of the campaign; the final content was found to
be of 16% of the initial value. In addition, the simulations of
the fuel volume evolution (including both pores and fission
gas bubbles) under irradiation conditions of the Harada and
Doi test [9] were performed (Fig. 5). The following external
conditions were chosen: the mean irradiation temperature
1100 K, fission rate 10
19
m
–3
s
–1
, and external pressure
3 MPa. In the case of the large grain fuel, the realistic bi-
modal initial pore size distribution was simulated as
superposition of P1 and P2 populations, see Section 2.
It was found that the pore populations P1 and P2 lost
84% and 1.4% of their initial volume respectively so that the
total pore densification turned out to be of 1.07%. The final
fuel density change (at the burnup of 21 GWd/t) was
10
3
10
4
10
5
10
6
10
7
10
8
t (s)
10
2
10
4
10
6
10
8
10
10
N
p
10
3
10
4
10
5
10
6
10
7
10
8
t (s)
10
-9
10
-8
10
-7
10
-6
10
-5
ρ
(m)
1
1
2
2
33
Fig. 4. Time dependence of pore radii and gas atom content in pores under irradiation conditions of the test [9]; dashed lines correspond
to calculations with N
p
= const.
V.I. Tarasov and M.S. Veshchunov: EPJ Nuclear Sci. Technol. 2, 19 (2016) 5


![Đề ôn tập cuối kỳ môn Kỹ thuật nhiệt - Nhiệt động học [mới nhất]](https://cdn.tailieu.vn/images/document/thumbnail/2026/20260310/hoaphuong0906/135x160/60681773197823.jpg)

![Bài giảng thang máy và thang cuốn: Tổng hợp kiến thức [chuẩn nhất]](https://cdn.tailieu.vn/images/document/thumbnail/2026/20260310/hoaphuong0906/135x160/41471773283876.jpg)
