
Journal of Water Resources & Environmental Engineering - No. 87 (12/2023)
16
A study of flow structure, drag force, and particle tracking
through many circular cylinders
Vu Huy Cong
1
Abstract: The variation of multiple circular c
ylinders' drag coefficient was investigated using numerical
methods. Moreover, the particle tracking simulation was also performed to show the flow structure and
how particles move inside the cylinder array. It was found that the density and location of cy
linders
have a significant influence on the fluid forces, flow structure, and particle movement inside them.
The
results showed that when the number of cylinders increases per unit area, the total drag coefficient
increases but the average drag coefficient
per cylinder decreases. A functional relationship between the
drag coefficient and the density of cylinders was determined. The distribution or position of the
cylinders has a considerable impact on particle distribution. The cylinders in the staggered ar
rangement
disperse the particles more in a fan-
shaped manner, spreading them out in the cylinder array. The results
will advance knowledge of the drag force and flow field, particularly in matter propagation or dispersion
through systems of objects.
Keywords: Drag fore coefficient, cylinder, particle tracking, flow structure.
1. Introduction
*
Flow around circular cylinders has attracted a
lot of attention in the past due to its importance
and practical application in engineering
systems. The cylinder-like structures can be
found alone or in groups in water or air
environments, such as in studies of submerged
vegetation, offshore and infrastructure works,
heat exchangers, and cooling systems.
Ghisalberti and Nepf (2004) simulated flow
around vegetation using cylinder structures.
They reported that the vortex behind the
cylinders controls the exchange of nutrients and
larvae. Bennett, et al. (2002) studied the stream
flow direction and flow structure surrounding
the emergent vegetation, simplified as a cylinder
model. (Tanino & Nepf, 2008) performed an
experiment to examine the drag force of
vegetation using an array of cylinders and found
1
Faculty of Water Resources Engineering, The University
of Danang- University of Science and Technology
Email: vhcong@dut.udn.vn
Received 17
th
Aug. 2023
Accepted 1
st
Sep. 2023
Available online 31
st
Dec. 2023
that as vegetation density increases, the average
drag coefficient of each cylinder decreases. The
cylinders' drag coefficient, which directly
influences the flow's characteristics, is a crucial
component. Nepf (1999) demonstrated
connections between cylinder drag coefficient,
turbulence intensity, and diffusion. Recently,
Yamasaki, et al. (2021) examined how the
hydrodynamic interaction between neighboring
patches of model vegetation (circular cylinder)
impacted deposition. Han et al. (2023)
researched on water flow resistance
characteristics in a vegetation environment,
which is primarily concentrated on the
calculation of the vegetation drag coefficient.
Previous studies indicated that the cylinders'
gap spacing and flow direction have a
significant impact on the drag coefficient.
Depending on how the cylinders are organized,
the drag on two could be either smaller or larger
than that of a single cylinder when they are
close. It is clear that as the number of cylinders
increases, the complexity of the flow around the
cylinders also increases. Although multiple

Journal of Water Resources & Environmental Engineering - No. 87 (12/2023)
17
cylinders are often observed in practice, the
complexity of flow structures and the drag
coefficient have prevented detailed research. It
is difficult to determine whether the drag
coefficient of a cylinder is increased or
decreased due to a large number of
characteristics, such as geometric parameters
related to cylinder position, which may result in
multiple interferences. Studies on the drag
coefficient of cylinder arrays are currently
scarce, and most of them are experiments (Zong
& Nepf 2011). Nowadays, numerical models are
commonly used to study the flow around one or
more cylinders. Numerical models are
especially beneficial for simulating different
scenarios and reducing experimental costs
dramatically. There are popular methods in
numerical modeling for cylinders, such as the
finite element method (FEM) (Kumar & Mittal,
2006), the finite volume method (FVM) (Jiang
& Cheng, 2021), the finite difference method
(FDM) (Parnaudeau, et al. 2008), or other
methods, such as the Lattice Boltzmann method
(Grucelski & Pozorski, 2013). This study
investigates the average drag coefficient of a
cylinder array with regard to cylinder density
using FVM. Additionally, the impact of the
cylinders' distribution type on particle
dispersion will be investigated.
2. Numerical methods
2.1. The particle tracking in CFD model
A computational fluid dynamic program
(CFD) with an FVM approach is used in this
study. The drag force and flow structures are
simulated in hydraulic mode. Furthermore, the
Discrete Phase Model is used to track the
motion of discrete particles. The equation is
provided below.
p
p
D
du
F u u
dt
(1)
The inertial force per unit mass (m s
-2
) is
shown on the left-hand side of Eq. (4), where
p
u
is the particle velocity vector. The drag term,
where F
D
is the inverse of relaxation time (s
-1
),
is found on the right-hand side of the equation.
The drag force follows Stokes’ drag law:
2
18
drag p p
D
p p c
F F u u u u
d C
(2)
where
, d
p
are the dynamic viscosity and the
particle diameter, respectively. The Stokes' drag
law Cunningham correction is denoted by the
factor C
c
. These forces' detailed descriptions are
available in document material.
In the simulation, the following assumptions
are made concerning particle motion analysis:
(1) Every particle is a sphere with the same
density
p
and identical diameter d
p
; (2)
The one-way coupling is taken into account,
and the return effects of particle-to-carrier flow
are neglected; (3) Interactions between particles
are neglected.
2.2. Fluid force
Drag coefficient (C
D
) is the dimensionless
variable associated with fluid force. It should be
noted that the pressure and skin friction
components, which are described in Eq. (3), are
added to obtain the drag force.
2 2
0 0
cos sin
D w
F R p d R d
(3)
where F
D
is the drag force acting on the
cylinder, R (=D/2) is the cylinder's radius,
w
is
the local wall shear stress, θ is the angular
displacement from the front stagnation point.
The drag force coefficient of single cylinder
can be determined from its original definition.
2 2
2 2
0 0
2 1 1
cos sin
2
D
Di p w
o o
F
C C d d
U D U
(4)
We define the total drag coefficient of
multiple cylinders, C
D_total
as follow:
_
1
n
D total Di
i
C C
(5)
The average drag coefficient C
D_av
is defines
as follows:
Journal of Water Resources & Environmental Engineering - No. 87 (12/2023)
18
1
_
n
Di
i
D av
C
C
n
(6)
where n is number of cylinders.
2.3. Numerical setup
2.3.1. Case of single cylinder and validation
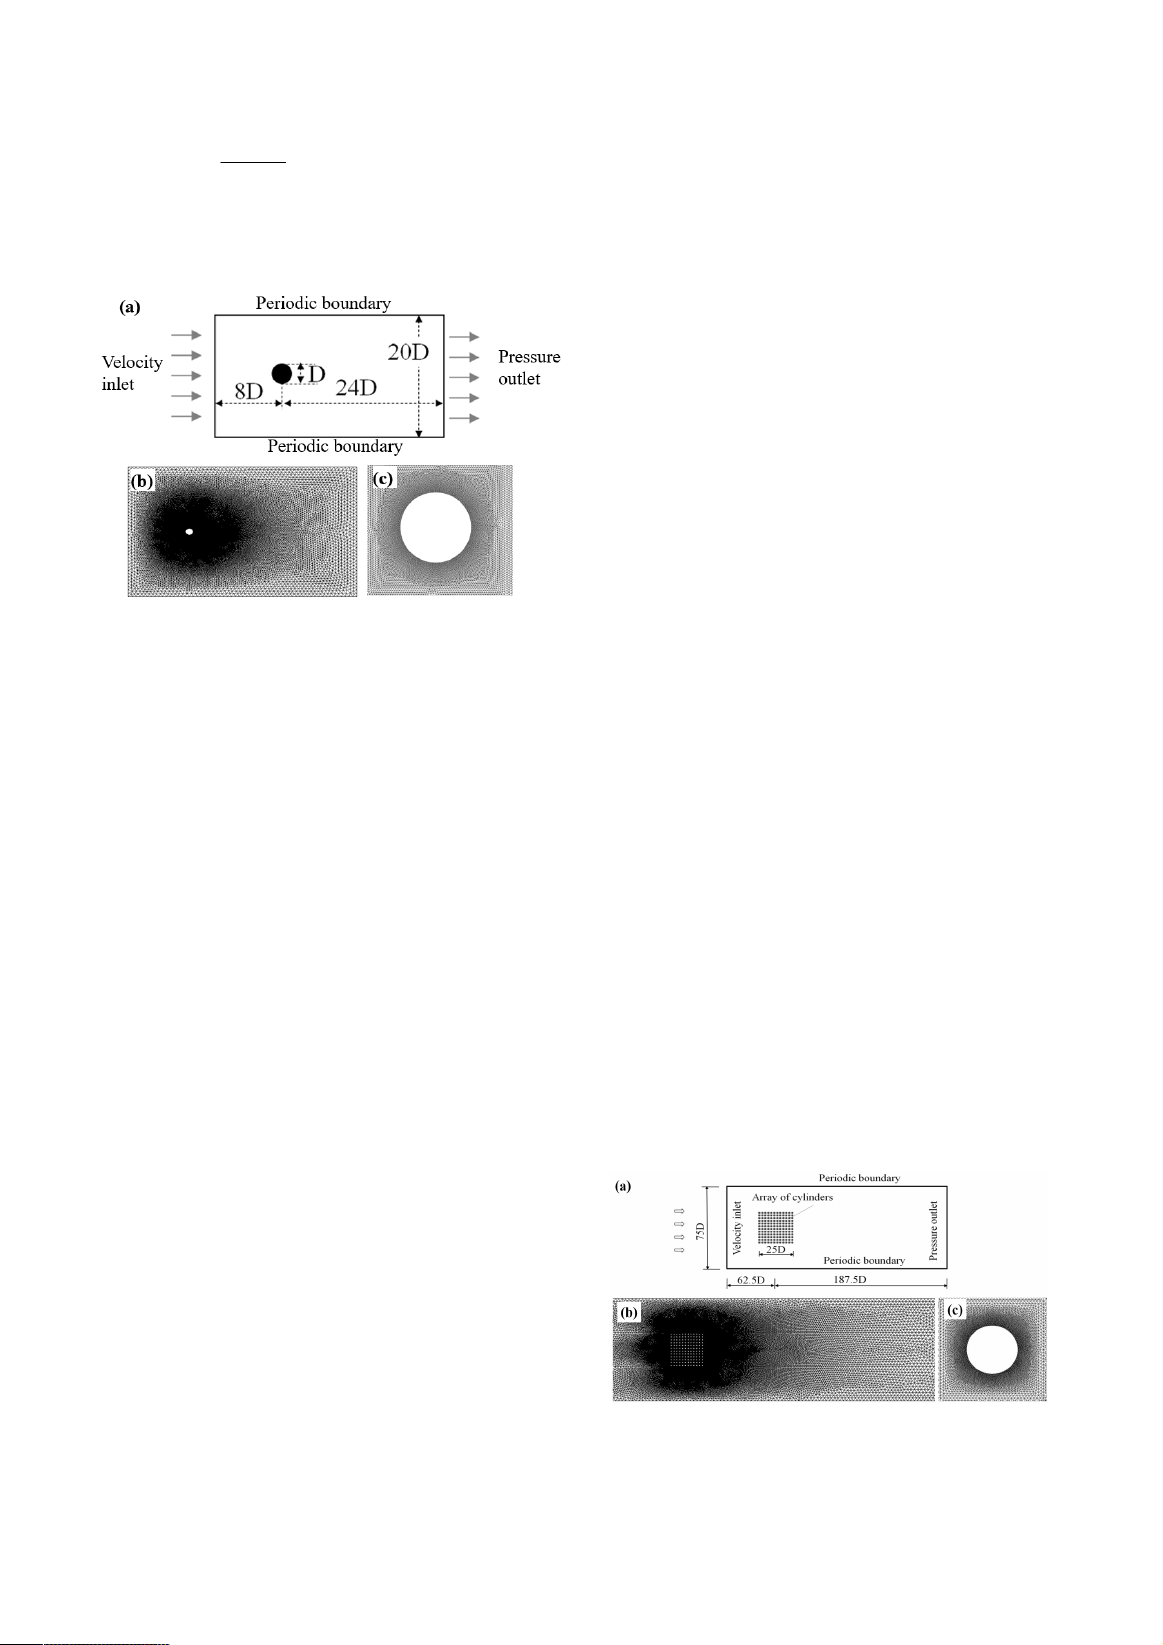
Figure 1. Computational domain and meshing
for the case of single cylinder
The case of a circular cylinder is simulated first
to test the model. Figure 1a shows schematic
diagrams of the computational domains for this
case. The computational domains were meshed
with triangle grid systems. Finer cells were used
near the cylinder surface, whereas coarser cells
were adopted near the wall boundary (Figure 1b).
Figure 1c shows details of the grid around the
cylinder. The test for the grid independence of the
flows around a single cylinder was performed
with three mesh resolutions. The numbers of grid
cells employed around the circumference of the
cylinder were 160, 240, and 320. The total grid
cells for the computational domain are 89090,
95636, and 104498, respectively. The Reynolds
number was set at 200 for this test.
The semi-implicit pressurelinked equations
(SIMPLE) approach is used to deal with the
pressure-velocity coupling in the numerical
setup. A second order upwind technique is used
to discretize the convective terms. A shear
Stress Transport (SST) k-omega model is used
to simulate the turbulent flow. This may be
attributed to the improvement of SST k-omega
compared with k-epsilon models in predicting
flow separation under adverse pressure
gradients (Vu, et al. 2015). Separation is an
important behavior of flow when it passes
through a circular cylinder.
For validation of the grid independence, the
drag coefficients of a single cylinder was
simulated for Re=200. Corresponding to the
number of grid cells around the cylinder of 160,
240, and 320, the coefficients C
D
obtained are
1.37, 1.33, and 1.307 respectively. The drag
coefficients found above show good agreement
with previous studies, for example, (Lam et al.
(2008) with C
D
=1.32; Ding, et al. (2007) with C
D
=
1.348±0.05; Meneghini, et al. (2001) with C
D
=1.3.
From the above results, it can be seen that all three
cases above have similar results for C
D
. The size
of such cells is to ensure that the properties of the
flow around the cylinder can be simulated. The
case of 240 grid cells around the cylinder is
selected to set up other simulations.
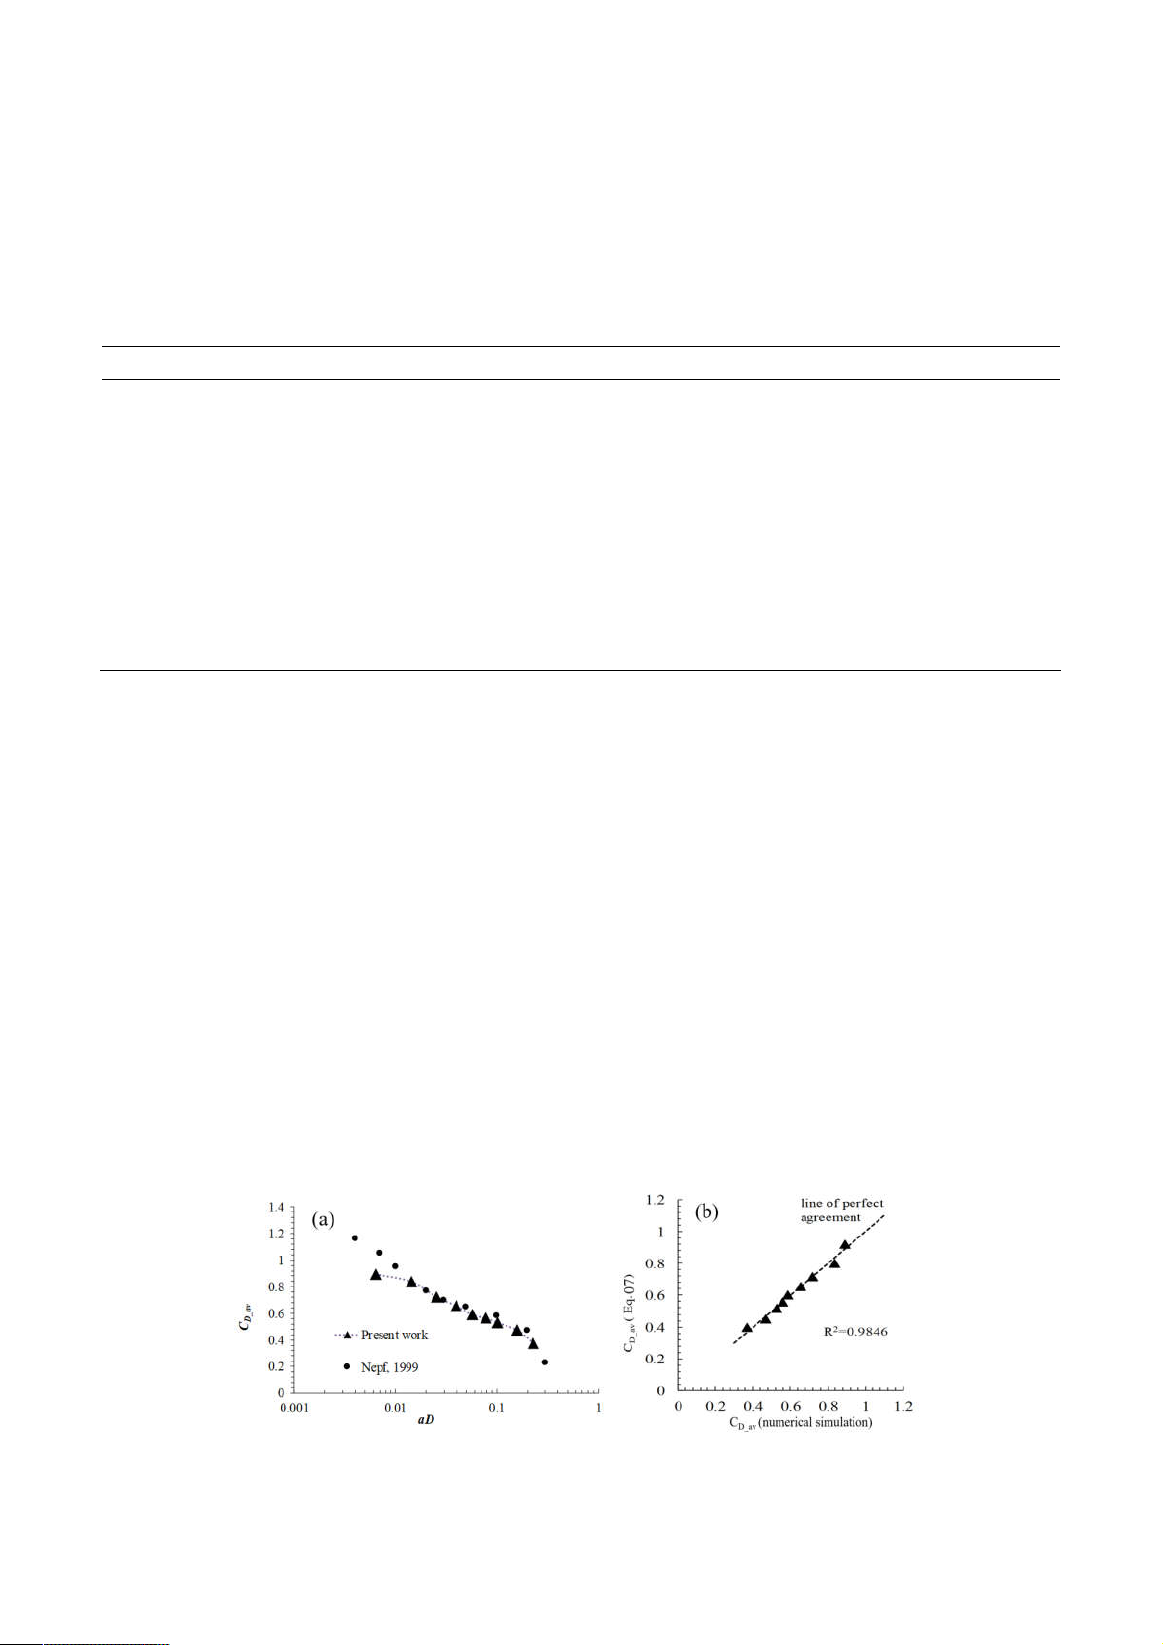
2.3.2. Case of multiple cylinders
The computational domain and boundary
conditions for an array of cylinders were the
same as those of a single cylinder case (Figure
2a). The size of the cylinder is also the same as
in the previous case. The array of cylinders is
located in the middle of the channel, with
dimensions of 25D×25D. The meshing method
is done in the same way as above. There are
approximately 1946760 grid cells in the domain
as a whole. A detail of the mesh along a
cylinder wall is shown in Figure 2c.
Figure 2. Computational domain meshing
for the case of multiple cylinders
Journal of Water Resources & Environmental Engineering - No. 87 (12/2023)
19
The simulated cylinders are located in a
square area 25D×25D (1m
2
). In order to
change the density of cylinders, the
number of cylinders per area varies from 4
to 144.
3. Results
3.1. Drag force
The drag force of cylinders is shown in Table
1. It was found that this drag force is strongly
governed by the number of cylinders. The total
drag coefficient (C
D_total
) increases as the
density increases.
Table 1. The drag force coefficient
Case Number of cylinders aD C
D_total
C
D_av
1 4 0.0064 3.5732 0.8933
2 9 0.0144 7.5519 0.8391
3 16 0.0256 11.5344 0.7209
4 25 0.04 16.385 0.6554
5 36 0.0576 21.15 0.5875
6 49 0.0784 27.6213 0.5637
7 64 0.1024 33.7984 0.5281
8 100 0.16 47.23 0.4723
9 144 0.2304 53.64 0.3725
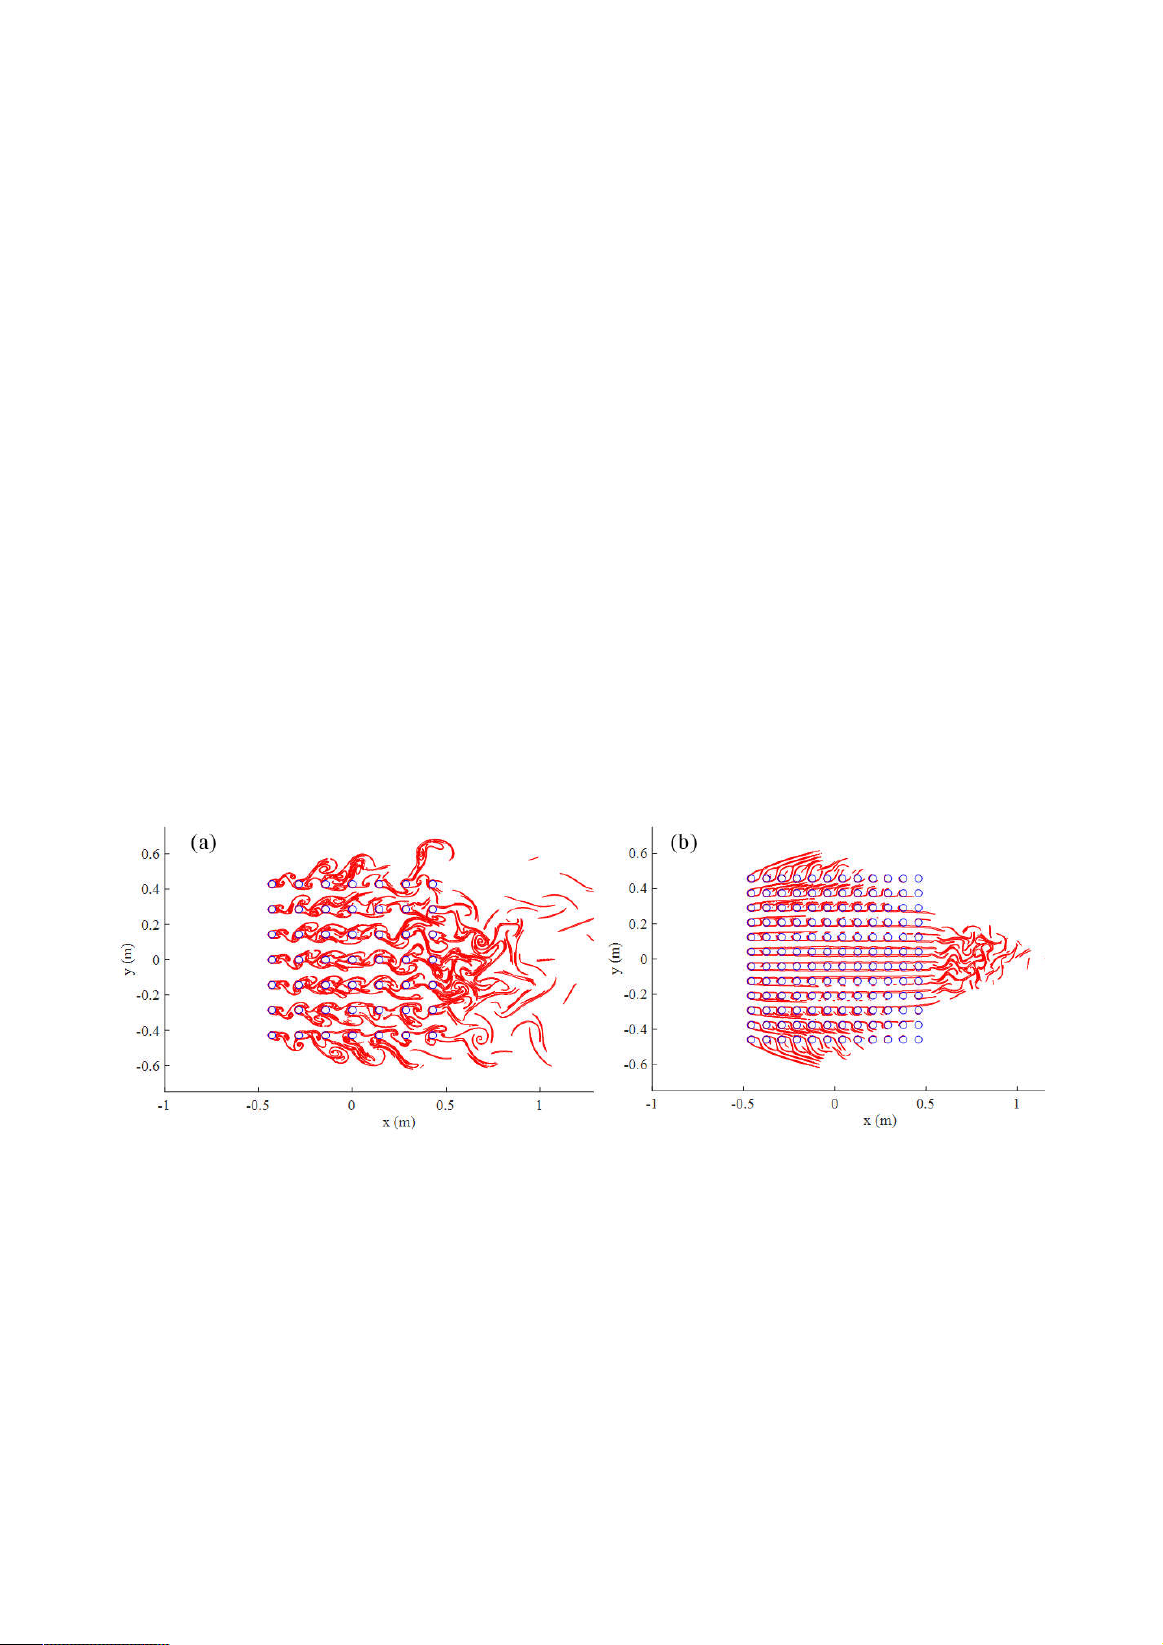
Figure 3a presents the results, C
D_av
, for an
array of multiple cylinders. In this case, the
density parameter is aD, which was proposed by
(Nepf, 1999), where a = nD, n is the number of
cylinders in the array. The Rennolds coefficient
in this simulation is 200, similar to the
experiment of (Nepf, 1999). The shapes of the
cylinders are also circular. It can be seen that
C
D_av
gradually decreases as the density of the
cylinder increases. This average drag coefficient
was found to be in good agreement with
previous experiment results (Nepf, 1999).
The functional relationship between C
D_av
and aD was proposed to determine C
D_av
:
C
D_av
= -0.145ln(aD) + 0.1872 (0.005 < aD < 0.2) (7)
This equation was found by fitting the data
shown in Figure 3b to predict the value of C
D_av
in
the studied density range. Prediction with Eq. (7)
gives a correlation coefficient of 0.985. It can be
seen that a very high degree of agreement was
found between C
D_av
obtained from Eq. (7) and the
numerical result. In other words, the average drag
coefficient can be easily evaluated with Eq. (07).
Figure 3. The average drag coefficient (a) compare to Nepf, 1999; (b) compare to Eq. (7)
Journal of Water Resources & Environmental Engineering - No. 87 (12/2023)
20
Increasing the density of the cylinders causes a
reduction in the average drag coefficient.
Returning to the study of cylinder interaction (Vu,
et al., 2015) will help us understand this
relationship. The author pointed out that the wake
of an upstream cylinder can suppress the drag
coefficient on the downstream cylinder. This
effect increases as the longitudinal spacing
between cylinders decreases, and it results from
two properties of the wake. First, the downstream
cylinder experiences a lower impact velocity due
to the velocity reduction in the vortex wake.
Second, the downstream cylinder is also located in
a low-pressure area caused by the upstream
cylinder. Both of these vortex wake characteristics
contribute to a decrease in the drag on the
downstream cylinders. Based on the observation
of two cylinders, it is expected that the average
drag coefficient for multiple cylinders will
decrease as the element spacing decreases or the
density of the cylinder array increases.
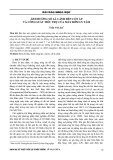
Lagrangian Coherent Structure (LCS) (Vũ,
2017) was employed as a technique to
investigate the flow structure around cylinders
in more detail. Figures 4 (a) and (b) present the
structure of vortex wake behind cylinders using
the LCS technique, with the number of
cylinders being 49 and 144, respectively. Each
vortex-shedding location, as well as the lines
connecting them, is depicted in detail. The gaps
between the cylinders in Figure 4(a) are
sufficiently wide for vortex shedding to take
place. In other words, because the downstream
cylinder is outside the upstream cylinders'
vortex wake, the drag coefficient is not
decreased as much. As the density rises,
however, as shown in Figure 4(b), the wake
from the upstream one entirely covers the
downstream one or reattaches to the
downstream one. Since the downstream ones are
now in lower velocity and pressure regions, the
drag coefficient is significantly reduced.
Figure 4. The effect of distance between cylinders on flow structure,
(a) 49 cylinders, (b) 144 cylinders
3.2. Flow structure
Figure 5 shows the variance in flow structure
with regard to the cylinder arrangement. The
placement of the cylinders in the array has a
significant impact on the flow characteristics.
The flow is mostly concentrated in the
horizontal gap between the cylinders
for uniform distribution. The velocity in this gap
is roughly twice as high as the velocity at the
upstream array. The velocity sharply drops
down directly behind the cylinders or at the
vertical gap. The flow is deflected away from
the array at its lateral borders, where vortexes
are created (see Figure 5c).


![Giáo trình Cấu trúc dữ liệu và giải thuật - Trường CĐ Cơ điện Hà Nội [Mới nhất]](https://cdn.tailieu.vn/images/document/thumbnail/2026/20260323/lionelmessi01/135x160/58171774381670.jpg)


![Giáo trình Tiện nâng cao (Nghề Cắt gọt kim loại, Trình độ Cao đẳng) - Trường Cao đẳng Cơ điện Hà Nội [Mới nhất]](https://cdn.tailieu.vn/images/document/thumbnail/2026/20260323/lionelmessi01/135x160/48101774403543.jpg)


