
REGULAR ARTICLE
Multiobjective optimization for nuclear fleet evolution scenarios
using COSI
David Freynet
1*
, Christine Coquelet-Pascal
1
, Romain Eschbach
1
, Guillaume Krivtchik
1
, and Elsa Merle-Lucotte
2
1
CEA, DEN, Cadarache, DER, SPRC, LECy, 13108 Saint-Paul-lez-Durance, France
2
LPSC-IN2P3-CNRS, UJF, Grenoble INP, 53 rue des Martyrs, 38026 Grenoble, France
Received: 5 October 2015 / Accepted: 17 December 2015
Published online: 4 March 2016
Abstract. The consequences of various fleet evolution options on material inventories and flux in fuel cycle and
waste can be analysed by means of transition scenario studies. The COSI code is currently simulating
chronologically scenarios whose parameters are fully defined by the user and is coupled with the CESAR depletion
code. As the interactions among reactors and fuel cycle facilities can be complex, and the ways in which they may
be configured are many, the development of optimization methodology could improve scenario studies. The
optimization problem definition needs to list: (i) criteria (e.g. saving natural resources and minimizing waste
production); (ii) variables (scenario parameters) related to reprocessing, reactor operation, installed power
distribution, etc.; (iii) constraints making scenarios industrially feasible. The large number of scenario
calculations needed to solve an optimization problem can be time-consuming and hardly achievable; therefore, it
requires the shortening of the COSI computation time. Given that CESAR depletion calculations represent about
95% of this computation time, CESAR surrogate models have been developed and coupled with COSI. Different
regression models are compared to estimate CESAR outputs: first- and second-order polynomial regressions,
Gaussian process and artificial neural network. This paper is about a first optimization study of a transition
scenario from the current French nuclear fleet to a Sodium Fast Reactors fleet as defined in the frame of the 2006
French Act for waste management. The present article deals with obtaining the optimal scenarios and validating
the methodology implemented, i.e. the coupling between the simulation software COSI, depletion surrogate
models and a genetic algorithm optimization method.
1 Introduction
1.1 Transition scenario studies
Nuclear systems composed of reactors with varied fuels and
cycle facilities (enrichment, fabrication and reprocessing
plants, interim and waste storages) are complex and in
constant evolution. Transition scenario studies assist
decision makers in listing the strengths and weaknesses
of different strategies for a nuclear fleet evolution. These
studies involve the tracking of the batches of materials and
the evaluation of their depletion in the fuel cycle over a
defined period.
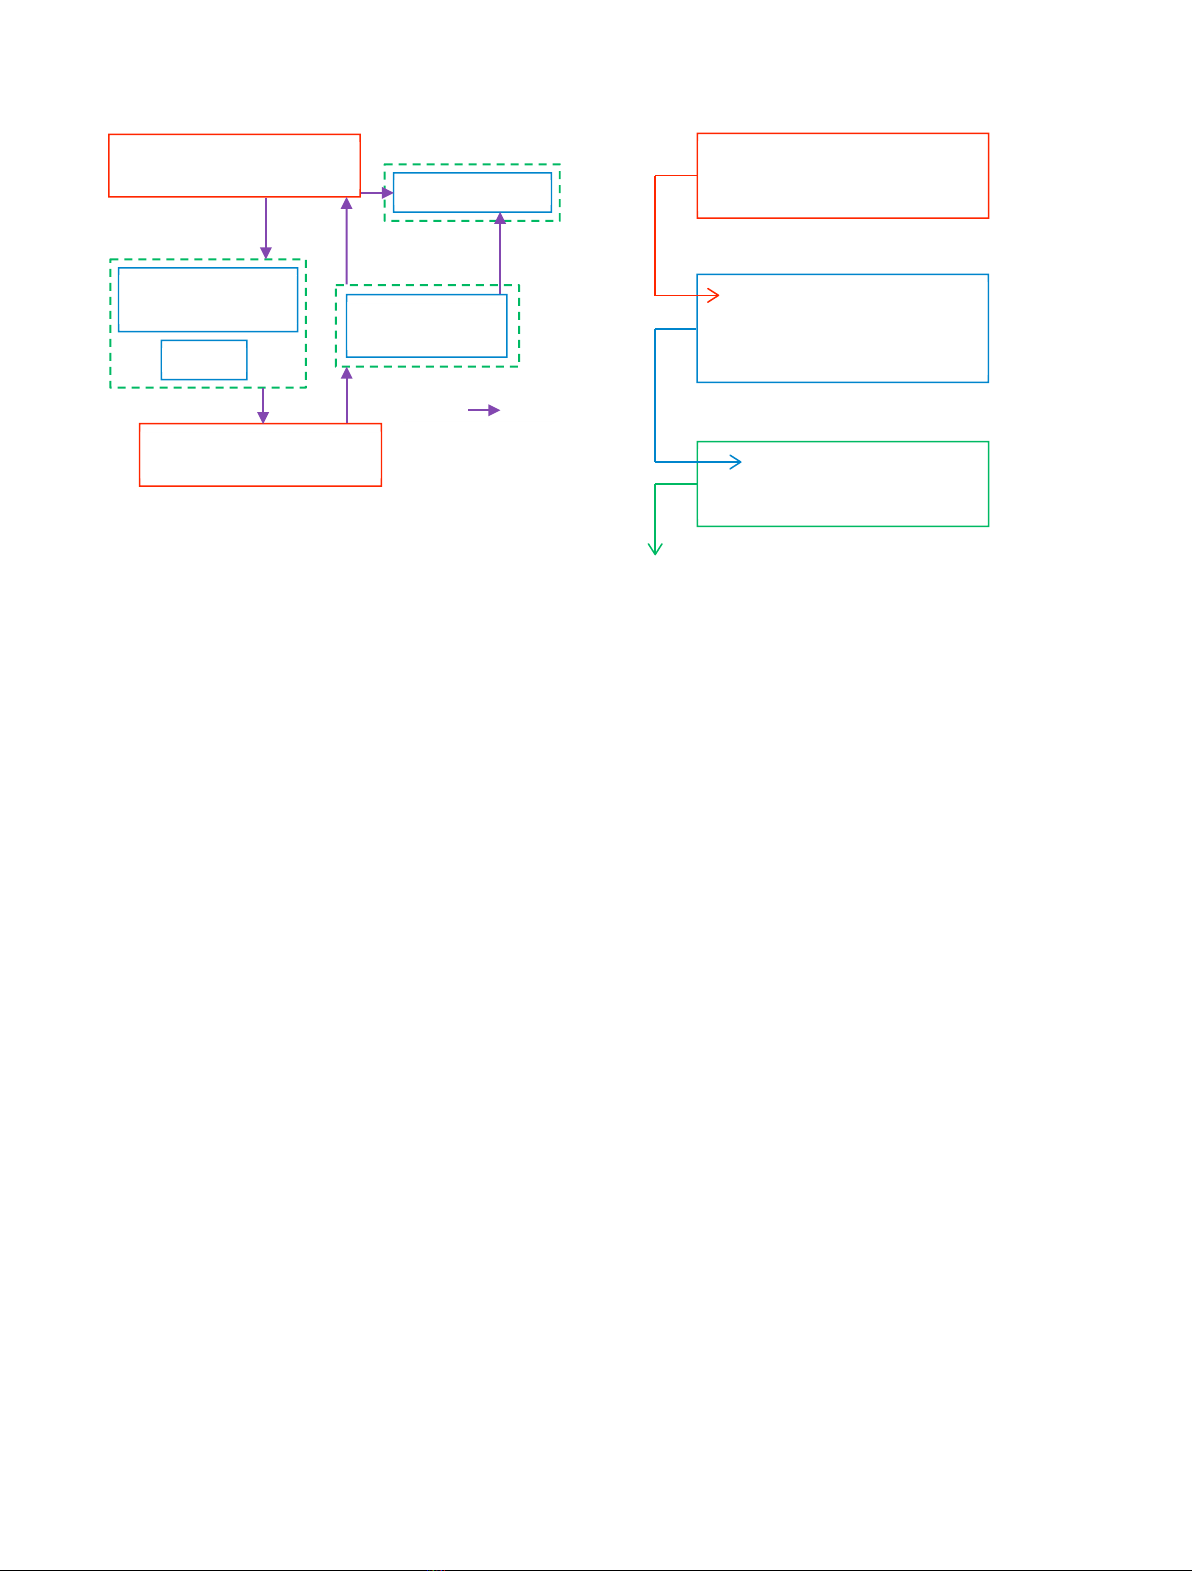
COSI is a code developed by the CEA’s Nuclear Energy
Division and used to simulate the evolution of a nuclear
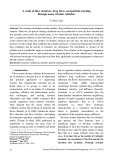
reactor fleet and the associated fuel cycle facilities [1]. COSI
takes as input parameters fuel cycle facilities and reactors
features, fuel types characteristics and succession of
loadings. Front-end, back-end and waste paths define
relations between these facilities as shown in Figure 1.It
should be noted that reactors are defined by commissioning
and shutdown dates, and reprocessing plants are defined by
these dates, reprocessing capacities and strategy features.
COSI provides outputs about the isotopic masses in the fuel
cycle facilities and reactors over a defined period. Post
processing calculations give access to physical quantities of
interest: activity, radiotoxicity, decay heat, etc.
COSI is coupled with the CESAR depletion code,
developed by the CEA’s Nuclear Energy Division and
AREVA, which performs every depletion (irradiation and
cooling) calculation during the scenario simulation [2].
CESAR is the reference code used at La Hague reprocessing
plant. Using CESAR requires one-group cross-sections
libraries linked to fuel types loaded in the reactors. The
production of these libraries requires neutronic calculations
(APOLLO and ERANOS) and is separated from the
depletion calculations. COSI coupled with the CESAR5.3
version is tracking 109 heavy nuclides (Tl→Cf) and 212
fission products (Zn→Ho).
* e-mail: david.freynet@cea.fr.
EPJ Nuclear Sci. Technol. 2, 9 (2016)
©D. Freynet et al., published by EDP Sciences, 2016
DOI: 10.1051/epjn/e2015-50066-7
Nuclear
Sciences
& Technologies
Available online at:
http://www.epj-n.org
This is an Open Access article distributed under the terms of the Creative Commons Attribution License (http://creativecommons.org/licenses/by/4.0),
which permits unrestricted use, distribution, and reproduction in any medium, provided the original work is properly cited.
1.2 Multiobjective optimization
COSI is currently simulating chronologically scenarios
whose parameters are fully defined by the user. The aim of
this paper is to define a methodology for the automatic
search of scenarios which are adapted to a strategic
problem. Indeed the future French nuclear fleet should meet
numerous and often conflicting criteria for different
stakeholders such as saving natural resources and minimiz-
ing nuclear waste production. Such criteria have to be
minimized or maximized according to some scenario
parameters (COSI inputs).
Solving an optimization problem requires a large
number of scenario calculations, which could be time-
consuming and hardly achievable. Indeed this time can vary
from a few minutes to a few hours according to the scenario
assumptions and the number of isotopes tracked. Because
CESAR calculations represent approximately 95% of the
COSI computation time, depletion simplified models have
been introduced to shorten depletion calculations during
the scenario computation. Consequently, CESAR-based
irradiation surrogate models are developed using the
sensitivity and uncertainty platform URANIE developed
by the CEA’s Nuclear Energy Division [3].
Because of the large numbers of scenario parameters
and criteria available to define an optimization problem, we
opt to use metaheuristics as optimization methods. The
URANIE’s genetic algorithm (GA) is considered for the
present optimization studies. Therefore, URANIE is used
both for the surrogate models development and the
optimization studies.
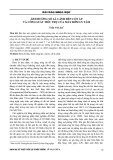
The methodology for performing multiobjective opti-
mization using COSI is represented in Figure 2.
The development of CESAR surrogate models is
discussed in Section 2. Then the COSI sped up version
using these simplified models is validated by comparing its
results to COSI, this study is also presented in Section 2.
Finally, an application of this methodology for the
optimization of a transition scenario from the current
Pressurized Water Reactors (PWR) French nuclear fleet to
afleet of Sodium Fast Reactors (SFR) is presented in
Section 3.
Other works address similar optimization problems
using different simulation software such as VISION and
CAFCA codes [4,5].
2 Irradiation surrogate models
2.1 Methodology
As seen previously, multiobjective optimization studies
require the shortening of the COSI computation time and so
the CESAR one. A way to gain time at cost to a satisfactory
estimation error is developing CESAR surrogate models.
These models can replace CESAR for irradiation calcu-
lations throughout the COSI computation and so have the
same inputs and outputs as CESAR.
CESAR input parameters define the fuel assembly
composition and irradiation features:
–the fresh fuel assembly isotopic composition defines the
isotope (denoted i) mass fractions in the fuel noted
yi¼mi=mfuel Piyi¼1
;
–the burnup to achieve noted BU in MWd/tHM;
–the irradiation time noted Dtin days.
Thereafter, let x¼∀iy
i;BU;Dt
fg
be the N-terms
vector of CESAR input parameters.
CESAR outputs are the results of depletion calculation,
i.e. the spent fuel isotopic composition. These outputs are
calculated as final concentrations noted C
j
(x) where j
denotes spent fuel isotopes in atoms/ton.
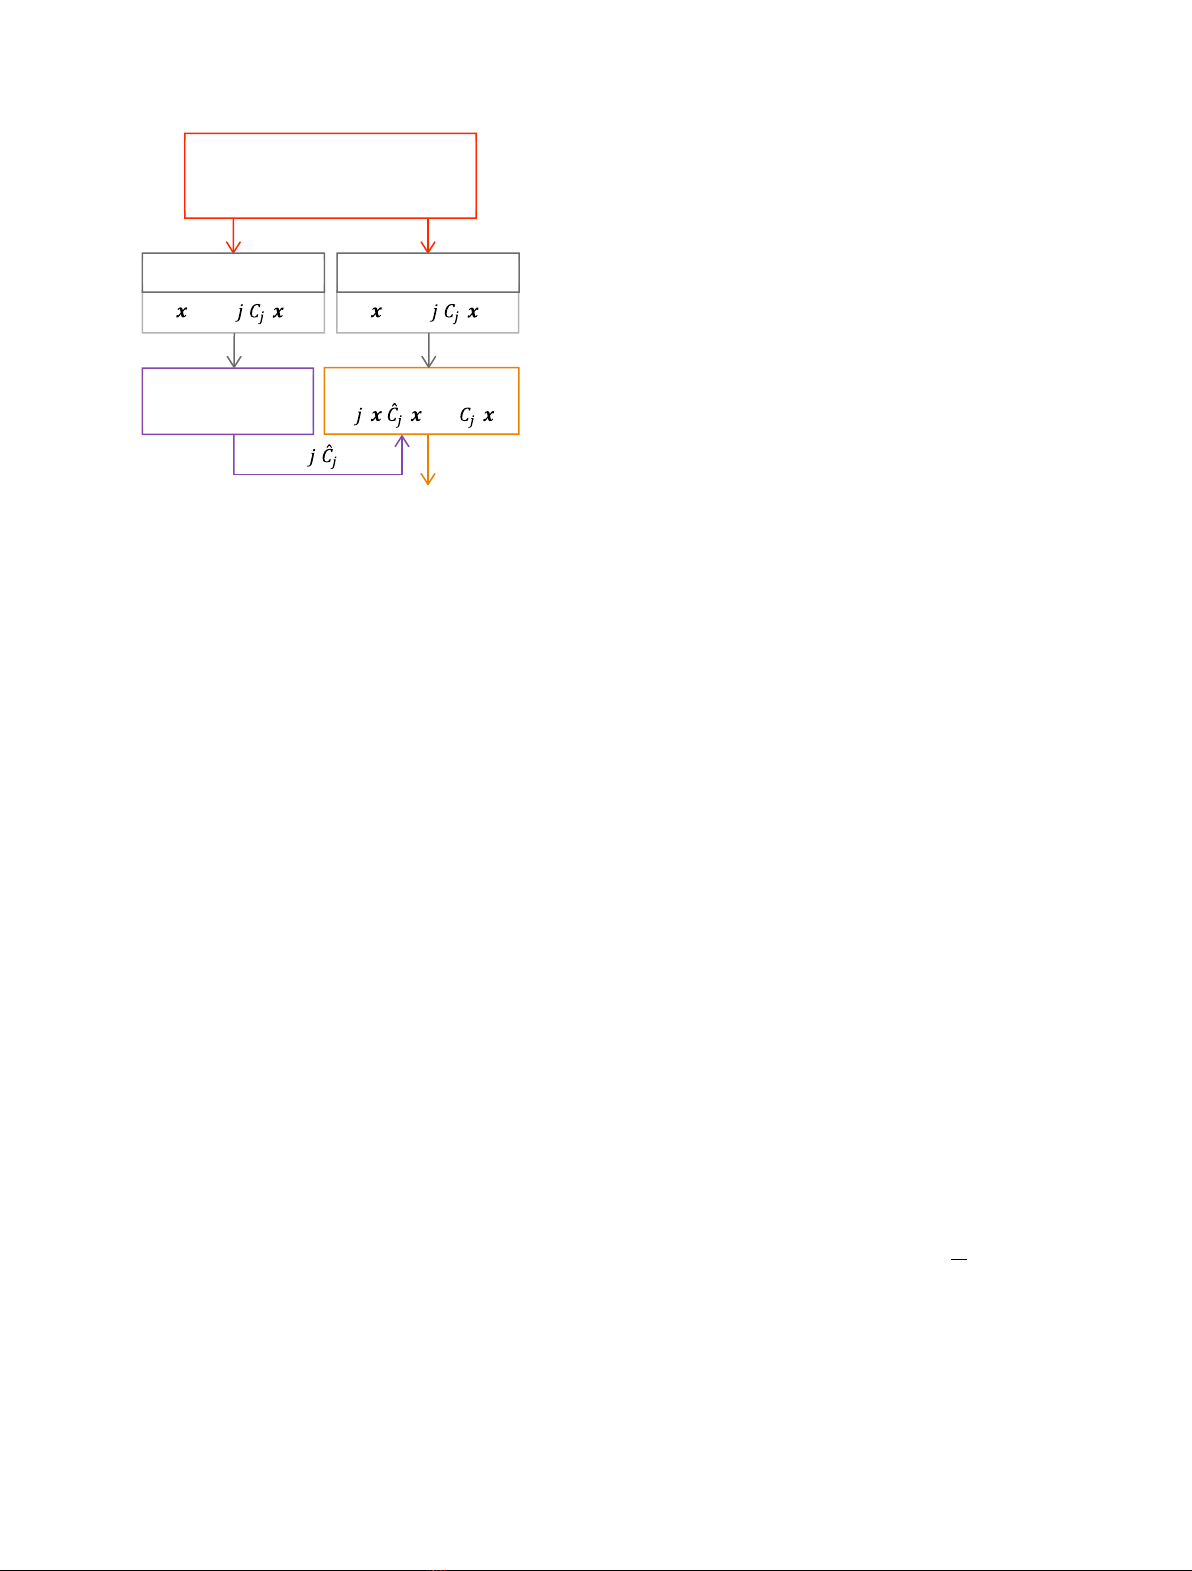
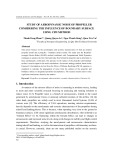
The development of irradiation surrogate models (see
Fig. 3) consists first in defining designs of experiments of the
CESAR input parameters and associated outputs. These
designs are defined using Latin hypercube sampling method
(LHS) because of its high space-filling performance. The
number of xvectors defined for each design is set to 500.
Then a regression model is applied to produce a surrogate
model. Surrogate models are noted ^
Cjas the functions
Batches of
materials
Enrichment and
fabrication plants
Stocks
Front-end path
Reactors
dates, loadings, fuel types
Reprocessing plant
dates, capacities, strategy
Spent fuel
interim storages
Back-end path
Waste facilities
Waste path
Fig. 1. COSI simplified data set operating diagram.
Part 2.4: validation of COSI sped up version
Part 3: multiobjective optimization studies
Part 2: development of CESAR surrogate models
CESAR5.3 depletion code
+
URANIE3.4 platform
Irradiation surrogate models
& Cooling analytic models
+
COSI6 scenario simulation code
COSI sped up version
+
URANIE3.4 platform
Fig. 2. Global multiobjective optimization methodology.
2 D. Freynet et al.: EPJ Nuclear Sci. Technol. 2, 9 (2016)
estimating the C
j
CESAR results. Finally, quality indica-
tors are performed on each surrogate model to ensure that
the prediction power is satisfactory.
We make one surrogate model per tracked isotope per
fuel type considered in the application scenario. For each
fuel type, we make two designs of CESAR calculations:
one for the regression step (named the training set) and
another one for the validation step (named the testing
set). All these operations are carried out with the URANIE
platform.
The use of CESAR surrogate models coupled with the
COSI code has already been introduced for uncertainty
propagation studies in nuclear transition scenarios [6,7].
2.2 Regression models
CESAR surrogate models are developed using a regression
method on the training set. The following methods are
compared:
–first- (LR) and second-order (PR) polynomial regressions;
–Gaussian process (GP);
–artificial neural network (ANN).
Polynomial regression is a well-known approach to
adjust a set of points by a function. Applied to CESAR
calculations training set, the estimator is defined by
equation (1) (LR) or equation (2) (PR):
∀x^
CjxðÞ¼a0þX
N
n¼1
anxn;ð1Þ
∀x^
CjxðÞ¼a0þX
N
n¼1
anxnþX
N
p¼1X
N
q¼1
apqxpxq:ð2Þ
Polynomial regression consists in finding the a
parameters giving the best model adjustment on the
training set. CESAR surrogate models development with
polynomial regression is detailed in a past work [6].
Gaussian process is a non-parametric regression method
using a deterministic function and a correlation function
involving parameters determined by maximum-likelihood
estimation [8].
Artificial neural network is used in its single-layer
perceptron form, i.e. there are no cycles and loops in the
network and only one output neuron. Applied to CESAR
calculations training set, the estimator is defined as:
∀x^
CjxðÞ¼a0þX
H
h¼1
ahSa0hþX
N
n¼1
anhxn
!
;ð3Þ
where SxðÞ¼
11þexp xðÞðÞ
is the sigmoid function and h
denotes the hidden neuron. A backpropagation algorithm is
applied to calculate the aweights by minimizing the
estimation root mean square error. CESAR surrogate
models development with ANN is also presented in another
work [7].
2.3 Validation results
Surrogate models have been defined according to their use
in optimization studies. Indeed the set of scenarios
considered in this paper is extracted from the 2006 French
Act for waste management which involves estimating PWR
UOX, PWR MOX, PWR ERU and SFR MOX fuel types
depletion. The validation step has to be applied to all of the
surrogate models. Only the results of the ^
CPu239 and ^
CCm244
estimators for a PWR MOX irradiation are presented here,
because of the importance of their accurate estimation and
their non-linear evolution. Results shown in this part
consider that GP deterministic function is linear, GP
correlation function is Matérn 3/2 and the ANN number of
hidden layers is 6.
Validating surrogate model rests upon the evaluation of
indicators quantifying the quality of the regression and
above all the estimator capacity to reckon the CESAR
outputs. These indicators have to be representative of
different estimation errors and are calculated using the
testing set. Generally the predictivity coefficient q
2
acts as
the main indicator for validating surrogate models [8]. Yet
irradiation surrogate models are coupled with COSI which
is repeatedly run during the optimization process. Thus,
estimation error needs to be known to check that its impact
is negligible on COSI outputs. For each testing xvector and
surrogate model, let D
j
(x) be the absolute estimation error
divided by the mean of C
j
(x) on the testing vectors:
DjxðÞ¼j
^
CjxðÞCjxðÞj=Cj:ð4Þ
Calculating the mean and maximal values of this
indicator on the testing set enables estimating the surrogate
model quality. Replacing the denominator of equation (4)
by C
j
(x), i.e. calculating the relative error, leads to high
errors for low values of output concentrations. These cases
are not significant for scenario studies because they are
unnecessary to get a good estimation of the spent fuel
CESAR5.3 depletion code
+
URANIE3.4 platform
Training set (LHS)Testing set (LHS)
URANIE’s
regression model
Va l i d at i o n
Irradiation surrogate models
( )
{}} + {∀ ( )
{}} + {∀
∀ ,( ) vs ( )
∀
Fig. 3. Surrogate models development methodology.
D. Freynet et al.: EPJ Nuclear Sci. Technol. 2, 9 (2016) 3
composition. Consequently, the definition given here is
preferred. Error results are shown in Table 1.
This comparison study implies to consider ANN for all
the CESAR surrogate models development.
2.4 Toward a COSI sped up version
Cooling calculation can be sped up using cooling surrogate
models, but the analytic solutions of the Bateman equation
with no flux can be calculated. Therefore, simplified cooling
analytic solutions are implemented under COSI in addition
to the irradiation surrogate models.
Besides, the list of isotopes tracked (321 isotopes with
CESAR5.3) can be reduced in the COSI sped up version in
order to further shorten the COSI calculation time. Both for
irradiation and cooling calculations, output isotopes jare
chosen among whom mostly contribute to the fuel mass and
post-processing results. The following isotopes constitute
more than 99.999% of the spent fuel actinide mass after
irradiation and thus are estimated:
–
234
U,
235
U,
236
U,
238
U;
–
237
Np,
239
Np;
–
238
Pu,
239
Pu,
240
Pu,
241
Pu,
242
Pu;
–
241
Am,
242m
Am,
243
Am;
–
242
Cm,
243
Cm,
244
Cm,
245
Cm,
246
Cm.
Several fission products such as
90
Sr,
90
Y,
137
Cs and
137m
Ba complete the list to make possible estimating decay
heat and radiotoxicity under long cooling period in waste. It
is noteworthy that the choice of isotopes jdepends on the
COSI outputs taken into account for optimization studies.
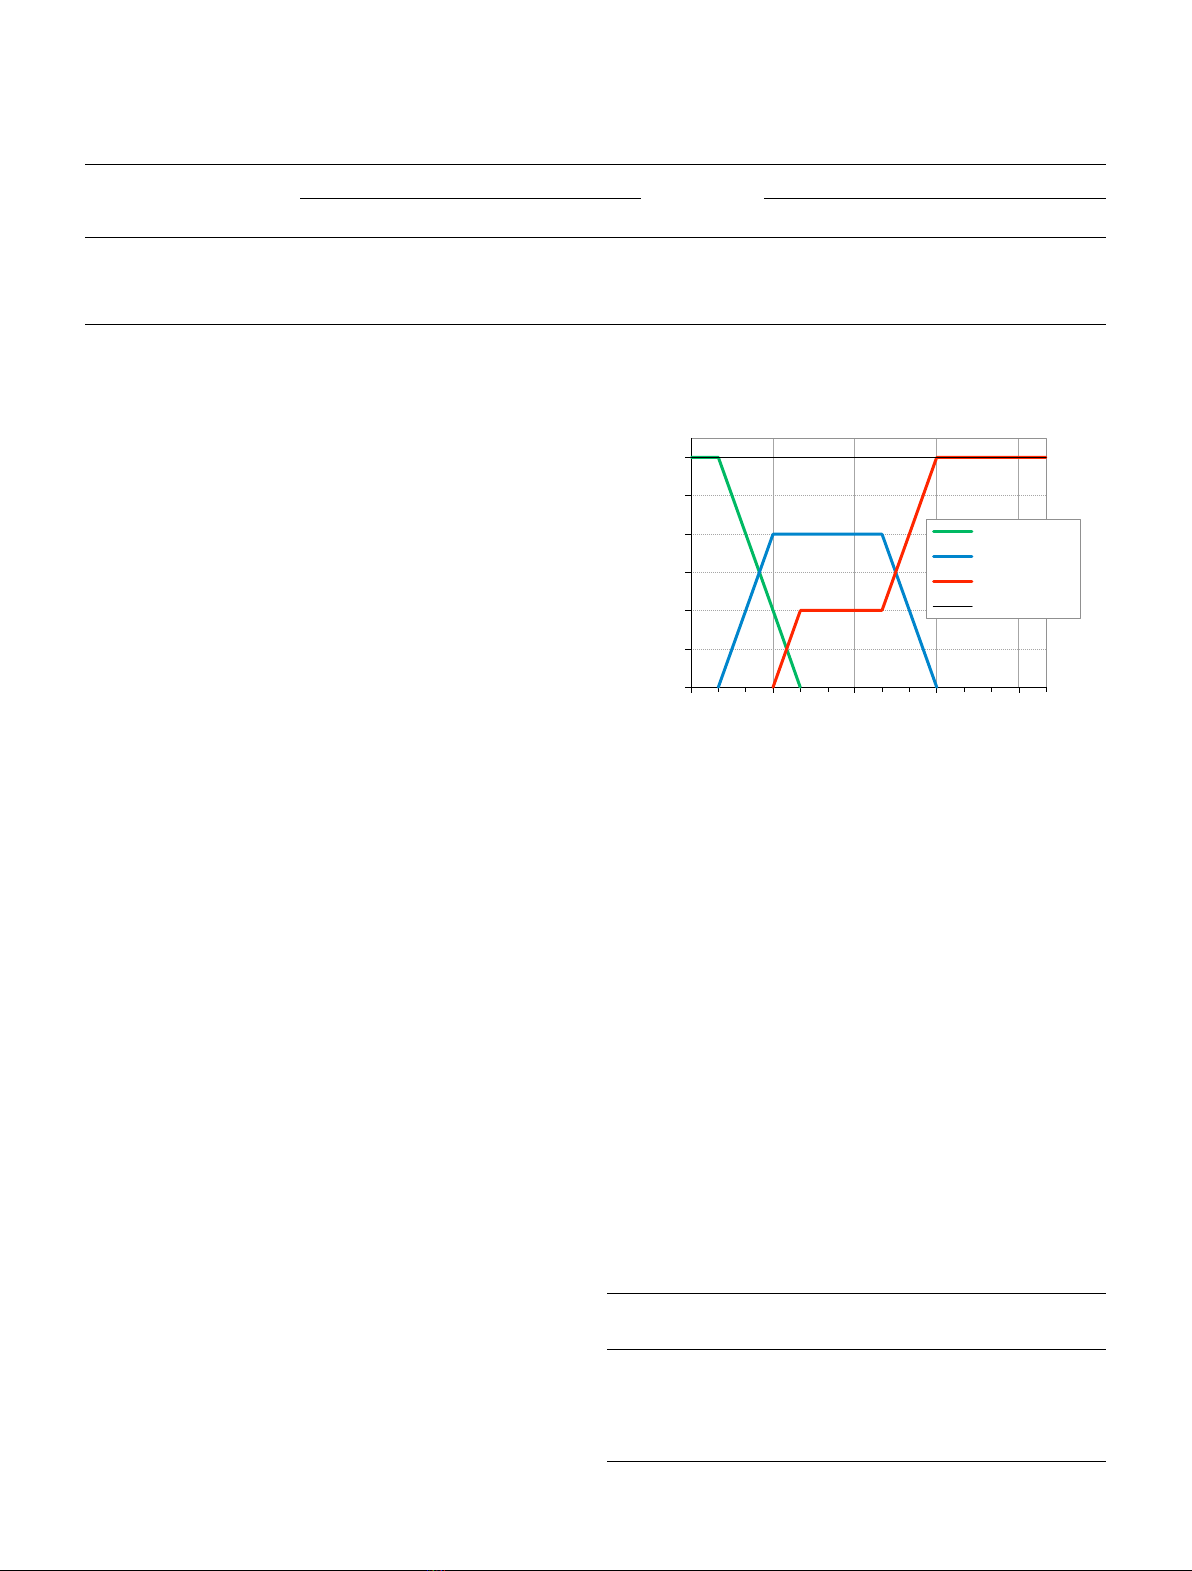
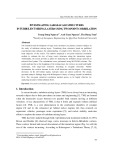
COSI sped up version is validated for a scenario of SFR
deployment studied in this frame [9,10]. The nuclear power
distribution of this scenario is represented in Figure 4.
First, all the actinide masses in cycle are compared from
2010 to 2140. The results for the actinide elements are
shown in Table 2.
Isotope estimation errors in cycle (waste excluded) are
on the whole lower than 1.5% except 2.5% for
243
Cm
estimation (present in low quantity). There is no
transmutation in the application scenario so waste
estimation errors are larger than cycle estimation errors:
errors are lower than 3% except 4.5% for
239
Np (present in
low quantity),
238
Pu and
240
Pu. Decay heat and radio-
toxicity by ingestion for waste are calculated under long
cooling period (from 1 to 10
4
years after 2140), estimation
errors are no larger than 4%. Finally, the number of High
Level Waste (HLW) packages cumulated at the end of the
scenario is estimated with an error of 1.2%. These results
are considered satisfactory enough to use COSI sped up
version for optimization studies.
There are two types of COSI computation:
–standard: main depletion calculations at each date of
interest (loading and unloading fuel dates, etc.);
–advanced: standard simulation plus additional depletion
calculations; the advanced simulation considers the
calculation of all the inventories in cycle for each year.
Computation time saving using COSI sped up version
for the application scenario simulation is shown in Table 3.
It should be mentioned that COSI sped up version
calculations are multi-threaded.
Table 1. Indicators of validation for PWR MOX
239
Pu and
244
Cm concentration estimations by surrogate models.
Regression
method
j=
239
Pu j=
244
Cm
Mean
x
D
j
(%) Max
x
D
j
(%) Mean
x
D
j
(%) Max
x
D
j
(%)
LR 1.3 6.3 4.4 20
PR 0.093 0.69 0.71 3.1
GP 0.22 2.5 0.85 5.6
0
10
20
30
40
50
60
2010 2040 2070 2100 2130
Nuclear power (GWe)
Time (years)
Current fleet
PWR
SFR
Total
Fig. 4. Application scenario nuclear power distribution for
validating surrogate models.
Table 2. Maximal relative errors for the actinide mass
estimations with COSI sped up version for the application
scenario simulation.
Element In cycle (%)
(waste excluded)
In waste (%)
Pu 0.51 3.1
Np 1.5 2.5
Am 0.95 2.8
Cm 0.68 2.0
4 D. Freynet et al.: EPJ Nuclear Sci. Technol. 2, 9 (2016)
An optimization calculation is then feasible using COSI
sped up version because of the good surrogate models
precision and the resulting time savings.
3 Optimization exercise
3.1 Optimization problem definition
Determining the best set of scenario parameters for a given
problem requires that we define criteria, constraints and a
base scenario with variables. In order to define this base
scenario, it is necessary to make assumptions about the
nuclear fleet evolution.
In the frame of a first application of the methodology, it
is supposed that:
–SFR deployment is possible from 2040;
–all the reactors deployed from 2020 have a life span of
60 years;
–the nuclear fleet power equals to 60 GWe from 2010 to
2140 to maintain a constant nuclear energy production;
–the current fleet phases out from 2020 to 2050 at the pace
of –2 GWe/year;
–there is no MOX fuel loaded in EPR
TM
from 2020, which
is a simplification for the current study.
These assumptions have as consequences:
–the nuclear power distribution of the base scenario cannot
be changed from 2010 to 2040; the current PWR fleet
(UOX and MOX fuels) is partially renewed with EPR
TM
(only UOX fuel) from 2020 to 2040;
–the paces of reactors deployment and shutdown are
respectively set to 2 and –2 GWe/year;
–there are two phases where reactors can be deployed from
2040: from 2040 to 2050 noted phase 1 and from 2080 to
2110 noted phase 2.
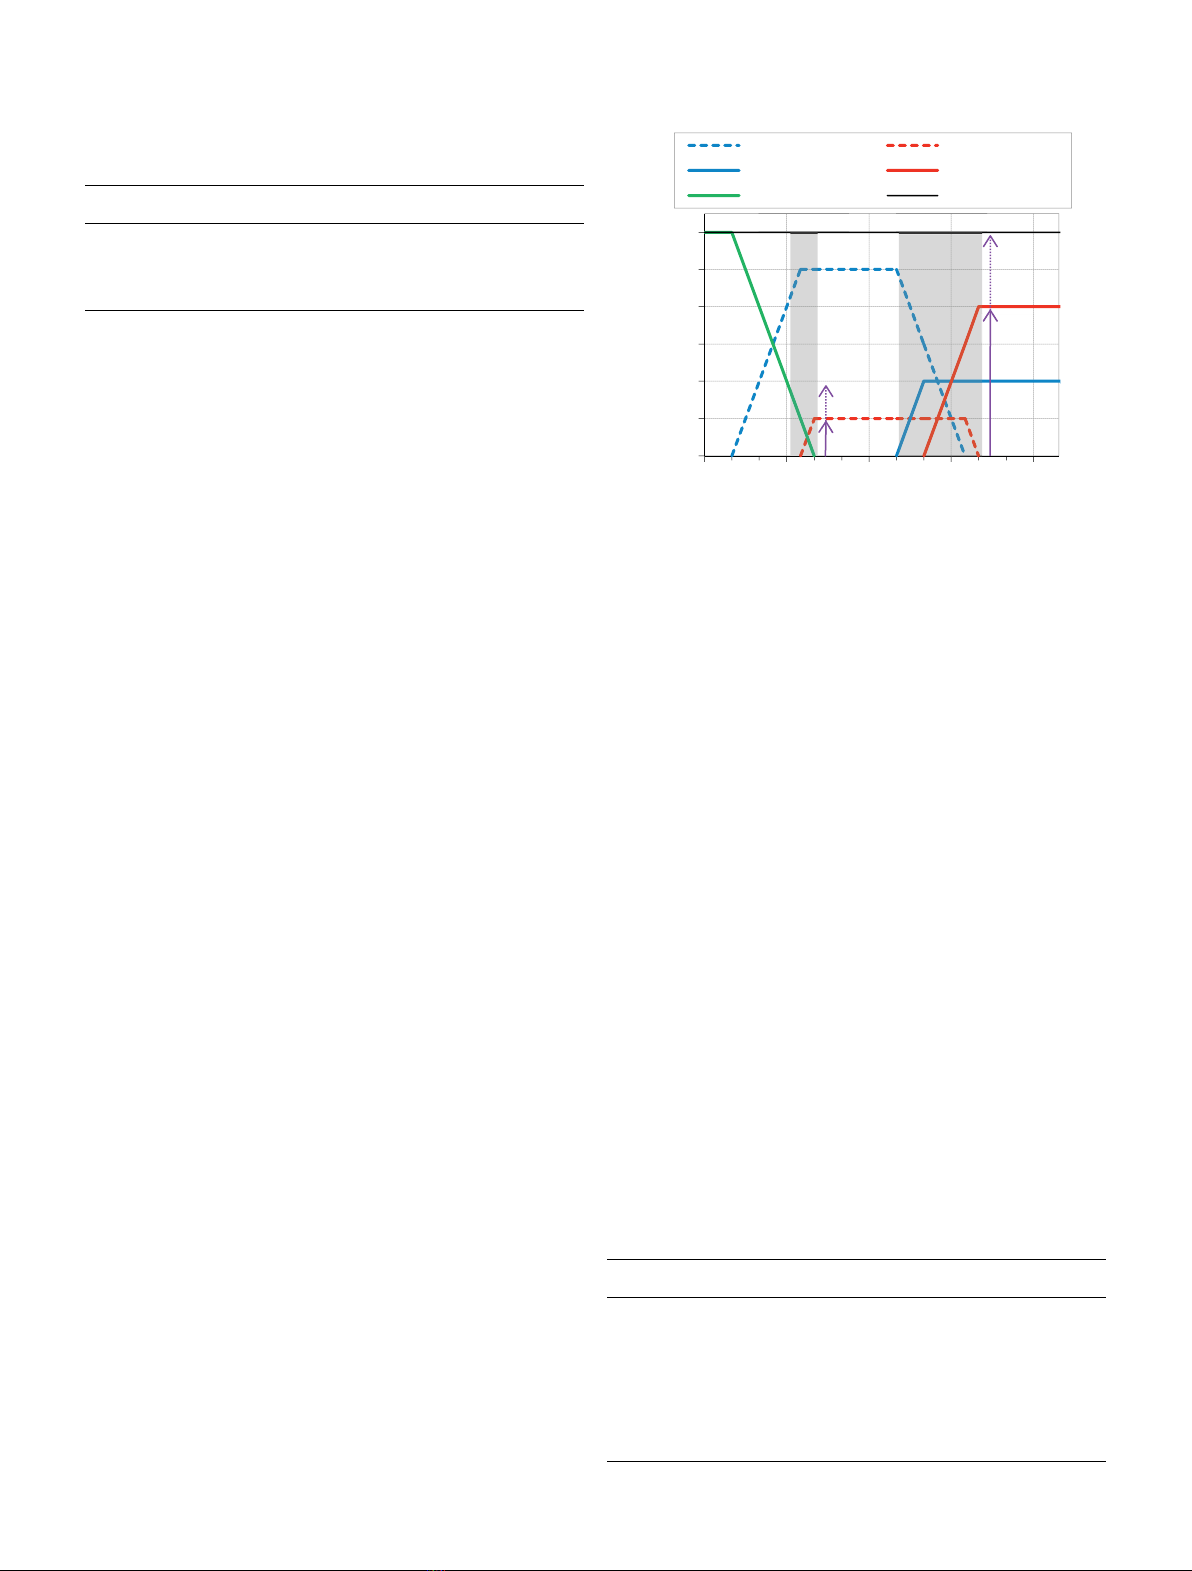
We also consider that EPR
TM
are deployed before SFR
in a same phase of reactors deployment. An example of this
base scenario is shown in Figure 5 with respectively 7 and 27
SFR deployed during the phases 1 and 2.
Two types of reactors can be deployed: EPR
TM
(UOX
fuel) and SFR with their characteristics listed in Table 4.
During the phase 1, 14 reactors need to be deployed to keep
a nuclear power of 60 GWe. During the phase 2, 40 reactors
have to be deployed to renew the nuclear fleet. Let
N
1
∈[0,14] (resp. N
2
∈[0,40]) be the number of SFR
deployed during the phase 1 (resp. 2). The optimization
study presented below only considers N
1
and N
2
as
variables. Consequently, the scenarios are defined according
to the notation {N
1
,N
2
}. The scenario represented in Figure 4
corresponds to the case {14,40}.
The optimization problem aims to analyse the best SFR
deployment scenarios. SFR deployment requires enough
plutonium to ensure its fuel loadings are possible during its
life span. Therefore, the lack of plutonium noted m
Pu–
defined as the need of additional plutonium to make possible
the scenario application needs to be zero. The reprocessing
strategy is thus defined to ensure that all the spent fuels
available can be reprocessed. In a first reprocessing strategy
called Rep1, it is chosen that the SFR MOX fuel assemblies
are reprocessed first when available, then the PWR (current
fleet and EPR
TM
deployed before 2040) fuel assemblies. Rep1
aims to make the most of plutonium multirecycling in SFR
fuels. A second strategy called Rep2 reverses the reprocessing
order between PWR and SFR fuels. Rep2 aims to diminish
the spent fuels accumulated. The annual reprocessing
capacity is not limited in this study and is only regulated
by fresh fuel fabrication needs. The two reprocessing
strategies considered thereafter are reminded in Table 5.
It is noteworthy that these assumptions on reprocessing are
not representative of an industrial reality but avoid
additional constraints on results for simplification purpose.
We consider two criteria in the optimization problem:
–the natural uranium mass consumption from 2010 to 2140
noted m
natU
should be minimized; this criterion refers to
safeguard natural resources;
Table 3. COSI computation time decomposition for the
application scenario simulation.
COSI version Standard Advanced
COSI/CESAR5.3 4622 s 46,791 s
Sped up 38 s 65 s
Speedup 122 720
0
10
20
30
40
50
60
2010 2040 2070 2100 2130
Nuclear power (GWe)
Time (years)
EPR (phase 1) SFR (phase 1)
EPR (phase 2) SFR (phase 2)
Current fleet Total
N1
N2
Phase 1 Phase 2
Fig. 5. Nuclear power distribution of the base scenario with the
variables in purple (scenario noted {7,27}).
Table 4. Base scenario reactors assumptions.
Reactors EPR
TM
SFR
Electrical power 1.5 GWe 1.5 GWe
Net yield 34.4% 40.3%
Load factor 81.8% 81.8%
Core management 4 367 EFPD 5 388 EFPD
Average burnup 55 GWd/tHM 116 GWd/tHM
Fuel type UOX 17 17 MOX CFV-v1 [11]
D. Freynet et al.: EPJ Nuclear Sci. Technol. 2, 9 (2016) 5


![Đề ôn tập cuối kỳ môn Kỹ thuật nhiệt - Nhiệt động học [mới nhất]](https://cdn.tailieu.vn/images/document/thumbnail/2026/20260310/hoaphuong0906/135x160/60681773197823.jpg)

![Bài giảng thang máy và thang cuốn: Tổng hợp kiến thức [chuẩn nhất]](https://cdn.tailieu.vn/images/document/thumbnail/2026/20260310/hoaphuong0906/135x160/41471773283876.jpg)
