
* Corresponding author.
E-mail address: srd_kmutnb@hotmail.com (S. Denthet)
© 2019 by the authors; licensee Growing Science, Canada.
doi: 10.5267/j.dsl.2018.11.002
Decision Science Letters 8 (2019) 317–322
Contents lists available at GrowingScience
Decision Science Letters
homepage: www.GrowingScience.com/dsl
The negative binomial-weighted Lindley distribution
Sunthree Denthet* and Pramoch Promin
College of Industrial Technology King Mongkut’s University of Technology North , Thailand
C H R O N I C L E A B S T R A C T
Article history:
Received October 9, 2018
Received in revised format:
October 10, 2018
Accepted November 11, 2018
Available online
November 11, 2018
This paper proposes a new distribution named the negative binomial-weighted Lindley. The
study uses the maximum likelihood estimation to estimate the parameters of the proposed
distribution and compares the performance of the new method with other distributions. The study
finds that the negative binomial-weighted Lindley distribution, obtained by the mixing the
negative binomial distribution with the weighted Lindley distribution is another mixed negative
binomial distribution and may provide an appropriate fit for data estimation with overdispersion.
Some characteristics of the proposed distribution, such as mean and variance are also derived.
.2018 by the authors; licensee Growing Science, Canada©
Keywords:
Count data analysis
Mixed negative binomial
distribution
Weighted Lindley distribution
1. Introduction
A count data distribution is only non-negative integers in its domain. We typically use the count data
distribution to model the number of occurrences of a certain event. The Poisson and negative binomial
(NB) distributions are the count data distribution for examples. The standard distribution for modeling
count data has been the Poisson distribution, which is a proper model for counting the number of
occurrences over a time interval at random when not many occurrences are observed within a short
period of time. They occur at a constant rate through time, and one occurrence of the phenomenon does
not alter the probability of any future occurrence (Rainer, 2008; Team, 2015). Let (~)X Poisson
be a
Poisson distributed with parameter
. The probability mass function (pmf) of X is given by
exp( )
( ) , 0,1, 2,..., 0.
!
x
fx x
x
(1)
Then, the mean and variance are given by ()EX
and ()Var X
. Equality of mean and variance,
called equal dispersion, is a classic characteristic of the Poisson distribution. Moreover, there are other
categories of dispersion which are overdisperssion when the variance is greater than the mean and
underdispersion where the variance is smaller than the mean (Haight, 1967). The NB distribution is a

318
popular alternative distribution for modelling overdispersed count data because it is more flexible in
accommodating overdispersion in comparison with the Poisson model. The NB distribution is a mixture
of Poisson distribution by mixing the Poisson and gamma distribution. Applications using the NB
distribution can be found in many areas, for instance, economics, accident statistics, biostatistics and
actuarial science. The problem of overdispersion is usually solved by introducing mixed NB
distribution. In several studies, it is shown that mixed NB distribution provides better fit on count data
compared with the Poisson and the NB distribution. These include the Poisson-inverse Gaussian
(Klugman et al., 2008), negative binomial-inverse Gaussian (Gómez-Déniz et al., 2008), negative
binomial-Lindley (Zamani & Ismail, 2010), negative binomial-Beta Exponential (Pudprommarat et al.,
2012), and negative binomial-Erlang (Kongrod et al., 2014). The Lindley distribution has been
generalized by many researchers in recent years. The Lindley distribution is the mixture of exponential
()
and Gamma (2, )
distributions (Lindley, 1958). Subsequently Ghitany et al. (2008) investigated
Lindley distribution in the context of reliability analysis. Subsequently, a weighted Lindley (WL)
distribution is proposed for modelling survival data. A random variable X follows the WL distribution
with parameters 0
and
and the probability density function (pdf) is follows,
2
(1 )
( ) (1 ) exp( ( )),
(1)
fx x x
-
=+--
-+ for 0.x> (2)
Let ~WL( , ),X
then its moment generating function (mgf) of X is given by
2
()( 1)
() .
(1)( )
X
t
Mt t
---+
=
-+ -- (3)
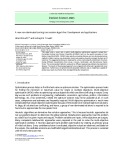
Some plots of the WL pdf with some specified values of
and
are shown in Fig. 1.
Fig. 1. Some pdf plots of the WL distribution
In this research, a count distribution, which is represented as an alternative distribution for
overdispersed count data, namely the negative binomial- weighted Lindley (NB-WL) distribution is
developed. The NB-WL distribution is a mixture of the NB and WL distributions. The method is more
flexible alternative to the Poisson and NB distribution. Some of the characteristics of the proposed
distribution can be studied through factorial moments, e.g., mean and variance. The parameters of the
proposed distributions are estimated by using the maximum likelihood estimation (MLE). The MLE is
a popular technique for estimating parameter of a given function which makes that likelihood function
a maximum and it is also a powerful and unbiased estimation in estimating parameters (Hamid, 2014).
The proposed distribution is compared with the performance of Poisson and NB distributions.
2. Methodology
2.1 Research objectives
The objectives of this research are to propose a new mixed distributions, to derive the parameter
estimation of the proposed distributions by using the MLE method and compares the efficiencies of the
proposed distribution with other distributions for count data analysis.

S. Denthet and P. Promin / Decision Science Letters 8 (2019)
319
2.2 The materials
The materials of this research are as high performance personal computer for running the coded
program. The maximum likelihood estimates ˆ
ˆ,r
and ˆ
for the parameters ,r
and
respectively, are
taken by solving iteratively differential equations to zero. These differential equations are not in closed
form and a numerical method can be employed to obtain the expectations of them. The MLE solution
of ˆ
ˆ,r
and ˆ
can be obtained by solving the resulting equations simultaneously using optim function
in R language.
2.3 The methods
The methods of the research are to investigate pmf and some properties of the NB-WL distribution. To
estimate the parameters of the NB-WL distribution, a MLE method is implemented. Random variate
generation of the NB-WL distribution is derived and application of the NB-WL distribution to real data
set has been studied by comparing with the Poisson and NB distributions using the Kolmogorov-
Smirnov (K-S) from the dgof package of R language (Arnold & Emerson, 2011).
3. Results
This section presents the results of the research and provides the probability mass function (pmf) of the
proposed distribution. Moreover, some characteristics including the plots of the pmf with various
values of parameters, parameter estimation, random variate generation, and application of the proposed
distribution to real dataset are included in each part.
3.1 The propose Distribution
We propose a new mixed NB distribution which is an NB-WL distribution obtained by mixing the NB
distribution with a WL distribution. The distribution has three parameters, namely, ,r
and
. We
begin with a general definition of the NB-WL distribution which will consequently reveal its the
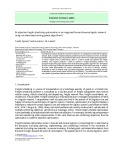
probability mass function (pmf). Fig.2. displays the NB-WL pmf plots with some specified parameter
values of ,r
and
.
Definition 1. Let X
be a random variable following a NB distribution with parameters r and
exp( ),p
NB ( , p( )).~exXrp
If
is distributed as the WL distribution with positive parameters
and ,
denoted by
~
WL( , ) ,
then X is called a NB-WL random variable.
Theorem 1. Let ~NB-WL( , , ).Xr
The pmf of X is given by
2
0
1()( 1)
(; ) (1) , 0,1,2,...
(1)( )
,,
x
j
j
rx x rj
fx x
xj
rrj
(4)
where 0
and .
Proof. If NB( , exp( ))~Xrp
and
~
WL( , ) ,
then the pmf of X can be obtained by
1
0
() ( )(; , ) ,
f
xfxg d
where 1()
f
x
is express as
1
0
11
( ) exp( )(1 exp( )) ( 1) exp( ( )).
x
xj
j
rx rx x
f
xr rj
xxj
(5)

320
By substituting 1()
f
x
into 1
0
() ( )(; ,) ,
f
xfxg d
thus
0 0
0
11
() (1) exp( ( ))(;,) (1) (( )).
x x
j j
j j
rx x rx x
f
xrjgdMrj
xj xj
(6)
Substituting (( ))
M
rj
the mgf of the WL distribution in the equation above, the pmf of the
NB-WL ( ,,)r
is given as
2
0
1()( 1)
(; ) (1) ,
(1)(
,, )
x
j
j
rx x rj
fx xj
rrj
(7)
Fig. 2. The pmf of the NB-WL distribution of some specified values of ,r
and
3.2 Characteristics of the NB-WL distribution
Some characteristics of the NB-WL distribution will be discussed as follows. The factorial moment of
the NB-WL distribution is introduced. Some of the most important structures and characteristics of the
NB-WL distribution can be studied through factorial moments.
Theorem 2. If ~NB-WL( , , ).Xr
the factorial moment of order a of X is
2
0
() ()( 1)
( ) ( 1) , 0,1, 2,...
() (1)( )
a
j
a
j
a
ra r j
Xx
j
rrj
(8)
for 0
and .
Proof. Gómez-Déniz et al. (2008) showed that the factorial moment of order a of mixed NB distribution
can be expressed in the terms of elementary function by
()(1exp()) ()
( ) (exp( ) 1) .
() exp( ) ()
a
a
a
ra ra
XE E
rar
(9)

S. Denthet and P. Promin / Decision Science Letters 8 (2019)
321
Using the binomial expansion of (exp( ) 1) ,
a
then ()
aX
can be written as
00
() ()
( ) (1) (exp(( ))) (1) ( ).
() ()
aa
jj
a
jj
aa
ra ra
X
Eaj Maj
jj
rr
(10)
From the mgf of the NWL distribution with t = a− j, the ()
aX
is finally given as
2
0
() ()( 1)
() (1) .
() (1)( )
a
j
a
j
a
ra r j
Xj
rrj
(11)
Definition 2. Let ~NB-WL( , , ).Xr
some properties of X are as follows
1) The first two moments about zero of Xare
() (-1) ,EX r
(12)
2
21
() (1)-(21) 2,
E
Xrr rr r
(13)
2) The mean and variance of X respectively, are
() (-1),EX r
(14)
21
() ( 1) - (1 ) .Var X r r r r
(15)
where 2
()( 1)
.
(1)( )
k
k
k
3.3 Applications study of NB-WL distribution
We illustrated the NB-WL, NB and Poisson distributions by applying the number of hospitalized
patients with diabetes at Ratchaburi hospital, Thailand. The log-likelihood values and the p-values of
K-S test for the discrete goodness of fit test are summarized in Table 1. The expected frequencies of
the NB-WL distribution are close to the observed frequencies, the values of K-S test of NB-WL
distribution is smaller than the values of the K-S test of the Poisson and NB distributions and Also,
based on the p-values of K-S test, the proposed distribution is appropriate to fit the data compared to
the Poisson and NB distributions.
Table 1
Observed and expected frequencies for number of hospitalized patients with diabetes
N
o. of
N
o. of Ex
p
ected value b
y
fittin
g
distributio
n
hos
p
italization cases Poisson
N
B
N
B-WL
0 63 261.2574 73.5711 34.3315
1 29 449.3630 155.7058 189.0602
2 12 386.4520 205.2514 171.5407
3 15 221.5659 215.9518 147.2508
4 8 95.2733 198.4813 124.3442
5 9 32.7740 166.5815 104.7453
6 5 9.3952 130.9441 88.5186
7 4 2.3085 97.9537 75.2206
8 6 0.4963 70.4826 64.3310
9 2 0.0949 49.1530 55.3816
10 3 0.0163 33.4063 47.9862
11 3 0.0026 22.2195 41.8357
12 2 0.0004 14.5100 36.6865
13 2 0.0000 9.3271 32.3472
Total
Parameter estimates ˆ1.72
ˆ4.07r ˆ4.15r
ˆ0.48
p
ˆ0.52
ˆ2.01
lo
g
-likelihoo
d
-1140.449 -1014.642 -825.985
K
-S test 0.319 0.013 0.018
p
-value <0.001 0.086 0.572

![Định mức kinh tế - kỹ thuật nghề Cơ khí hàn [chuẩn nhất]](https://cdn.tailieu.vn/images/document/thumbnail/2025/20251225/tangtuy08/135x160/695_dinh-muc-kinh-te-ky-thuat-nghe-co-khi-han.jpg)
![Tài liệu huấn luyện An toàn lao động ngành Hàn điện, Hàn hơi [chuẩn nhất]](https://cdn.tailieu.vn/images/document/thumbnail/2025/20250925/kimphuong1001/135x160/93631758785751.jpg)


![Giáo trình Cấu trúc dữ liệu và giải thuật - Trường CĐ Cơ điện Hà Nội [Mới nhất]](https://cdn.tailieu.vn/images/document/thumbnail/2026/20260323/lionelmessi01/135x160/58171774381670.jpg)


![Giáo trình Tiện nâng cao (Nghề Cắt gọt kim loại, Trình độ Cao đẳng) - Trường Cao đẳng Cơ điện Hà Nội [Mới nhất]](https://cdn.tailieu.vn/images/document/thumbnail/2026/20260323/lionelmessi01/135x160/48101774403543.jpg)


