
* Corresponding author.
E-mail addresses: filippo.berto@ntnu.no (F. Berto)
© 2017 Growing Science Ltd. All rights reserved.
doi: 10.5267/j.esm.2016.11.002
Engineering Solid Mechanics (2017) 1-8
Contents lists available at GrowingScience
Engineering Solid Mechanics
homepage: www.GrowingScience.com/esm
Notched plates in mixed mode loading (I+II): a review based on the local strain
energy density and the cohesive zone model
F. Bertoa* and J. Gomezb
aDepartment of Industrial and Mechanical Engineering, NTNU, Trondheim, Norway
bAdvanced Material Simulation, S.L. Asturias 3. Bilbao 48015, Spain
A R T I C L EI N F O A B S T R A C T
Article history:
Received 6 July, 2016
Accepted 3 November 2016
Available online
6 November 2016
Two procedures to evaluate fracture resistance of notched components are proposed in this
contribution: the Strain Energy Density (SED) over a control volume and the Cohesive Zone
Model (CZM). With the aim to simplify the application of the two fracture criteria, the concept
of the ‘equivalent local mode I’ is presented. The control volume of the SED criterion and the
cohesive crack of the CZM, have been rotated along the notch edge and centered with respect
to the point where the elastic principal stress is maximum. Numerical predictions are compared
with experimental results from U and V shaped notches under three point bending with notch
root radius ranging from 0.2 to 4.0 mm. In parallel the loading conditions vary, from pure mode
I to a prevailing mode II. All specimens were made of PMMA and tested at -60°C. The good
agreement between theory and experimental results adds further confidence to the proposed
fracture criteria.
© 2017 Growing Science Ltd. All rights reserved.
Keywords:
Notched plates
Mixed mode loading
Local strain energy density
Cohesive zone model
1. Introduction
In recent years, the mode I fracture of notched samples made of brittle or quasi-brittle materials has
been studied by different authors (Carpinteri, 1987; Knésl, 1991; Nui et al., 1994; Seweryn, 1994;
Gómez et al., 2000; Gomez & Elices, 2003; Strandberg, 2002; Atzori & Lazzarin, 2001; Gogotsi, 2003;
Leguillon & Yosibash, 2003; Yosibash, 2004; Dini & Hills, 2004; Taylor, 2004; Lazzarin & Zambardi,
2001; Lazzarin & Berto, 2005). Under mixed mode (I+II) loading, the problem is more complex, even
for brittle or quasi-brittle materials, and few failure criteria have been proposed for V-notches (Seweryn
& Lucaszewicz, 2002; Yosibash et al., 2006) giving more or less accurate predictions.
The first task of this paper is to provide a new set of experimental results on fracture of U and V-
notched samples, with different values of loading mixity, notch root radii and notch angles. The second

2
task is to investigate the possibility to use two fracture criteria in mixed mode fracture of notched
components: the cohesive zone model and the strain energy density model, the latter applied to a finite
size volume. After the description of the experimental program (all specimens made of PMMA and
tested at -60°C), the paper presents the two different failure criteria as well as the numerical methods
to use for fracture load assessments. The paper closes with a comparison between experimental data
and expected values to failure.
2. Experimental results
Experiments were carried out by using specimens made of polymethyl-methacrylate (PMMA), a
polymer that exhibits a non-linear behavior at room temperature and linear elastic up to fracture at
−60ºC (Gomez et al., 2005). The average mechanical properties of PMMA at−60˚C appear in Table 1.
Table 1. Mechanical properties of PMMA at -60ºC
Young’s modulus E = 5.05 ± 0.04 GPa
Tensile strength
u = 128.4 ± 0.1 MPa
Fracture toughness KIC = 1.7 ± 0.1 MPa m1/2
Poisson’s ratio
0.40 ± 0.01
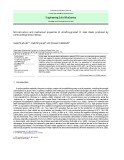
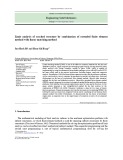
The experimental program considers U and V-notched specimens, with different notch inclinations,
notch opening angles, notch radii and boundary conditions. The geometry of the specimens is shown
in Fig. 1. In all specimens the thickness was 14 mm, the height 28 mm, whereas the notch depth was
14 mm. Four different geometries were tested, as indicated in Fig. 1 namely: standard U-notched beams,
standard V-notched specimen, beams with a tilted U-notch and beams with tilted V-notch. In standard
vertical U-notched beams, seven values of the notch root radius, R, were tested; R = 0.0, 0.2, 0.3, 0.5,
1.0, 2.0 and 4.0 mm. The position of the loading point, b, was changed to obtain different mixed mode
boundary conditions (i.e. b = –3, 3, 9, 18, 27 and 36 mm). A notch tip radius of 0.0 and 0.2 mm was
analyzed only in combination with the distances b = 9, 18, 27 and 36 mm; each configuration was
repeated three times so that a total number of 114 tests were performed for this group of notches.
For standard V-notched beams, three values of the notch opening angle were analyzed: = 30º,
60º and 90º. Mixed mode loading was introduced by changing the loading position b (Fig. 1). Two
values were considered; b = 1 and 9 mm and 18 different samples were tested. To increase the mode II
contribution, geometries with 45 degrees inclined notch have been considered (Fig 1). Five notch root
radii, R = 0.3, 0.5, 1.0, 2.0 and 4.0 mm, and three support span, m = 3, 9 and 15 mm, were explored
resulting in 15 different geometries and a total number of 45 tests.
For tilted V-notched beams, three notch angles were studied; = 30º, 60º and 90º, and, two values
of support span m were considered, as shown in Fig. 1; m = 9 and 18 mm. 18 different samples were
tested. Before testing, the radius and the angle of the notch were measured with an image analysis
system. The tests were performed on a servo controlled INSTRON 8803 testing machine. The load was
measured with a 5/10 kN INSTRON load cell with ± 0.5 % error at full scale. An MTS strain gauge
extensometer, with ± 1 mm nominal displacement and ± 0.15 % error at full scale was used for
measuring the displacement of the point where the load was applied. The testing set-up was placed
inside an INSTRON environmental chamber and cooled to –60˚C. Cooling was achieved by pouring
liquid nitrogen inside the chamber in a controlled and continuous flow. Temperature was measured
using a K-type thermocouple placed on the sample surface, near the notch. Testing was done in three
phases (Gomez et al. 2005); during the first the sample was cooled down to –60˚C in about 30 min and
subjected to a small pre-load under load control. Then, the sample temperature was stabilized, still
under load control, for 45 minutes. And finally, the sample was tested under displacement control at
rate of 0.03 mm/min at constant temperature. After each test the TPB experimental device has heated
to avoid condensed water over it. All in all, 195 fracture tests were performed.

F. Berto and J. Gomez / Engineering Solid Mechanics 5 (2017)
3
Fig. 1. Geometry and loading conditions. Data in mm
3. Failure criteria
3.1. The averaged strain energy density criterion
The averaged strain energy density criterion assumes that failure starts when the mean value of the
strain energy density over a control volume is equal to a critical energy Wc (Yosibash et al., 2004;
Lazzarin & Zambardi, 2001: Lazzarin & Berto, 2005). The control volume section is a circle in the case
of cracks or sharp V-notches and a crescent shape in U or blunts V-notches (Lazzarin & Zambardi,
2001; Lazzarin & Berto, 2005). In both cases the size is constant, equal to a material parameter, Rc. In
order to apply the criterion two independent parameters are needed: the critical value of the strain
energy, Wc, and the critical length, Rc. For a linear elastic material these two parameters could be
obtained from the ultimate tensile stress ft and the fracture toughness KIC.
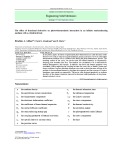
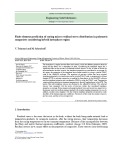
Under mixed mode loading it is assumed the equivalent local mode I approach, that establishes the
critical volume is no centered on the notch tip, rather on the point where the principal stress reaches its
14
14
Notch radii = 0, 0.2, 0.3, 0.5, 1.0, 2.0, 4.0
18 56
126
b =-3, 3, 9, 18, 27, 36
14
14
Notch angle 30º, 60º, 90º
m = 9, 18 56
126
9
14
14
Notch radii = 0.3, 0.5, 1.0, 2.0, 4.0
m = 3, 9, 15 56
126
9
14
14
Notch angle = 30º, 60º, 90º
18 56
126
b = 1, 9

4
maximum (Fig. 2). The crescent shape rotates rigidly, with no changes in shape and size (Gomez et al.,
2007; Berto et al., 2007).
Fig. 2. Control volume under mixed mode loading
Following this criterion, the critical load is obtained when the mean strain energy density reaches
the critical value Wc. The notched specimens have been numerically modelled using the finite element
method with the commercial code ABAQUS v 6.3. Two calculations were performed for all
geometries; the first one to determine the point of the notch edge where the principal stress reached its
maximum vale; the second one to compute the averaged strain energy density on the control volume
(Berto et al., 2007).
3.2. The cohesive zone model criterion
This model establishes two different regions: the cohesive crack zone and the bulk of the body
(Bazant & Planas, 1997; Elices et al., 2002). The behavior of the bulk material, PMMA at -60ºC, can
be approximated by an isotropic linear elastic material, and the behavior of the cohesive crack zone,
simplified as a surface, is defined by the relationship between the stress transfer by the crack and the
displacement of the lips, defined by the softening curve. In this research, the softening curve is assumed
rectangular; this simple curve provides a reasonable estimation of the fracture behavior of PMMA at -
60ºC (Gomez et al. 2005). The rectangular softening curve depends only on two parameters: the
cohesive stress ft and the fracture energy GF . The cohesive stress ft is assumed equal to the tensile
strength (ft = 128MPa) and the fracture energy was obtain from the fracture toughness (GF = 480 N/m.).
Under mixed mode loading the position of the cohesive crack zone is initially unknown. This problem
could be overcome with the local mode I approach (Gómez et al., 2007), establishing that the cohesive
cracks starts at the point where the principal stress reaches its maximum value and propagates initially
perpendicular to the notch edge. This criterion predicts the mechanical behavior of the notch geometry.
Calculations were performed with the freeware finite element code COFE, developed in the Department
of Materials Science at the Universidad Politécnica de Madrid (Planas & Sancho, 2007). Details of
calculations could be found in (Berto et al., 2007).
4. Results
In order to check the applicability and the degree of accuracy of the strain energy density criterion
(SED) and the cohesive zone model (CZM) when applied to fracture behavior assessments of PMMA
specimens tested at -60ºC under mixed mode loading, the numerical and the experimental values of the
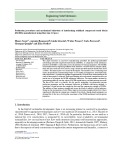
maximum load to failure were compared. Fig. 3 compares, for vertical standard U-notched beams, the
experimental values of the critical load, with the numerical predictions based on the CZM model and
the SED model. There are six figures corresponding to six different mixed load conditions, b = -3, 3,
9, 18, 27, 36 mm. As can be seen, the two models fit with a good accuracy all experimental results.
R
r0
Rc

F. Berto and J. Gomez / Engineering Solid Mechanics 5 (2017)
5
Fig. 3. Experimental and predicted values of the maximum load in standard U-notches
Fig. 4 compares for tilted U-notched beams, the critical loads experimental and numerical. The
three figures correspond to three different mixity loading as obtained changing the support span; m=
15, 9, 3 mm. The same comments, as for Fig. 3, can be drawn.
CZM
SED
Experimental
0
2
4
6
8
10
012345
P (kN)
R (mm)
-3
9
0
2
4
6
8
10
012345
P (kN)
R (mm)
CZM
SED
Experimental
3
9
0
2
4
6
8
10
012345
P (kN)
R (mm)
CZM
SED
Experimental
9
9
0
2
4
6
8
10
012345
P (kN)
R (mm)
CZM
SED
Experimental
18
9
0
2
4
6
8
10
012345
P (kN)
R (mm)
CZM
SED
Experimental
27
9
0
2
4
6
8
10
012345
P (kN)
R
(
mm
)
CZM
SED
Experimental
36
9


![Giáo trình Cấu trúc dữ liệu và giải thuật - Trường CĐ Cơ điện Hà Nội [Mới nhất]](https://cdn.tailieu.vn/images/document/thumbnail/2026/20260323/lionelmessi01/135x160/58171774381670.jpg)


![Giáo trình Tiện nâng cao (Nghề Cắt gọt kim loại, Trình độ Cao đẳng) - Trường Cao đẳng Cơ điện Hà Nội [Mới nhất]](https://cdn.tailieu.vn/images/document/thumbnail/2026/20260323/lionelmessi01/135x160/48101774403543.jpg)


