
International Journal of Engineering Studies
ISSN 0975- 6469 Volume 1, Number 3 (2009), pp. 149–160
© Research India Publications
http://www.ripublication.com/ijes.htm
Optimization of Cost by Using 7 QC Tools
Nitin K. Mandavgade¹ and Santosh. B. Jaju²
Department of Mechanical Engineering, G. H. Raisoni College of Engineering,
CRPF Gate No.3, Digdoh Hills, Hingna Road, Nagpur 440016 (India).
1E-mail: nitin_man@rediffmail.com and 2E-mail: sbjaju@gmail.com
Abstract
Quality plays very important role in today’s highly competitive industrial
environment. Quality leads to an improvement in productivity. By improving
quality, the method of optimization reduces process operational costs and
variation in product. Quality, productivity & cost of operation relatively
depended to each other. The main goals of quality management are customer
satisfaction by delivery of defect free products at quality cost. Controlled
processes are the most important ways to reach this goal. The primary
objective of quality control in any organization is to reduce the costs of its
operation. If control efforts do not lead to any saving in costs or cost reduction
then, in principle there is no need for quality control. However, in most control
activities, cost saving are real and they remain a principle objective of quality
control for most organizations.
Keywords: Quality, quality control, cost optimization, inspection.
Introduction to quality control
Many companies in the world are gradually promoting quality as the central customer
value and regard it as a key concept of company strategy in order to achieve the
competitive edge. Quality improvement decisions are viewed as the catalyst for
substantial technological developments being made in the manufacturing sector.
Quality Costs are a measure of the costs specifically associated with the achievement
or non-achievement of product or service quality –including all product or service
requirements established by the company and its contract with customers and society.
Measuring and reporting the quality cost is the first step in a quality management
program. Quality costs allow us to identify the soft targets to which improvement
efforts can be applied.

150 Nitin K. Mandavgade and Santosh. B. Jaju
Three types of cost are generally associated with quality control:
1. Assignment costs.
2. Prevention costs.
3. Non-conformance costs.
Assignment costs are the cost which an organization incurs in measuring quality
characteristics to ensure that they conform to quality standards. This cost typically
includes costs of inspection including labour , materials, and cost of approval or
certification when organizations meet quality standards and so on. Prevention costs
involve cost when organizations undertake measures to prevent poor quality of
products or performance. Example of prevention cost would include the costs
associated with quality planning, design and development of quality measurement
instruments, quality training and so on. Finally non conformance costs also called
failure costs occur when an organization fails to meet quality standards. This may be
due to poor quality of labour, materials and overhead, i.e. expenses accumulated.
Seven Quality Control Tools
The various tools are used to check the quality of the product to define weather the
product is a quality one or not and to take the further necessary actions to bring the
process under control.
• Check sheet
• Pareto chart
• Flow chart
• Cause and effect diagram
• Histogram
• Scatter diagram
• Control chart
Check sheet
The function of a check sheet is to present information in an efficient, graphical
format. This may be accomplished with a simple listing of items. However, the utility
of the check sheet may be significantly enhanced in some instances by incorporating a
depiction of the system under analysis into the form.
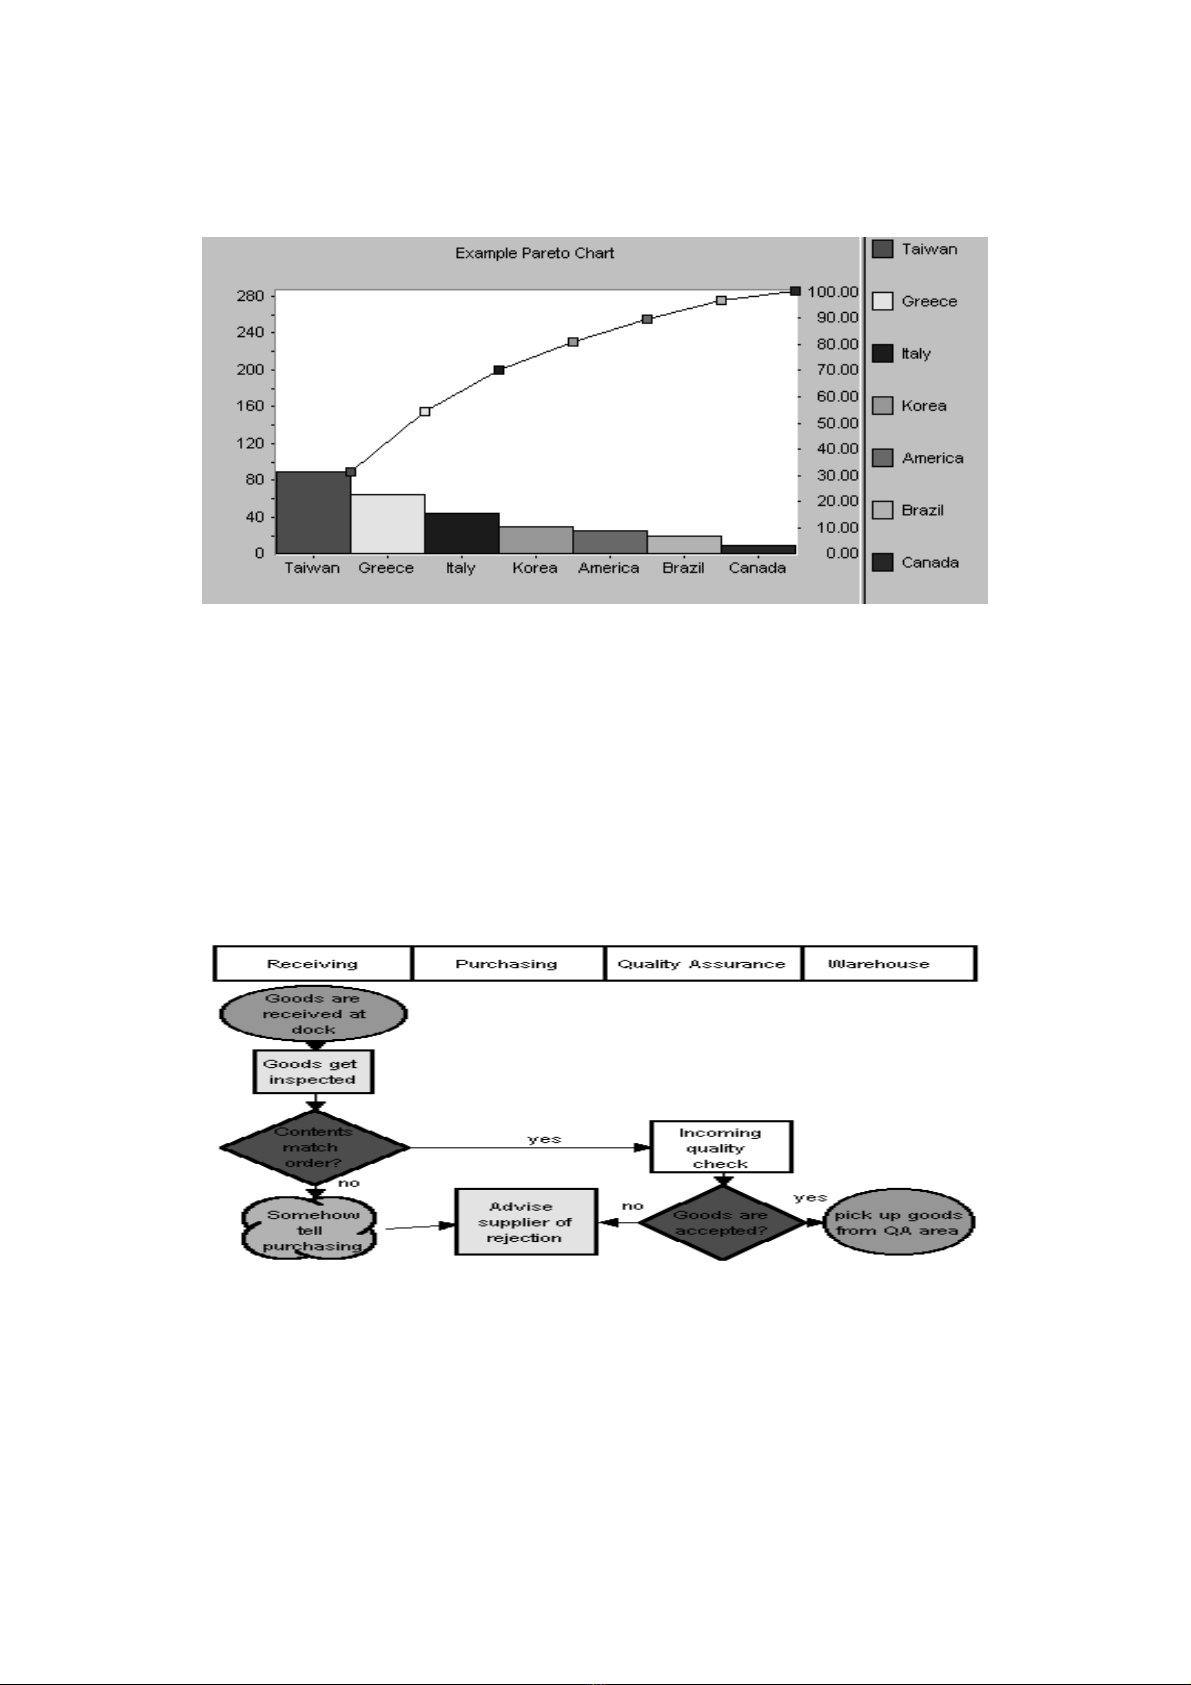
Pareto Chart
Pareto charts are extremely useful because they can be used to identify those factors
that have the greatest cumulative effect on the system and thus screen out the less
significant factors in an analysis.
Ideally, this allows the user to focus attention on a few important factors in a
process.
Optimization of Cost by Using 7 QC Tools 151
Figure 1: Pareto Chart.
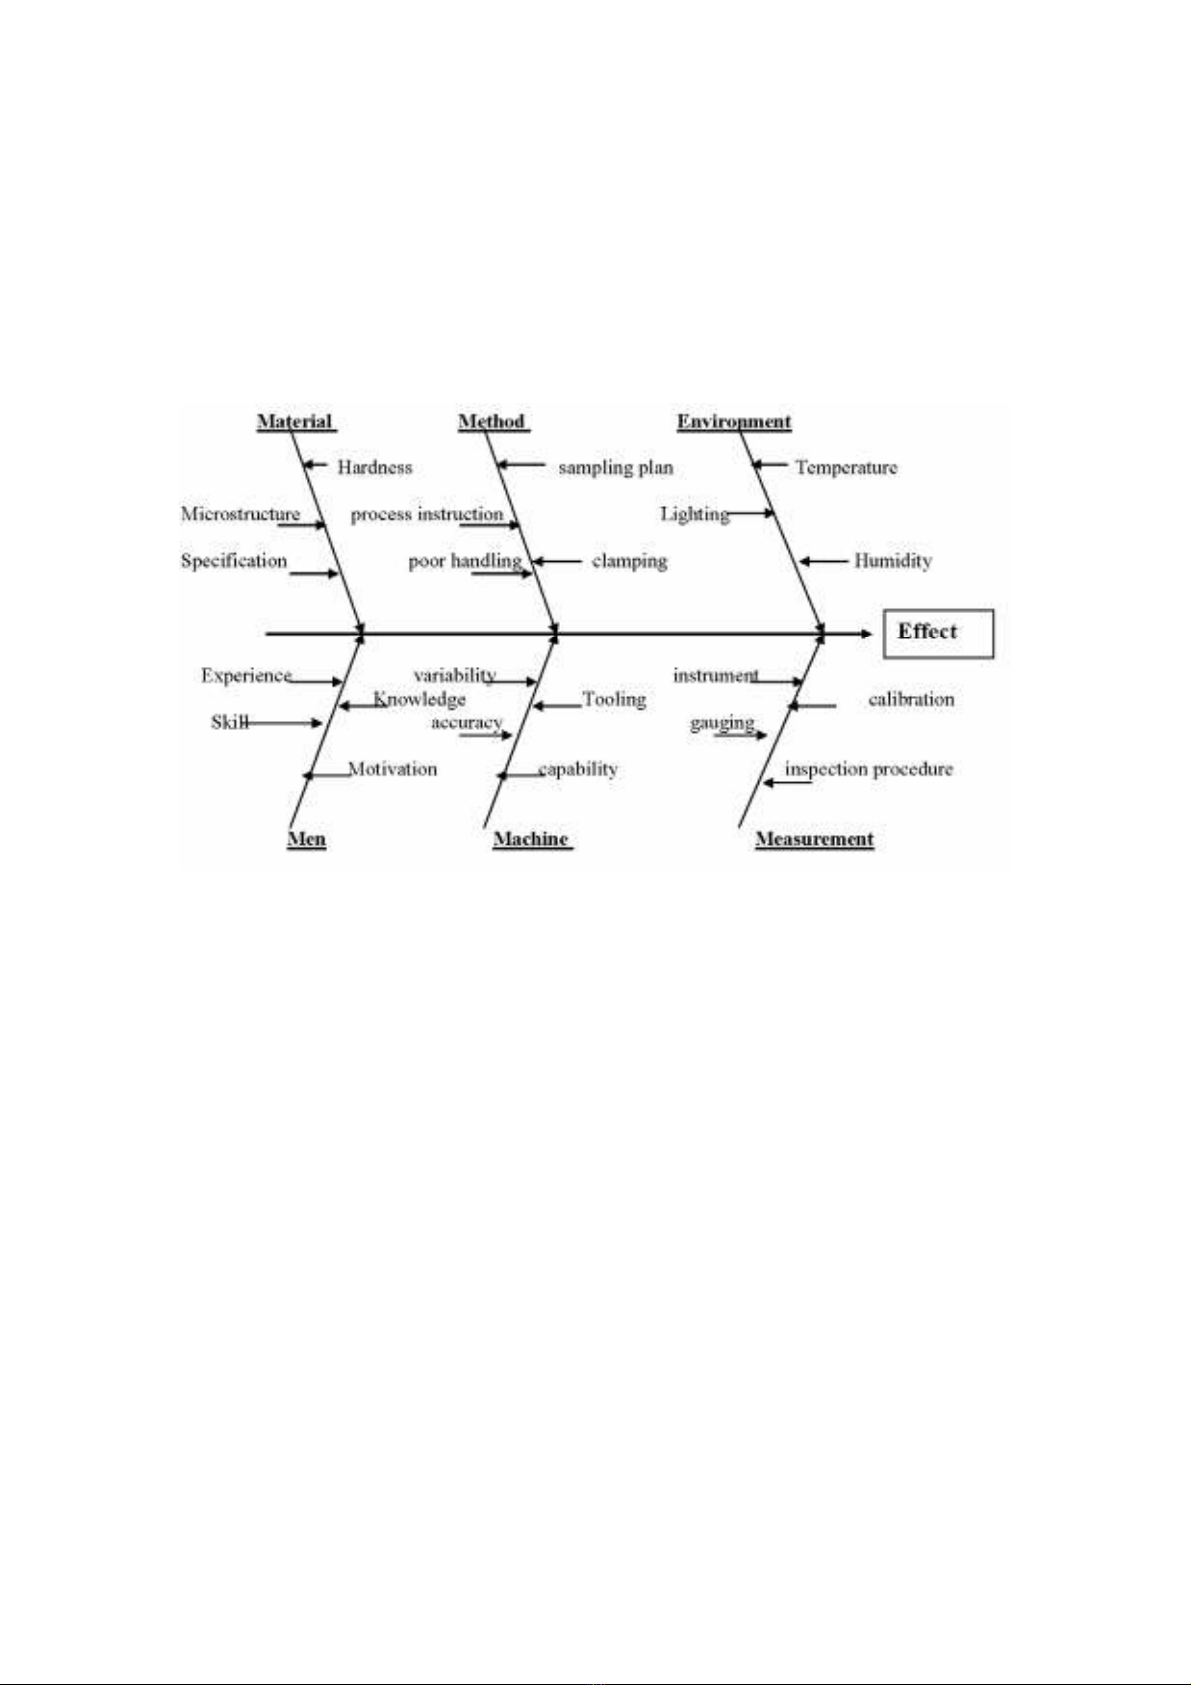
Flowchart
Flowcharts are pictorial representations of a process. By breaking the process down
into its constituent steps, flowcharts can be useful in identifying where errors are
likely to be found in the system. In quality improvement work, flowcharts are
particularly useful for displaying how a process currently functions or could ideally
function.
Figure 2: Flowchart.
152 Nitin K. Mandavgade and Santosh. B. Jaju
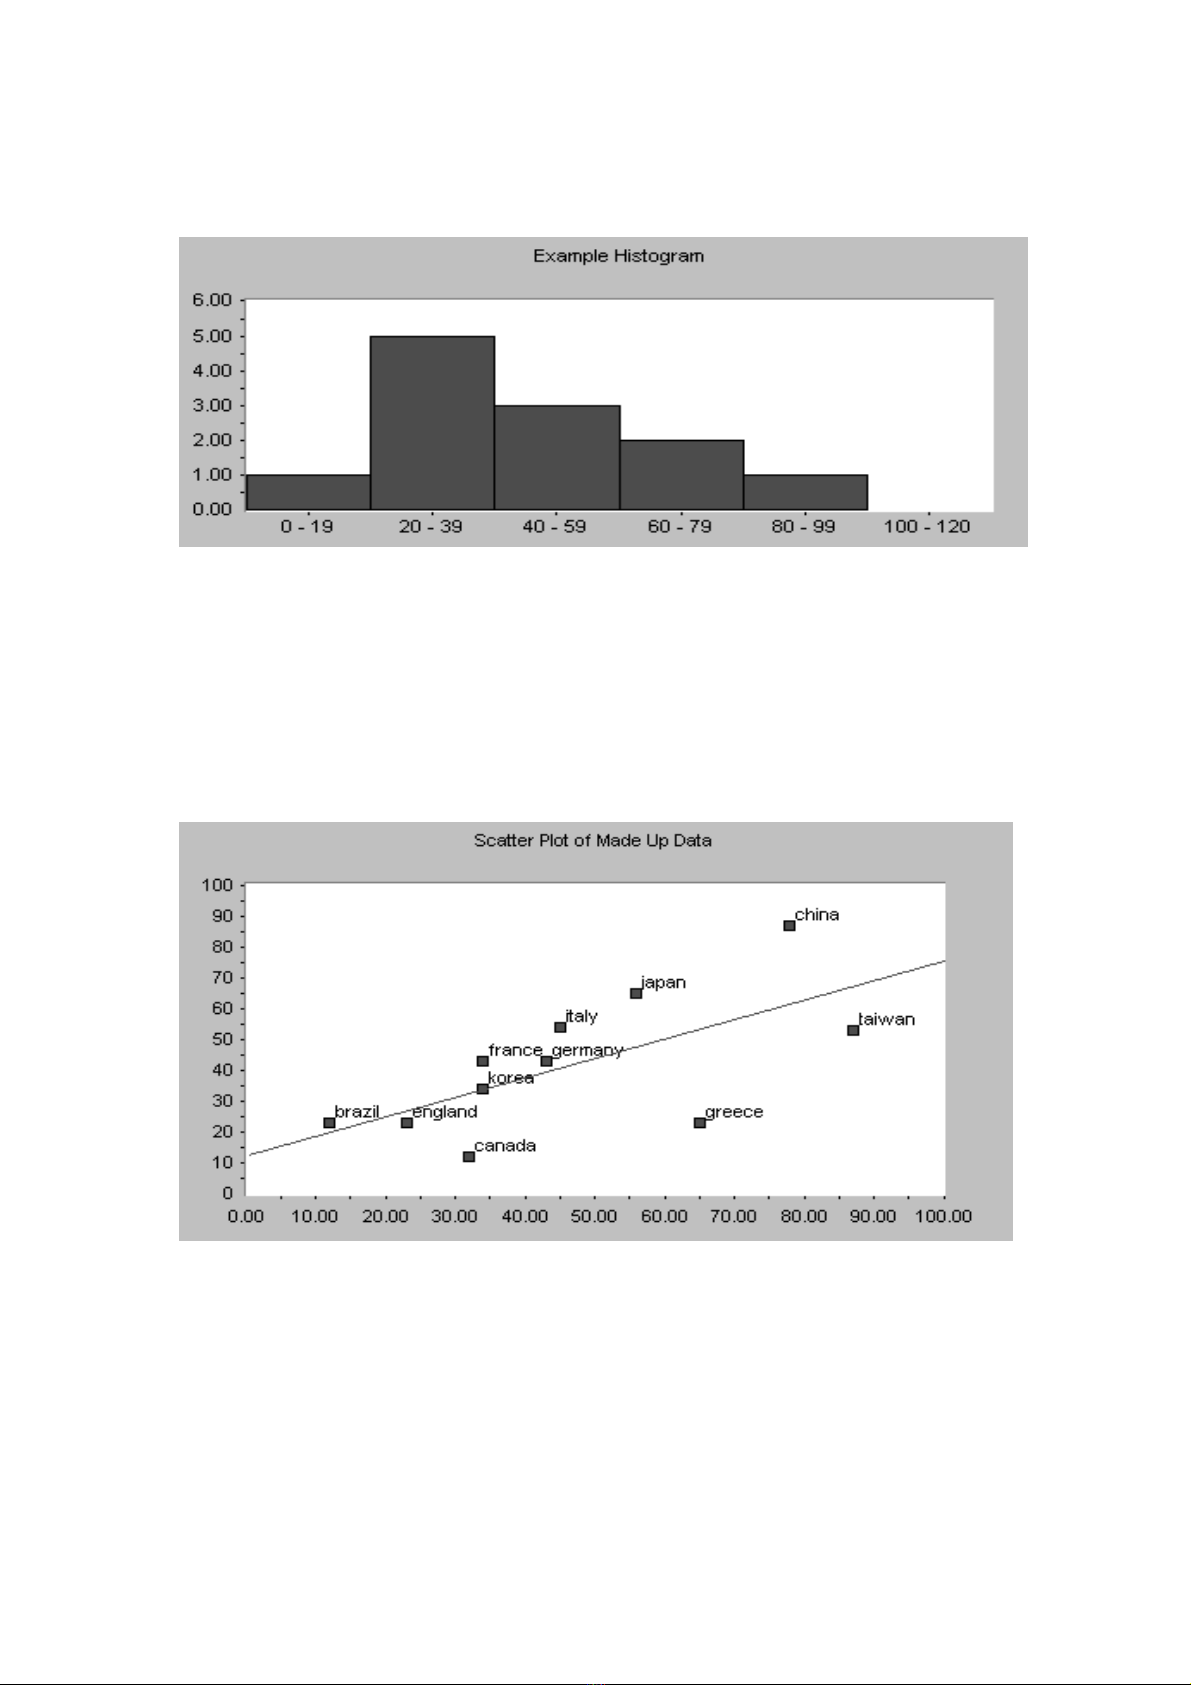
Cause and Effect Diagram
This diagram, also called an Ishikawa diagram (or fish bone diagram) is used to
associate multiple possible causes with a single effect. Thus, given a particular effect,
the diagram is constructed to identify and organize possible causes for it.
Figure 3: Cause and effect Diagram.
Causes in a cause & effect diagram are frequently arranged into four major
categories. While these categories can be anything, given below:
• Manpower, methods, materials, and machinery (recommended for
manufacturing)
• Equipment, policies, procedures, and people (recommended for administration
and service).
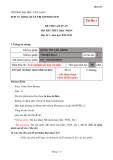
Histogram
A histogram is a specialized type of bar chart. Individual data points are grouped
together in classes, so that you can get an idea of how frequently data in each class
occur in the data set. Histograms provide a simple, graphical view of accumulated
data.
Optimization of Cost by Using 7 QC Tools 153
Figure 4: Histogram.
Scatter Diagram
Scatter diagrams are graphical tools that attempt to depict the influence that one
variable has on another. A common diagram of this type usually displays points
representing the observed value of one variable corresponding to the value of another
variable.
Figure 5: Scatter Diagram.
Control Chart
The control chart is the fundamental tool of statistical process control as it
indicates the range of variability that is built into a system (known as common
cause variation). Thus, it helps determine whether or not a process is operating


![Giáo trình Xếp dỡ và bảo quản hàng hóa: Phần 1 [Mới nhất]](https://cdn.tailieu.vn/images/document/thumbnail/2016/20160315/codon_08/135x160/1087092316.jpg)


![Trắc nghiệm Khai báo hải quan [Mới nhất]](https://cdn.tailieu.vn/images/document/thumbnail/2026/20260512/hoangpeachh15@gmail.com/135x160/33541778640243.jpg)


![Tài liệu học tập Giao nhận và vận tải quốc tế [mới nhất/chuẩn nhất]](https://cdn.tailieu.vn/images/document/thumbnail/2026/20260512/vailocay@gmail.com/135x160/47361778640245.jpg)

![Giáo trình Quản trị kho hàng - Trường Cao đẳng Giao thông Vận tải đường thuỷ II [Mới nhất]](https://cdn.tailieu.vn/images/document/thumbnail/2026/20260507/hoahongxanh0906/135x160/47611778489720.jpg)


%20--%3e%3cdefs%3e%3cstyle%3e%20.st0%20{%20fill:%20%23fff;%20}%20.st1%20{%20fill:%20%237800fa;%20}%20%3c/style%3e%3c/defs%3e%3cpath%20class='st1'%20d='M117.78,12.18H43.11c2.9,3.47,4.65,7.94,4.65,12.82,0,5.6-2.3,10.66-6.01,14.29h76.02l7.22-13.56-7.22-13.56Z'/%3e%3cg%3e%3cpath%20class='st0'%20d='M53.58,26.17h-.59v-1.46h.59v-4.96h2.83c1.78,0,2.67.94,2.67,2.82v5.76c0,1.87-.89,2.81-2.67,2.81h-2.83v-4.96ZM55.36,21.37v3.34h1.1v1.46h-1.1v3.34h1.01c.61,0,.91-.37.91-1.1v-5.93c0-.74-.3-1.1-.91-1.1h-1.01Z'/%3e%3cpath%20class='st0'%20d='M65.99,31.14h-1.8l-.31-2.07h-2.19l-.31,2.07h-1.64l1.82-11.39h2.62l1.82,11.39ZM65.28,18.04c-.25.46-.51.77-.75.94-.21.15-.47.22-.79.22-.26,0-.57-.07-.92-.22l-.38-.15c-.14-.05-.26-.07-.37-.07-.3,0-.53.18-.71.54l-.91-.68c.25-.46.51-.77.75-.94.21-.14.48-.21.79-.21.26,0,.57.07.92.21l.38.15c.14.05.26.07.37.07.3,0,.53-.18.71-.54l.91.68ZM61.91,27.52h1.73l-.87-5.76-.87,5.76Z'/%3e%3cpath%20class='st0'%20d='M74.53,26.89v1.52c0,1.91-.89,2.86-2.67,2.86s-2.67-.95-2.67-2.86v-5.93c0-1.91.89-2.86,2.67-2.86s2.67.95,2.67,2.86v1.11h-1.69v-1.22c0-.75-.31-1.12-.93-1.12s-.93.37-.93,1.12v6.15c0,.74.31,1.11.93,1.11s.93-.37.93-1.11v-1.63h1.69Z'/%3e%3cpath%20class='st0'%20d='M81.4,31.14h-1.8l-.31-2.07h-2.19l-.31,2.07h-1.64l1.82-11.39h2.62l1.82,11.39ZM75.9,19.2l1.52-1.91h1.71l1.51,1.91h-1.61l-.76-.95-.75.95h-1.61ZM77.32,27.52h1.73l-.87-5.76-.87,5.76ZM83.1,15.99l-1.76,1.91h-1.26l1.17-1.91h1.86Z'/%3e%3cpath%20class='st0'%20d='M84.86,19.75c1.78,0,2.67.94,2.67,2.82v1.48c0,1.87-.89,2.81-2.67,2.81h-.85v4.28h-1.79v-11.39h2.64ZM84.01,21.37v3.86h.85c.58,0,.87-.36.87-1.08v-1.71c0-.71-.29-1.07-.87-1.07h-.85Z'/%3e%3cpath%20class='st0'%20d='M93.51,19.75c1.78,0,2.67.94,2.67,2.82v1.48c0,1.87-.89,2.81-2.67,2.81h-.85v4.28h-1.79v-11.39h2.64ZM92.66,21.37v3.86h.85c.58,0,.87-.36.87-1.08v-1.71c0-.71-.29-1.07-.87-1.07h-.85Z'/%3e%3cpath%20class='st0'%20d='M98.8,31.14h-1.79v-11.39h1.79v4.88h2.03v-4.88h1.83v11.39h-1.83v-4.88h-2.03v4.88Z'/%3e%3cpath%20class='st0'%20d='M105.36,24.55h2.46v1.62h-2.46v3.34h3.09v1.63h-4.88v-11.39h4.88v1.63h-3.09v3.18ZM108.17,17.29l-1.76,1.91h-1.26l1.17-1.91h1.86Z'/%3e%3cpath%20class='st0'%20d='M112.2,19.75c1.78,0,2.67.94,2.67,2.82v1.48c0,1.87-.89,2.81-2.67,2.81h-.85v4.28h-1.79v-11.39h2.64ZM111.35,21.37v3.86h.85c.58,0,.87-.36.87-1.08v-1.71c0-.71-.29-1.07-.87-1.07h-.85Z'/%3e%3c/g%3e%3ccircle%20class='st1'%20cx='25'%20cy='25'%20r='20'/%3e%3cpath%20class='st0'%20d='M32.78,19.27c2.92,0,4.43,2.55,5.28,5.33l.71,2.17c.14.38-.33.75-.71.75h-5.61c.19-.33.24-.71.09-1.08l-.75-2.45c-.43-1.32-.99-2.64-1.79-3.77.75-.57,1.65-.94,2.78-.94h0ZM25,18.38c3.25,0,4.9,2.78,5.89,5.89l.76,2.45c.14.42-.33.8-.8.8h-11.69c-.42,0-.94-.38-.8-.8l.75-2.45c.99-3.11,2.64-5.89,5.89-5.89h0ZM25,11.35c1.74,0,3.11,1.37,3.11,3.11s-1.37,3.11-3.11,3.11-3.11-1.41-3.11-3.11,1.41-3.11,3.11-3.11h0ZM17.27,19.27c1.08,0,1.98.38,2.73.94-.8,1.13-1.37,2.45-1.74,3.77l-.8,2.45c-.14.38-.05.75.09,1.08h-5.56c-.42,0-.9-.38-.75-.75l.71-2.17c.9-2.78,2.41-5.33,5.33-5.33h0ZM17.27,12.91c1.51,0,2.78,1.27,2.78,2.83s-1.27,2.83-2.78,2.83-2.83-1.27-2.83-2.83,1.27-2.83,2.83-2.83h0ZM32.78,12.91c1.56,0,2.78,1.27,2.78,2.83s-1.23,2.83-2.78,2.83-2.83-1.27-2.83-2.83,1.27-2.83,2.83-2.83h0ZM27.07,28.56v.09c0,.57-.24,1.08-.61,1.46h0v.05c-.38.33-.9.57-1.46.57s-1.08-.24-1.46-.61h0c-.38-.38-.61-.9-.61-1.46v-.09h1.41v.09c0,.19.05.38.19.47v.05c.09.09.28.19.47.19s.38-.09.47-.19v-.05c.14-.09.24-.28.24-.47t-.05-.09h1.41ZM30.99,28.56v.09c0,1.65-.66,3.16-1.74,4.24-1.08,1.08-2.59,1.79-4.24,1.79s-3.16-.71-4.24-1.79l-.05-.05c-1.04-1.08-1.7-2.55-1.7-4.2v-.09h1.41v.09c0,1.27.47,2.4,1.27,3.25h.05c.85.85,1.98,1.37,3.25,1.37s2.4-.52,3.25-1.37c.85-.8,1.37-1.98,1.37-3.25v-.09h1.37ZM34.99,28.56v.09c0,2.78-1.13,5.28-2.92,7.07-1.79,1.79-4.29,2.92-7.07,2.92s-5.23-1.13-7.07-2.92c-1.79-1.79-2.92-4.29-2.92-7.07v-.09h1.41v.09c0,2.4.94,4.53,2.5,6.08,1.56,1.56,3.72,2.5,6.08,2.5s4.52-.94,6.08-2.5c1.56-1.56,2.5-3.68,2.5-6.08v-.09h1.41Z'/%3e%3c/svg%3e)