
Journal of Science and Transport Technology Vol. 3 No. 1, 26-43
Journal of Science and Transport Technology
Journal homepage: https://jstt.vn/index.php/en
JSTT 2023, 3 (1), 26-43
Published online 30/03/2023
Article info
Type of article:
Original research paper
DOI:
https://doi.org/10.58845/jstt.utt.2
023.en.3.1.26-43
*Corresponding author:
E-mail address:
banglh@utt.edu.vn
Received: 27/02/2023
Revised: 22/03/2023
Accepted: 24/03/2023
Predicting rubberized concrete compressive
strength using machine learning: A feature
importance and partial dependence analysis
Mahdi Hasanipanah1, Rini Asnida Abdullah1, Mudassir Iqbal2,3, Hai-Bang Ly4*
1Universiti Teknologi Malaysia, Johor Bahru, Malaysia.
2Jiao Tong University, Shanghai 200240, China.
3University of Engineering and Technology Peshawar, Pakistan.
4University of Transport Technology, Hanoi 100000, Vietnam.
Abstract: Rubberized concrete is a material that is both ecologically friendly
and sustainable, and it has been finding more and more usage in building
applications recently. In this study, a machine learning model, namely
LightGBM, is developed to predict rubberized concrete's compressive strength
(CS) using 11 input parameters. The model's performance is measured using
several different statistical criteria after being trained on a dataset containing
275 samples. In order to evaluate the impact that each input parameter has on
the CS, feature importance and partial dependency plots (PDP) are used as
analytical tools. According to the findings, the superplasticizer, chipped rubber,
crumb rubber, coarse aggregate, fine aggregate, and water content all have a
significant impact on the CS of rubberized concrete. On the other hand, the
results indicate that the cement content, slag/fly ash content, and type of CS
have a relatively minor effect. In addition to this, the PDP offers insights into
the manner in which the input parameters affect the CS of rubberized concrete.
Overall, the developed model and analytic techniques may be helpful in
forecasting the CS of rubberized concrete and improving its mix design for
various construction applications.
Keywords: Compressive strength; LightGBM; Rubberized concrete.
1. Introduction
Waste rubber tires are a mounting
environmental concern that demands attention [1].
Made of synthetic rubber, a petroleum-based
material that refuses to decompose, these tires
pose a long-lasting threat to the environment [2].
Fortunately, the construction industry can play a
vital role in reducing the impact by harnessing the
power of recycled rubber in building materials like
concrete and asphalt [3,4]. This not only lowers the
number of raw materials required, but also
minimizes the quantity of waste tires deposited into
the surrounding environment. Rubberized
concrete, a green alternative made by blending
ground rubber tires into the concrete mixture,
boasts remarkable properties, including enhanced
shock absorption, sound-deadening, resistance to
wear and abrasion, and lower thermal conductivity,
leading to improved energy efficiency in
infrastructure [5,6].
Despite its promise, the comprehensive
understanding of rubberized concrete's properties
and performance remains limited. Further research
and experimentation are necessary to unlock its full

JSTT 2023, 3 (1), 26-43
Ly et al
27
potential for use in construction. Compressive
strength, denoted CS, is a measure of a material's
capacity to withstand given stresses and persist
without failure. This critical property, which
determines a concrete's structural performance
and resistance to cracking and deformation, must
be evaluated to assess rubberized concrete's
suitability for construction. The CS of rubberized
concrete is influenced by several elements,
including the kind of rubber particles used, their
size, the quantity of rubber in the mixture, the
length of time it is allowed to cure, and the other
components that are included in the mixture.
Traditional approaches to determining the
CS of rubberized concrete include performing
compression tests on cylindrical or cubic
specimens, and following standardized procedures
for preparing and testing the specimens. In an
effort to reduce the use of sand in concrete
production, Pelisser et al. examine the feasibility of
using used tire rubber as a substitute for sand
aggregate [7], with a reduction of 14% (28 days) in
CS compared to conventional concrete and a CS
of 48 MPa for the mixture with the highest
resistance, and improved mechanical properties
due to alkaline activation and silica fume addition.
Turatsinze et al. [8] showed that rubber aggregates
in cement composites offered a more effective
strategy for reducing fragility and avoiding
shrinkage cracking, with a 20-30% replacement of
natural sand aggregates. The advantages of fiber
reinforcing and rubber integration may be realized
concurrently due to the substantial reduction in the
modulus of elasticity and substantial rise in the
pseudo-strain corresponding to the peak load of
the cement composites. Besides, Khaloo et al. [9]
looked at the possibility of using tire rubber
particles to substitute mineral aggregates in
concrete, and found that although this did diminish
the strength and modulus of elasticity, it also
considerably decreased the brittle behavior,
fracture width, and crack propagation velocity. Self-
Compacting Concrete (SCC) with rubber
aggregates as a partial replacement for natural
aggregates was studied by Turatsinze and Garros
[10], who found that the composite's modulus of
elasticity was reduced while its strain capacity was
increased, highlighting the composite's potential
application in situations requiring high resistance to
cracking due to imposed deformation. Rubcrete
blends have fascinating features that may be
beneficial in both structural applications and
environmental remediation, as researched by
Sgobba et al. [11], thanks to an acceptable CS.
Overall, rubberized concrete made by combining
recycled rubber and concrete aggregates was
found to have lower strength than conventional
concrete, rendering it unsuitable, particularly for
structural applications. Rubberized concrete has
been found to be more suitable for paving
applications, as the required strength in such
applications falls in a lower range [12,13]. When
rubber particles are used as a partial substitute for
traditional aggregates, the CS of the resulting
rubberized concrete deteriorates in inverse
proportion to the rubber percentage [14–17]. It has
been discovered that the CS of rubberized
concrete is drastically altered by incorporating
rubber particles in concrete. As rubber content
rises, CS of the rubberized concrete lowers. The
reason is that rubber particles are less dense than
typical aggregates [18], resulting in a less
compacted and weaker concrete structure. The
extent of the reduction in CS varies depending on
the type and content of the rubber particles used.
Although the CS of rubberized concrete is
often studied via experimental techniques, these
approaches have drawbacks, such as high cost,
lengthy testing, and variable findings influenced by
several variables, such as the type of rubber used,
mixing procedure, and curing time. Therefore, a
reliable and accurate method using the constituent
materials' properties and mixture proportions to
predict rubberized concrete's CS is necessary.
This could help reduce the time and cost involved
in testing and provide an effective way of assessing
rubberized concrete's CS for practical applications.
Recently, there has been a growing interest

JSTT 2023, 3 (1), 26-43
Ly et al
28
in using machine learning (ML) techniques in civil
engineering. These approaches have been
successfully applied in a wide range of
applications, including structural engineering [19],
geotechnical engineering [20–24], material
sciences [25,26]. Due to its capacity to evaluate
massive quantities of complex data and generate
accurate predictions that lead to better design and
decision-making, ML has shown to be a beneficial
tool for civil engineering applications. Light gradient
boosting algorithm (LightGBM), a recently
developed robust ML model, can be highly
advantageous when solving complex problems.
With its ability to handle large datasets and
optimize complex engineering processes, it is well-
suited to prediction tasks. However, it is important
to note that LightGBM has not been used
specifically to predict the CS of rubberized
concrete.
Therefore, the primary purpose of this
research is to create an ML model to reliably
forecast the CS of rubberized concrete, which can
potentially contribute to the development of
sustainable and environmentally friendly
construction materials. The use of ML techniques
can effectively address the limitations of
experimental approaches and provide a fast and
cost-effective means of predicting concrete
strength. A comprehensive dataset is compiled
from a review of previous studies and experimental
results to achieve this goal. The dataset, covering
275 samples, is then pre-processed to remove
outliers and ensure data quality. This study
represents a contribution to the field of concrete
materials science by adding a number of new
samples to the dataset, compared with [26], and
testing the feasibility of using LightGBM for
predicting the CS of rubberized concrete. This
algorithm is evaluated and finely tuned to select the
best-performing model. The model is trained on the
pre-processed data and validated using a range of
metrics to ensure its accuracy and reliability. The
developed model provides a reliable method for
estimating rubberized concrete's CS, thus enabling
the development of new construction materials that
are more sustainable and cost-effective.
2. Database collection
The compiled database consists of a total of
275 samples, which are sourced from 19 papers in
the relevant literature, including Guneyisi et al. [18],
Geosglu and Guneyisi [27], Batayneh et al. [2],
Zheng et al. [28], Ganjian et al. [29], Ozbay et al.
[30], Paine et al. [31], Ghedan and Hamza [32],
Bala et al. [33], Fiore et al. [34], Geosglu et al. [35],
Kumar et al. [36], Mohammed and Azmi [37],
Almaleeh et al. [38], Bharathi et al. [39], Abusharar
[40], Ishwariya [41], Liu et al. [42], and Asutkar et
al. [43]. The input space comprises 11 inputs, and
one output is represented by the CS (FC) feature.
Table 1 provides an easy-to-refer-to summary of
the database's information. The specimen type
variable is an important additional variable
considered in this study, used to indicate the size
of the concrete samples being tested for CS. This
variable ranges from 0 to 1, where a value of 0
represents cubic concrete samples with
dimensions of 1003 mm, and 1 represents cubic
concrete samples with dimensions of 1503 mm.
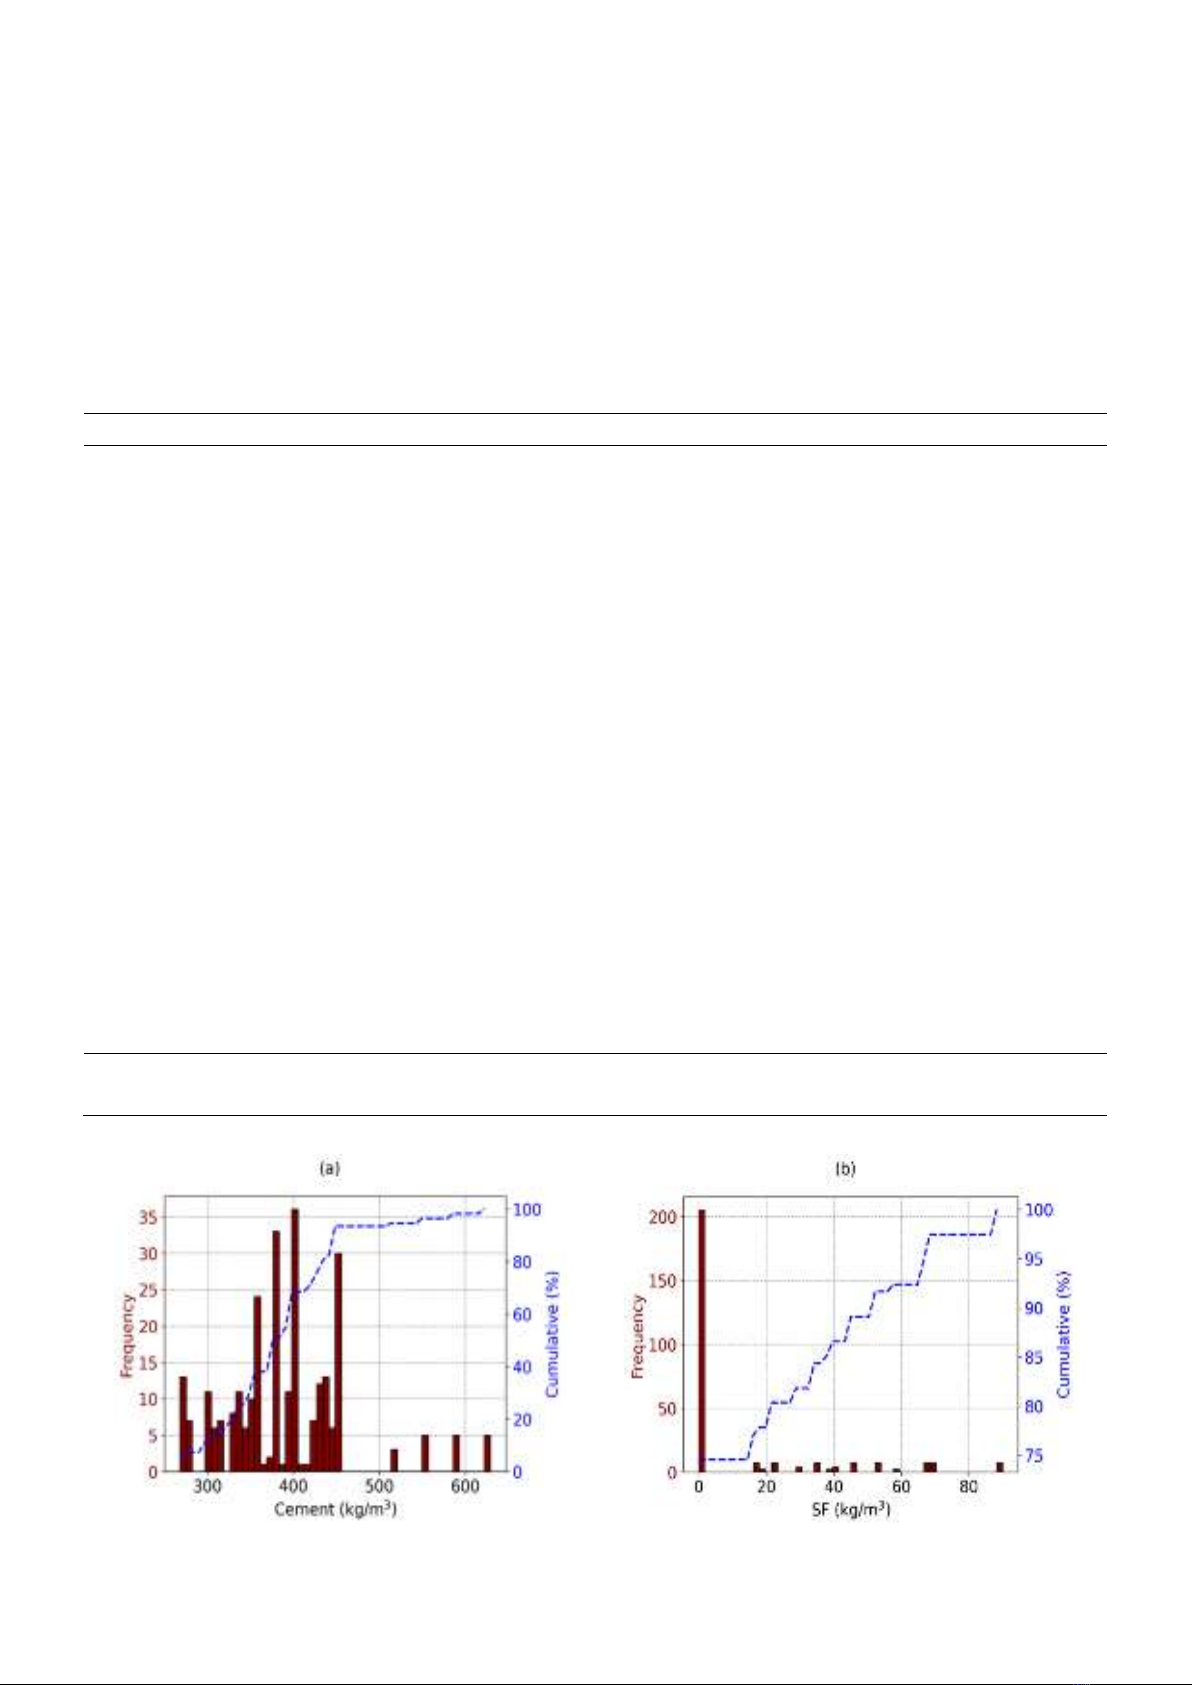
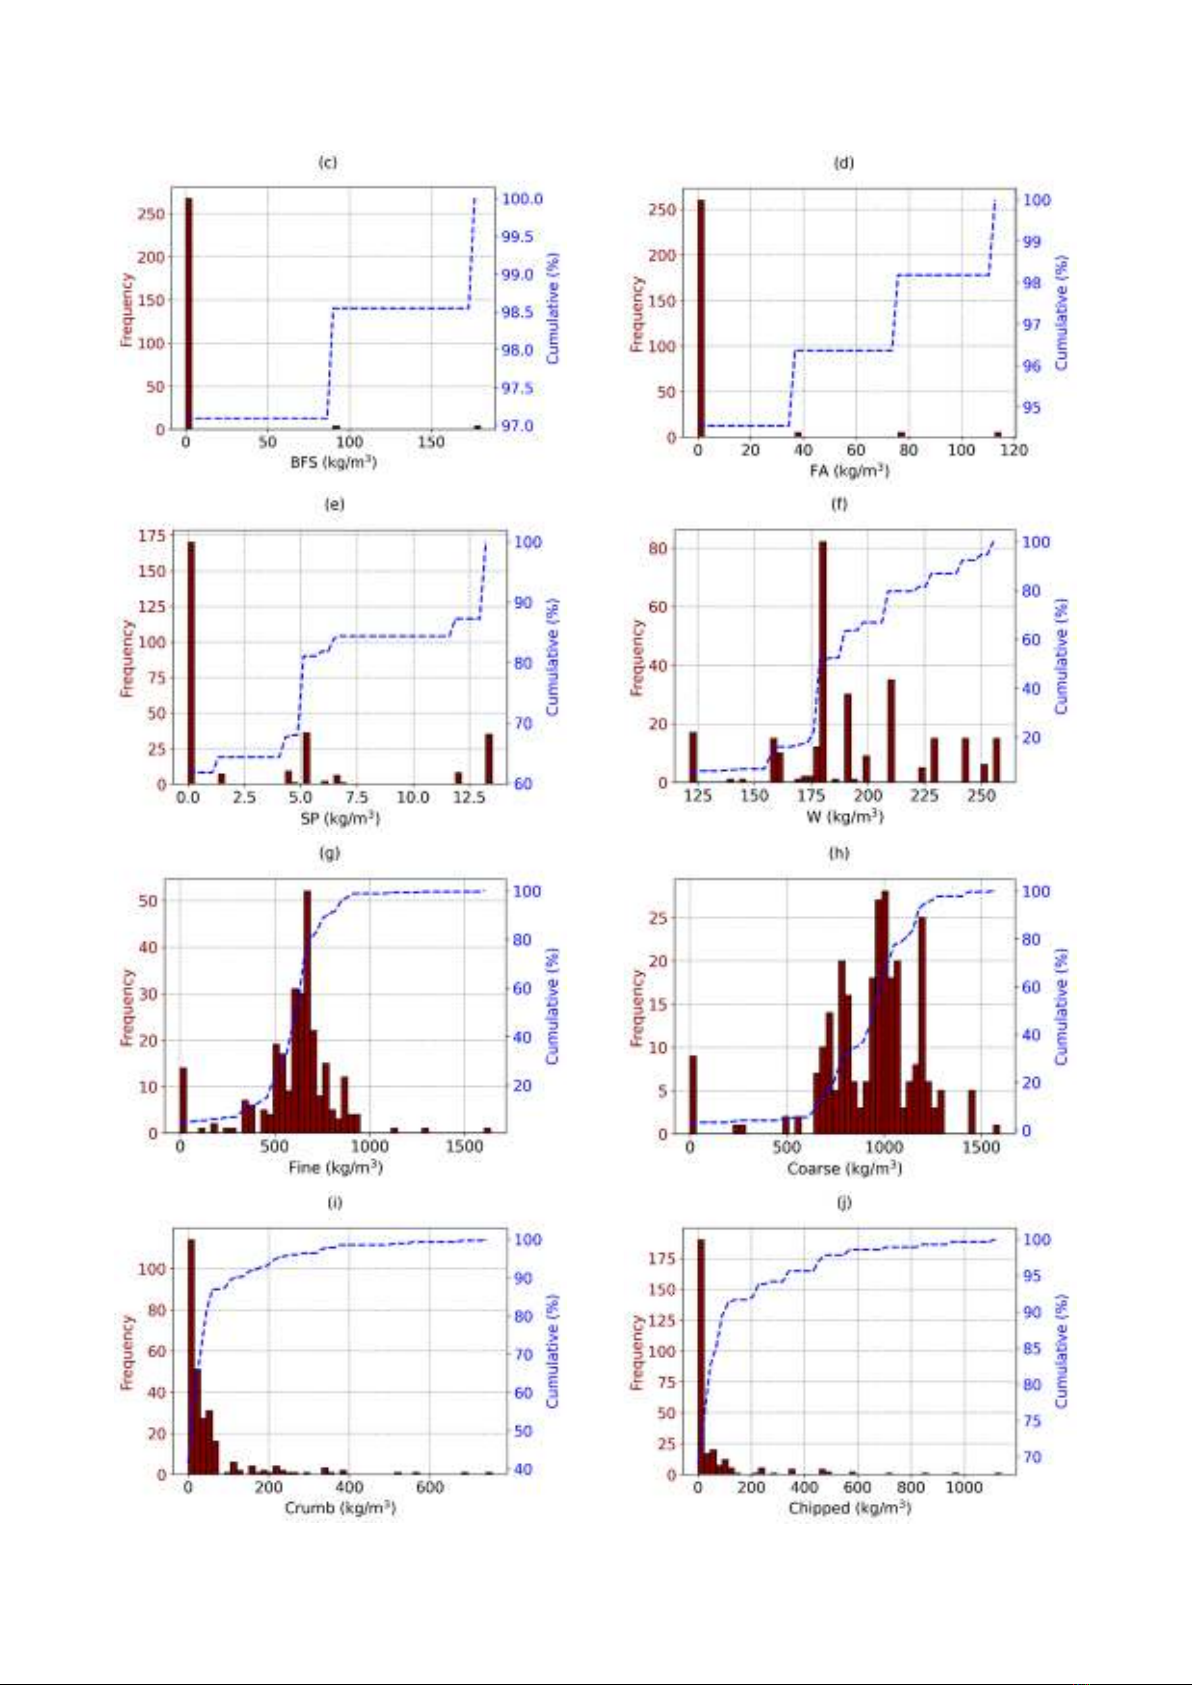
For each input variable, a histogram showing
the range of values is shown, along with its
cumulative distribution, is illustrated in Fig. 1. The
histogram facilitates the observation of the
concentration of values and any outliers present in
the data. The cumulative distribution, on the other
hand, allows for the analysis of the distribution's
shape and skewness, which is crucial in statistical
analysis.
The correlation analysis of all the features
present in the data space is depicted in Fig.2. The
visual representation provides insights into the
relationship between the inputs and the output and
helps identify the significant factors affecting the
output. Correlation analysis is a commonly used
tool for exploratory data analysis and feature
selection in data science and ML. It is observed
that the highest correlation concerning CS is
exhibited by variable SP, with a correlation
JSTT 2023, 3 (1), 26-43
Ly et al
29
coefficient (R) of 0.56, followed by SF, with a
coefficient of 0.39, and fine aggregate, with a
coefficient of 0.38. The correlation between input
variables is demonstrated to be highest between
crumb rubber and chipped rubber, with a
correlation of R=0.73, followed by the correlation
between SF and SP, which has a correlation of
R=0.63. According to the definition provided by
Tabachnick et al. [44], pairs of parameters
exhibiting strong correlations are characterized by
an absolute value of R greater than 0.75. The
correlation analysis performed in this study
indicates that the input space exhibits suitable
characteristics for creating ML model.
Table 1. Statistical characteristics of the input and output parameters in the database.
Parameter
Unit
Mean
Std
Min
Q25
Q50
Q75
Max
Inputs
Cement (Cement)
kg/m3
391.0
72.3
268.0
347.4
383.0
430.0
629.3
Silica Fume
(SF)
kg/m3
12.1
23.5
0.0
0.0
0.0
17.5
90.0
Blast Furnace Slag (BFS)
kg/m3
3.9
24.0
0.0
0.0
0.0
0.0
180.0
Fly Ash
(FA)
kg/m3
4.2
18.9
0.0
0.0
0.0
0.0
115.0
Superplasticizer (SP)
kg/m3
3.2
4.8
0.0
0.0
0.0
5.3
13.5
Water
(W)
kg/m3
192.4
32.9
121.5
180.0
180.0
210.0
258.0
Fine aggregate
(Fine)
kg/m3
609.0
209.0
0.0
544.1
645.5
692.5
1635.5
Coarse aggregate
(Coarse)
kg/m3
931.9
260.4
0.0
792.0
975.0
1069.2
1594.0
Crumb rubber
(Crumb)
kg/m3
53.2
99.8
0.0
2.7
24.3
54.5
754.0
Chipped rubber
(Chipped)
kg/m3
55.6
146.6
0.0
0.0
0.0
30.5
1138.0
Specimen type
(Type)
-
0.7
0.5
0.0
0.0
1.0
1.0
1.0
Output
Compressive strength (FC)
MPa
30.2
19.6
0.6
15.9
28.0
42.8
85.7
Std=Standard deviation;
JSTT 2023, 3 (1), 26-43
Ly et al
30


![Bài giảng Quản lý vận hành và bảo trì công trình xây dựng [chuẩn nhất]](https://cdn.tailieu.vn/images/document/thumbnail/2025/20251006/agonars97/135x160/30881759736164.jpg)


![Ngân hàng câu hỏi trắc nghiệm Sức bền vật liệu 1: [Mô tả/Định tính Thêm để Tăng CTR]](https://cdn.tailieu.vn/images/document/thumbnail/2025/20250920/kimphuong1001/135x160/6851758357416.jpg)


![Trắc nghiệm Kinh tế xây dựng [chuẩn nhất]](https://cdn.tailieu.vn/images/document/thumbnail/2025/20250920/kimphuong1001/135x160/32781758338877.jpg)
