
Journal of Science and Transport Technology Vol. 2 No. 4, 43-51
Journal of Science and Transport Technology
Journal homepage: https://jstt.vn/index.php/en
JSTT 2022, 2 (4), 43-51
Published online 30/12/2022
Article info
Type of article:
Original research paper
DOI:
https://doi.org/10.58845/jstt.utt.2
022.en.2.4.43-51
*Corresponding author:
E-mail address:
quantv@utt.edu.vn
Received: 09/12/2022
Revised: 21/12/2022
Accepted: 24/12/2022
Predicting tensile strength of cemented paste
backfill with aid of second order polynomial
regression
Trinh Quoc Ngo, Linh Quy Nguyen, Van Quan Tran*
University of Transport Technology, Ha Noi, Viet Nam
Abstract: The materials left behind after the process of separating an ore's
valuable fraction from the unprofitable fraction are known as tailings in the
mining industry. Mixing tailing, cement and water can create a new material
called Cemented paste backfill (CPB). Research and solve the problem of
predicting the tensile strength of cement paste backfill based on a polynomial
model combined with the Monte Carlo Simulation method. Three models were
built to evaluate performance. The optimal performance model is then used to
predict the tensile strength of cement paste backfill. The results indicate that
using the polynomial regression model has a satisfactory result for predicting
the tensile strength of cement paste backfill. The best performance of second
order polynomial regression model is evaluated by three metrics such as
R2=0.958, RMSE=33.211 kPa, MAE=29.097 kPa for testing part in predicting
the tensile strength of cemented paste backfill. Finally, the influence of
Cement/Tailings ratio and Solid content on the tensile strength on tensile
strength and importance is also evaluated with aid of the best performance of
second order polynomial regression model.
Keywords: Machine learning, cemented paste backfill, polynomial regression,
second order.
1. Introduction
In order to maintain a safe working
environment, provide a location for the disposal of
mill tailings, prevent/minimize surface subsidence
from occurring, and provide ground support for the
surrounding mine structures, the underground
mine openings made during ore production are
Cemented Paste Backfill (CPB) as mixing tailing,
cement and water using a suitable material [1]. The
design and application of various fill media have
seen major improvements in the previous few
decades, which has led to a rise in the use of paste
backfill on a global scale. By outperforming its
predecessors, such as hydraulically put backfill,
paste fill continues to advance this trend. However,
the tensile strength of the cement is extremely
important, it helps control cracks and adversely
affects the hardness or strength properties [2], [3].
Tensile strength is also related to the action of the
shear force on the surface. Tensile strength
prediction is a necessary step to enable the optimal
selection of materials for construction.
Fall et al. [4] reveal that tailings particle size
and density have a significant impact on the
performance properties (strength, cost, water
demand, and microstructure) of the paste backfill.
The tailings particle size, particularly the
proportions of fine tailings particles, was shown to
have a significant effect on the porosity of the paste
backfill and the pore size distribution within it, as

JSTT 2022, 2 (4), 43-51
Ngo et al
44
well as its water drainage ability and, as a result, its
strength development and water requirement for a
given consistency. It was also demonstrated that,
in addition to the overall porosity, the pore size
distribution has a significant impact on the strength
development of the cemented backfill. In the study,
Rakine et al. [5] indicate that paste strengthens as
cement or solids content and cure time rise.
Although there were considerable differences in
effective cohesion values for fill mixes, they
generally indicated an increase in cement
concentration, solids content, and curing time [6].
In addition to empirical studies, many studies
apply science and technology to support effective
and less expensive solutions to outstanding
problems. A significant area of artificial intelligence
study is machine learning, which gives machines
the capacity to learn and perform certain tasks.
People from all industries have been exposed to
and intend to employ machine learning as a result
of its rising popularity. Algorithms for machine
learning are capable of numerous tasks [7]–[9].
Zhang et al. [10] used Talbol gradation theory and
neural networks to analyze aggregate gradation in
order to obtain the ideal aggregate ratio. The root
mean square error (RMSE) of the prediction results
for the uniaxial compressive strength (UCS)
prediction model that employs the ISTM and
incorporates aggregates gradation is 0.0914, the
coefficient of determination (R2) is 0.9973, and the
variance account for (VAF) is 99.73. The sensitivity
analysis of various influencing factors on UCS
reveals that all four factors have a substantial effect
on UCS, and sensitivity is ranked as follows: The
cement content (0.9264)>the slurry concentration
(0.9179)>the aggregate gradation (waste rock
content) (0.9031)>the curing time (09031). Qi et al.
[11] reported in the study the excellent
performance of the GBM model achieving a strong
positive correlation between the predicted and
actual mechanical properties, with R values of
0.963, and 0.887, respectively, 0.886 and 0.899 for
the UCS, YS, E, and UTS datasets.
Many reports consider the effects of
mechanical walls on uniaxial compressive
strength, compressive strength. However, there is
no research on tensile strength, which is also an
important factor affecting the strength of materials.
The study is a complement to the studies of the
tensile strength of cement paste backfill gradually
becoming complete. Evaluate the reliability of the
proposed model and analyze the influence of the
components on the tensile strength. At the same
time, the study is also interested in the influence of
the components.
2. Machine learning approach
2.1. Description of database
The data used in the study included 77
samples for the Uniaxial Tensile Strength (UTS)
test used in the previous study by Qi et al. [12]. The
data includes 8 input variables: Gs, D10, D50, Cu,
Cc, Cement/Tailings, Solid content, and the output
variable Tensile Strength (TS). Where, Gs is the
specific gravity of the cemented paste backfill, D10
and D50 are the diameter of grain size (mm)
permits only 10% and 50% grain of tailing passing,
respectively, Cu is the uniform coefficient of tailing,
Cc is coefficient of curvature of tailing,
Cement/Tailing is the ratio of used cement and
tailing in CPB, and solid content is the percentage
of mix “cement and tailing” in CPB. To ensure that
the model accurately predicts the tensile strength
of the cement paste backfill, the input variables
include different contents.
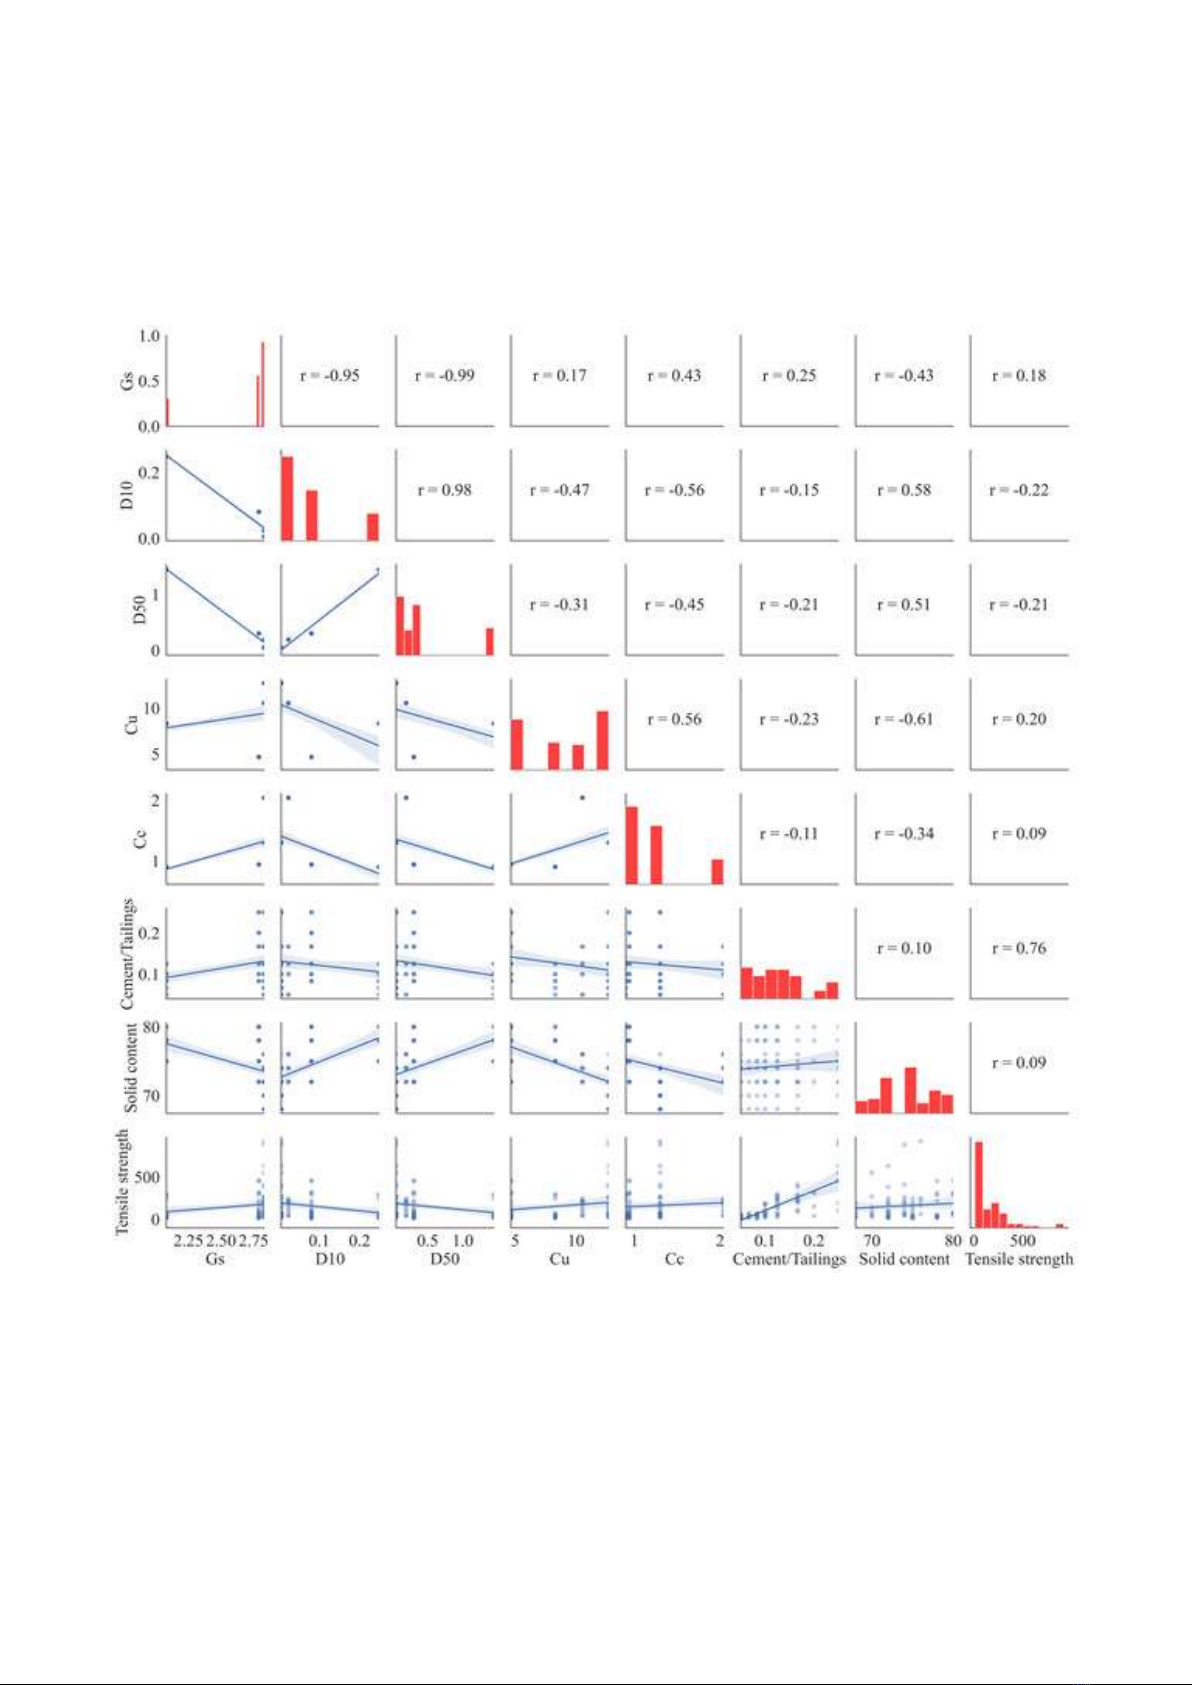
The correlation between the input variables
is shown by the correlation matrix in Figure 1.
Tensile strength and cement/tailing ratio have a
higher correlation than other factors with r=0.76.
Cu is more explanatory than Cc and Solid content,
based on their correlation coefficients, r=0.20 for
Cu and r=0.09 for Cc and Solid content. Observing
Figure 1, it can be seen that, Gs has almost no
statistically significant correlation with most of the
observed parameters. The measured correlation
coefficients show a strong correlation between the
parameters. There is a statistically significant
JSTT 2022, 2 (4), 43-51
Ngo et al
45
correlation between Gs and Cc with r=0.43. A
similar correlation is also found on other parameter
pairs such as between Cu and Cc with r=0.56, D10
and D50 with r=0.98. While other input parameters
have a relatively negative influence on the
cement/tailing ratio, solid content has a particularly
large positive influence on it. It can be seen that the
cement/tailing ratio has the most influence on
tensile strength and solid content has an important
effect on cement.
Figure 1. Simple analysis of database including the histogram of each feature and correlation between
input and output variable
2.2. Polynomial regression-linear regression
algorithm
Polynomial regression is a form of regression
model or analysis in which the relationship
between x and y variables is independent and
dependent variables are modeled as nth degree of
the polynomial. Polynomial regression speaks to
the fact that there is a polynomial relationship
between predictors and response variables
regardless of the number of features. Linear
regression is linear in the parameters, not the

JSTT 2022, 2 (4), 43-51
Ngo et al
46
variables. It is possible to perform any
transformation from them and still have a linear
model. Therefore, polynomial regression is a
special case of linear regression. Polynomial
regression is like multiple regression, when
performing polynomial regression just doing a
multiple regression with multiple transformations of
a single variable. Thus, the algorithm tells if a single
term is statistically significant also if a variable is
significant.
The polynomial equation is not unique, the
following is the most conventional polynomial
regression
( )
2
0 1 2 ... n
n
h x x x x
= + + + +
(1)
Treat
2
, ,..., n
x x x
as n variables. This is a
linear function of
0 1 2
, , ,..., n
Cost function
( )
( )
( )
2
01
1
1
, ,..., 2
n
ii
n
i
L h x y
n
=
=−
(2)
2.3. Performance metrics of model evaluation
Three metrics were utilized in this work to
assess the correctness of the created model,
namely correlation coefficient (R2), RMSE (Root
Mean Squared Error), and MAE (Mean Absolute
Error)
The rate of variation of the dependent
variable as a result of the combined variation of the
explanatory factors is represented by R2. The
predicted value is nearer to the goal value, and R2
is closer to 1. The MAE statistic measures the
average number of forecasting errors without
taking into account the direction of the errors. The
discrepancy between values predicted by a model
or estimator and the values observed is commonly
measured using the root mean square error
(RMSE). Given that its interpretation in terms of
relative inaccuracy is incredibly evident. The mean
model prediction error per unit of the desired output
is a characteristic of both the MAE and RMSE
criterion. The better the RMSE and MAR values are
compared to higher R2 scores.
( ) ( )
( )
22
211
2
1
NN
ex ex ex pre
k avg k k
kk
N
ex
k avg
k
val val val val
R
val val
==
=
− − −
=
−
(3)
( )
2
1
1N
ex pre
kk
k
RMSE val val
N=
=−
(4)
1ex pre
kk
MAE val val
N
=−
(5)
Where, N is the number of datasets, valexand
valavg
ex are the experimental value and mean
experimental value, respectively. valpreis the
predicted value by ML model.
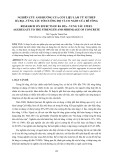
3. Result and discussion
3.1. Evaluating performance of polynomial
regression model
The three models PR1, PR2 and PR3 were
evaluated with data repeated 1000 times through
Monte-Carlo Simulation (MCS) randomization. To
verify the performance of different polynomial
models for predicting tensile strength, the data is
divided into two parts as training sample data and
test data. In Figure 2, different colors are used to
distinguish between the training data and the test
data of the polynomials. The PR1 model showed
lower performance than the PR2 and PR3 models.
The expected difference in performance indicators
of the PR2 and PR3 models is relatively small when
looking at Figure 2. For more insight, the values of
the performance indicators for the models are
shown. shown in Table 1 for the training dataset
and Table 2 for the testing dataset. According to
table 1, model PR2 has a smaller average R2 value
than PR3 (0.962<0.965), however, two values of
RMSE (34.156) and MAE (32.686) on average of
PR2 have more optimal value than PR3 model.
with model PR3 with the average RMSE, MAE
values are 32.686 and 25.024 respectively. In
addition, it can be seen that the standard deviation
of the two polynomial models on the training data
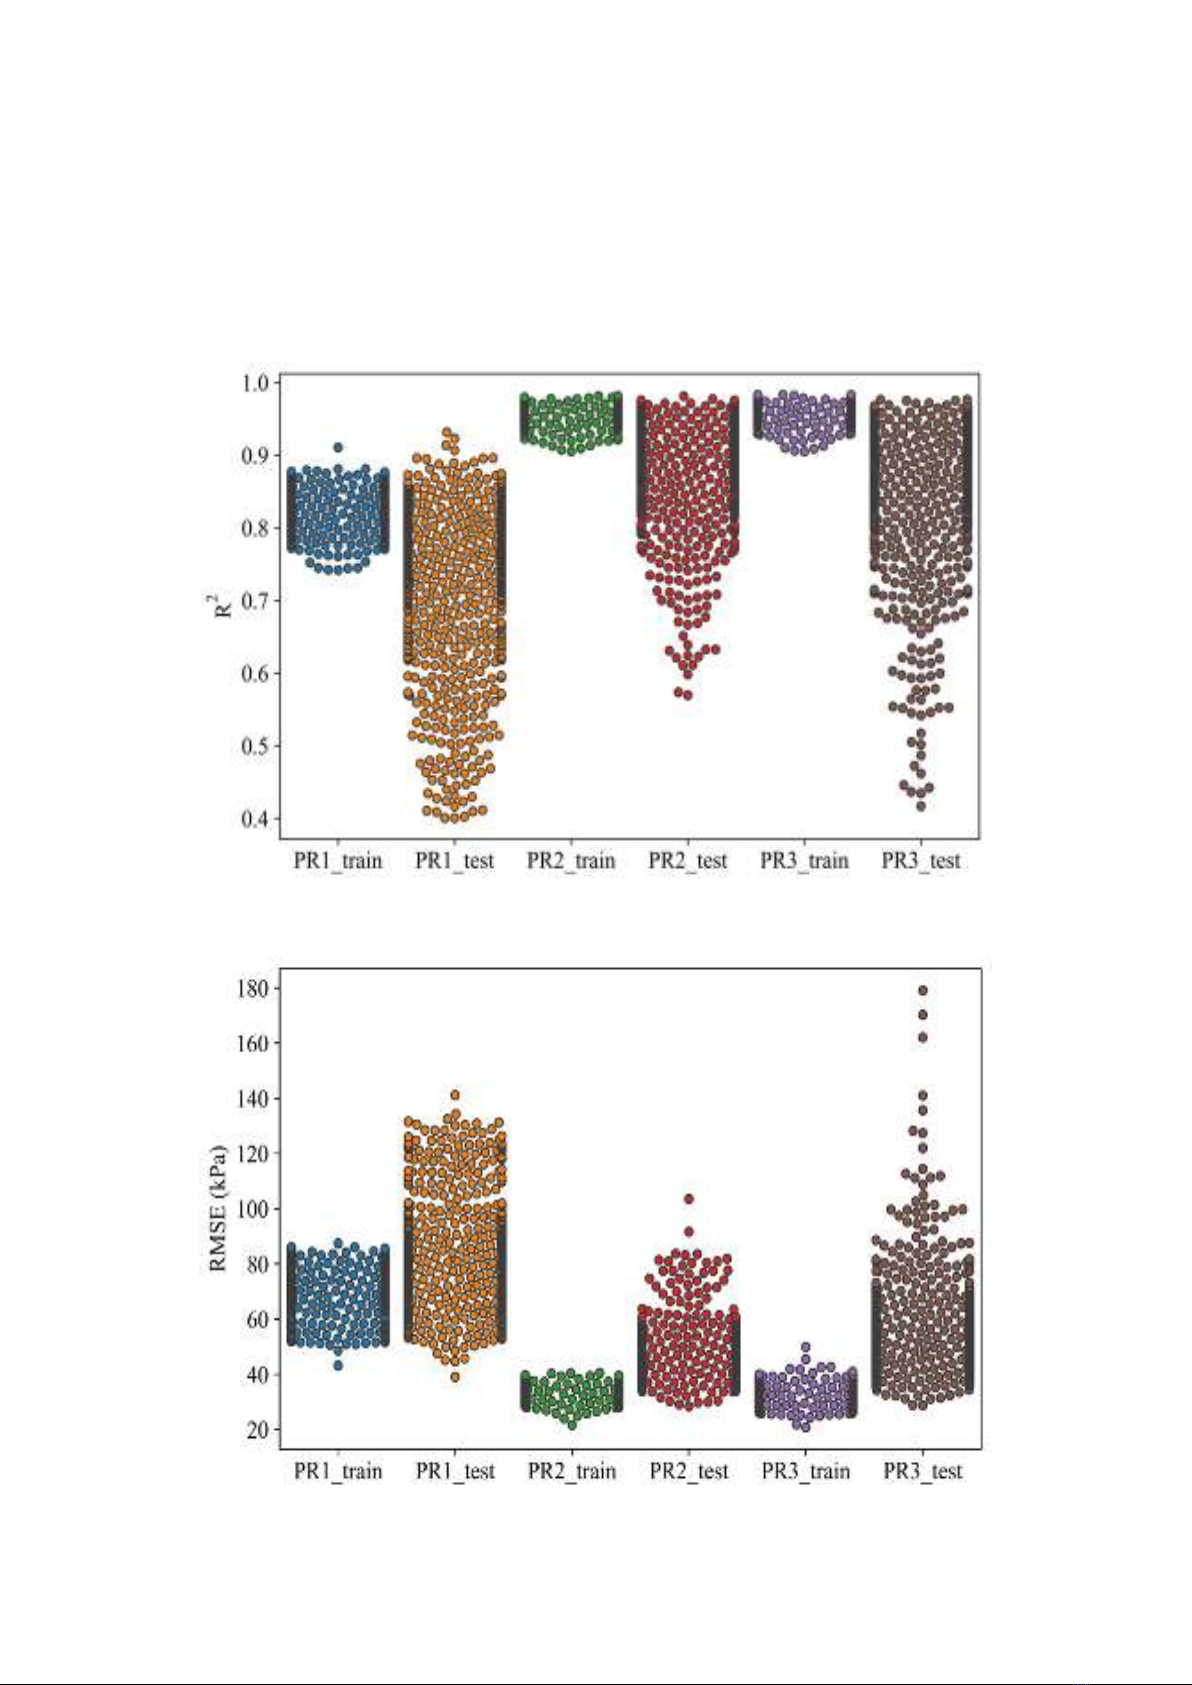
JSTT 2022, 2 (4), 43-51
Ngo et al
47
set is not too large, almost equivalent. Surprisingly,
the observed performance on the test data set,
model PR2 has the average R2(0.898) value,
which is larger than the average R2(0.875) value of
the PR3 model, the RMSE (48.222) and average
MAE (37.788) of PR2 model have smaller values
than RMSE=54.588, and average MAE=39.926 of
PR3 model. In addition, the standard deviation of
the PR3 model is much larger than the standard
deviation of the PR2 model. Therefore, it can be
said that the PR2 model gives a more reliable
performance than the PR1 and PR3 models.
(a) R2
(b) RMSE


![Bài giảng Quản lý vận hành và bảo trì công trình xây dựng [chuẩn nhất]](https://cdn.tailieu.vn/images/document/thumbnail/2025/20251006/agonars97/135x160/30881759736164.jpg)


![Ngân hàng câu hỏi trắc nghiệm Sức bền vật liệu 1: [Mô tả/Định tính Thêm để Tăng CTR]](https://cdn.tailieu.vn/images/document/thumbnail/2025/20250920/kimphuong1001/135x160/6851758357416.jpg)


![Trắc nghiệm Kinh tế xây dựng [chuẩn nhất]](https://cdn.tailieu.vn/images/document/thumbnail/2025/20250920/kimphuong1001/135x160/32781758338877.jpg)
