
REGULAR ARTICLE
Single Event Effect cross section calibration and application
to quasi-monoenergetic and spallation facilities
Rubén García Alía
1,*
, Stefano Bonaldo
2
, Markus Brugger
1
, Salvatore Danzeca
1
, Alfredo Ferrari
1
, Christopher Frost
3
,
Angelo Infantino
1
, Yosuke Iwamoto
4
, Julien Mekki
5
, Cris Theis
1
, and Adam Thornton
1
1
CERN, CH-1211, Genève, Switzerland
2
RREACT Group, Dipartimento di Ingegneria Dell’Informazione, Università di Padova, 35131 Padova, Italy
3
ISIS Facility, Rutherford Appleton Laboratory, Harwell Oxford, Didcot OX11 0QX, UK
4
Japan Atomic Energy Agency (JAEA), 2-4 Shirakata, Tokai, Naka, Ibaraki 319-1195, Japan
5
Centre National d’Etudes Spatiales (CNES), 18 Avenue Edouard Belin, 31400 Toulouse, France
Received: 5 January 2017 / Received in final form: 21 August 2017 / Accepted: 14 November 2017
Abstract. We describe an approach to calibrate Single Event Effect (SEE)-based detectors in monoenergetic
fields and apply the resulting semi-empiric responses to more general mixed-field cases in which a broad variety
of particle species and energy spectra are present. The calibration of the response functions is based both on
experimental proton (30–200 MeV) and neutron (5–300 MeV) data and considerations derived from Monte
Carlo simulations using the FLUKA Monte Carlo code. The application environments include the quasi-
monoenergetic neutrons at RCNP, the atmospheric-like VESUVIO spallation spectrum and the CHARM
high-energy accelerator test facility. The agreement between the mixed-field response and that predicted
through the mono-energetic calibration is within ±30% for the broad variety of cases considered and thus
regarded as highly successful for mixed-field monitoring applications.
1 Introduction
Single Event Effects (SEEs) are caused by a single, ionizing
particle and though in general inducing a negative effect in
electronic components, when properly calibrated can
therefore be used as a means of monitoring a radiation
beam or field. This paper describes the calibration process
of an Single Event Upset (SEU) detector, the European
Space Agency (ESA) Standard SEU Monitor [1]; and its
application to the monitoring of a broad variety of mixed
radiation fields.
Single event upsets (SEUs) are the change of state of a
latched logic cell from one to zero or vice-versa, induced by
an ionizing particle in a radiation field. An SEU is non-
destructive and therefore also known as a soft-error, as the
logic element can be rewritten or reset. Such events can
compromise the operation of electronic components in a
radiation environment, however when calibrated, the SEU
response can be used to monitor the radiation levels in a
broad range of applications such as space [1], high-energy
accelerators [2,3] or medical physics [4]. In order to do so,
the response of the device to be used as a detector needs to
be determined through monoenergetic measurements
relevant to the particle species and energy intervals
present in the application mixed-field.
In addition to soft errors such as SEUs, potentially
destructive (or hard) SEEs such as Single Event Latchup
(SEL), a permanently state of a device whereby a parasitic
thyristor structure is triggered by an ionizing particle
generating a low impedance, high-current path; can also
be used to monitor the characteristics of a radiation fields
[5].
In a mixed radiation field (i.e. one composed of different
particles species and energies) the number of SEEs Nin a
given time period will correspond to the convolution of the
individual differential particle fluences dfi
dE EðÞand SEE
cross sections siEðÞsummed over all the different particle
species i, as expressed in equation (1):
N¼X
iZdfi
dE ðEÞsiðEÞdE:ð1Þ
The cross sections as a function of energy can be
expressed as the product of a certain constant cross
section value and a weighting function viEðÞas shown in
*e-mail: ruben.garcia.alia@cern.ch
EPJ Nuclear Sci. Technol. 4, 1 (2018)
©R.G. Alía et al., published by EDP Sciences, 2018
https://doi.org/10.1051/epjn/2017031
Nuclear
Sciences
& Technologies
Available online at:
https://www.epj-n.org
This is an Open Access article distributed under the terms of the Creative Commons Attribution License (http://creativecommons.org/licenses/by/4.0),
which permits unrestricted use, distribution, and reproduction in any medium, provided the original work is properly cited.

equation (2), therefore equation (1) can be rewritten as
equation (3) where ’eq
iis defined as the equivalent fluence
for the particle species i.
siðEÞ¼si⋅viðEÞ;ð2Þ
N¼X
i
siZdfi
dE ðEÞviðEÞdE ¼X
i
sifeq
i:ð3Þ
It is to be noted that, whereas in equation (3) the SEE
cross sections are constant and the fluxes that are
multiplied by the energy-dependent weighting functions
v
i
(E), this is only a mathematical approach to ease the
detector calibration and radiation field representation. In
physical terms, it is in fact the SEE cross sections that have
a dependence on energy, deriving from the associated
nuclear cross sections and secondary particle properties,
both a function of the incident hadron energy.
For the radiation fields that will be treated in this
paper, the particle species contributing to SEEs can be
divided into two categories according to their interaction
mechanisms: thermal neutrons and high energy hadrons
(HEH), defined as hadrons above 20 MeV plus a weighted
contribution from neutrons in the 0.2–20 MeV range [2].
Therefore, equation (2) can be expressed as equation (4);
whereas equations (5) and (3) can be developed into two
terms and resolved for the so-called mixed-field HEH cross
section s
HEH as shown in equation (6). For a given mixed-
field measurement, this value will depend on the number of
measured SEEs, the associated equivalent fluences and the
sensitivity to thermal neutrons. In the case of mono-
energetic measurements, equation (6) takes the simple
form of the ratio between the number of events and
associated experimental fluence.
sHEHðEÞ¼sHEH⋅vHEHðEÞ;ð4Þ
sthðEÞ¼sth⋅vthðEÞ;ð5Þ
s
HEH ¼Nsthfeq
th
feq
HEH
:ð6Þ
In the case of the thermal neutrons, SEEs are known to
be induced by the neutron capture in
10
B and the
production of
7
Li and
4
He as ionizing products [6].
Therefore, the thermal neutron equivalent fluence can be
expressed as shown in equation (7) where vthðEÞis defined
as shown in equation (8) and therefore s
th
defined in
equation (5) corresponds to the SEE cross section at
0.025 eV.
feq
th ¼ZvthðEÞdfn
dE ðEÞdE;ð7Þ
vthðEÞ¼ 0:025eV
EðeVÞ
1=2
:ð8Þ
As to what concerns the HEH contribution and
according to experimentally supported nuclear interaction
physical considerations [2,7,8], we assume that for both
protons and neutrons, the respective cross sections can be
expressed as shown in equation (2) where iis either protons
or neutrons and v
i
(E) is a three-parameter Weibull
function as shown in equation (9) where E
o
in the onset
energy and Wand sare the scale and shape parameters,
respectively. In this case the constant cross section term s
i
corresponds to the saturation value.
wðEÞ¼1eððEEoÞ=WÞs:ð9Þ
Therefore, the s
HEH value extracted experimentally in
a mixed-field through equation (6) can be compared to the
value retrieved in the monoenergetic measurement set in
equation (2) which is considered as the calibrated value.
In the work presented here a set of mixed-field HEH
SEE cross sections are measured and benchmarked against
the calibrated value. We will use the ratio R
mf
between the
mixed-field and calibrated HEH cross sections as a means of
quantifying how accurately the given environment is
described in terms of SEE induction.
2 SEE cross section calibration
The device used as a detector in the results presented in this
paper is ESA Standard SEU Monitor [9], based on the
AT68166F 16 Mbit Static Random Access Memory
(SRAM) multi chip module from Atmel. The SRAM is
designed on a 0:25 mmradiation hardened process and is
reported by the manufacturer to be SEL free up to a linear
energy transfer (LET) value of 80 MeV cm
2
/mg. In
addition, it was tested up to a total ionizing dose (TID)
value of 3 kGy (Si) showing no degradation. The part was
initially calibrated by ESA for heavy ions up to an LET of
56 MeV cm
2
/mg, protons up to 230 MeV and thermal
neutrons [1,9] however it needed to be re-calibrated by
CERN for protons in the 30–230 MeV range and neutrons
in the 5–15 MeV range owing to (i) the change of the core
voltage of the device reported by the manufacturer in order
to increase the access speed, and thus also affecting the
SEU cross section (ii) the need of evaluating the response to
intermediate energy neutrons (0.2–20 MeV) which has
been shown in the past [2] to have a significant impact on
the high-energy accelerator SEE rate.
As will be discussed later on, the device is particularly
suitable for radiation level monitoring owing to (i) its
resistance to SEL and TID, (ii) its small part-to-part
sensitivity spread, (iii) its relatively constant hadron cross
section with energy above 20 MeV and (iv) its capability
of representing the physical distribution of the SEUs in the
memory. Therefore, the monitor not only provides the
measurement of the beam flux for calibrated conditions but
can also be used as a means of evaluating the homogeneity
and relative alignment of a beam in a test facility.
2.1 PSI: protons between 30 and 230 MeV
The ESA Monitor SEU cross section was measured during
a set of test campaigns at the Paul Scherrer Institute (PSI)
between September 2011 and April 2014. The Proton
Irradiation Facility (PIF) beam line at PSI is used
2 R.G. Alía et al.: EPJ Nuclear Sci. Technol. 4, 1 (2018)

extensively by the space community as well as by research
groups in other disciplines [10]. Since 2007, the COMET
cyclotron is in operation designed to produce a 1000 nA,
250 MeV proton beam which is currently used in three
Gantries and the PIF experimental station. The initial
proton energy delivered by the cyclotron during the ESA
Monitor calibration tests was 230 MeV, which could be
degraded through the use of copper plates of different
thicknesses.
At PSI, the beam intensity monitoring system consists
of an ionization chamber located downstream the degrader.
A plastic scintillator placed in the location of the test
sample is used to measure the flux before the test runs and
establish the conversion factors between the counts from
the ionization chamber and the actual proton flux. The
same scintillators can be used to extract the beam profile by
moving it horizontally and vertically in millimeter steps.
The profile is typically homogeneous within ∼10% in a
diameter of 5 cm. As to what regards the beam current and
respective fluxes, the maximum value is roughly 5 nA,
corresponding to a flux of ∼2⋅10
8
p/cm
2
/s at 230 MeV
and ∼4⋅10
7
p/cm
2
/s at 30 MeV. These values can be
reduced linearly with intensity down to a lower limit of
roughly 0.1 nA.
In order to evaluate the sensitivity spread among
individual detectors, eight different monitors were tested at
230 MeV, yielding an average cross section value as shown
in equation (10) and a relative 2sdeviation of 7%. This
spread was assumed to originate from the sensitivity
differences among the detectors, as the count statistics
error was significantly smaller in every case (at least 5 ⋅10
3
SEU counts were accumulated during each run, corre-
sponding to a 2sspread of 3%). Moreover, this spread was
assumed to be constant for the different test energies
considered. When compared with the spread in commercial
SRAMs calibrated for detector purposes [2,11] it can be
considered as very small and typically negligible with
respect other experimental uncertainties. In addition, a
10% error in the fluence value provided by the facility is
assumed as typically reported.
The value and associated error reported in equation
(10) are therefore the reference value for the monoenergetic
HEH cross section used for the detector throughout this
work.
sHEH ¼ð2:63 ±0:32Þ⋅1014cm2=bit:ð10Þ
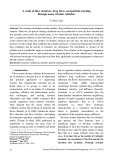
The ESA Monitor SEU cross section results were
normalized to the 230 MeV value and fitted to a three-
parameter Weibull function v
p
(E) such as that shown in
equation (9). The normalized experimental data and the
respective response function v
p
(E) are plotted in Figure 1.
In addition to the uncertainly related to the s
HEH
value
(deriving from the sensitivity spread and the fluence
measurement) an extra 15% error is considered for
the v
p
(E) function in order to account for the actual
energy dependence of the response as opposed to the
considered fit. This value corresponds to the maximum
deviation of the data with respect to the fit in the
considered energy interval.
2.2 PTB: neutrons between 5 and 15 MeV
The Physikalisch-Technishe Bundesanstalt (PTB), neu-
tron reference fields are quasi-monoenergetic neutron
reference beams in the energy range from thermal to
200 MeV [12]. The main purpose of such beams is the
energy response calibration of instruments used for neutron
monitoring and dosimetry. The principle behind the
production of intermediate and high energy quasi-mono-
energetic fields is that of light ions (protons, deuterium)
accelerated in a proton or Van-de-Graaf (VgG) accelerator
impinging on gas or solid low-Z targets (deuterium,
tritium,
7
Li). The reactions and field properties of the
energies used in the ESA Monitor calibration campaign are
shown in Table 1.
The measurements of the neutron peak fluence are
performed relative to the differential n-p scattering cross
section by means of a proton recoil proportional counter or
a recoil proton telescope depending on the energy.
Likewise, the measurement of the spectral fluence is
carried out using pulsed beams and the Time-of-Flight
Fig. 1. Normalized PSI proton cross section data together with
fitted Weibull response function.
Table 1. PTB calibration for different energies in the 1–20 MeV range. Flux rates correspond to a distance of 1 m from
the source. Ti(T) stands for tritiated titanium. The energy spread is represented by the FWHM. The relative contribution
of neutrons scattered in the target is indicated by F
sc
/F.
Reaction <E
n
>(MeV) FWHMEn(MeV) Target Flux (/cm
2
/s) F
sc
/F(%)
2
H(d,n)
3
He 5.0 0.2 D
2
-gas 5.2·10
3
<1.0
2
H(d,n)
3
He 8.0 0.2 D
2
-gas 1.9·10
4
<1.0
3
H(d,n)
4
He 14.8 0.4 Ti(T) 1.3·10
4
3.0
R.G. Alía et al.: EPJ Nuclear Sci. Technol. 4, 1 (2018) 3

(TOF) technique with scintillators and fission ionization
chambers. This detection technique cannot be used for low
energy neutrons at PTB (24 keV–19 MeV) due to the beam
pulse frequency, therefore their spectral characterization is
performed through the unfolding of Bonner sphere read-
ings. The term low for this energy range applies to the PTB
context and is related to the availability of larger quasi-
monoenergetic neutron energies at e.g. UCL or iThemba.
At PTB the ESA SEU Monitor was characterized with
the energies reported in Table 1. These correspond to a
range in which the SEE cross section is known to have a
strong dependence with energy and that can have an
important impact on the overall high-energy accelerator
SEE rate [2].
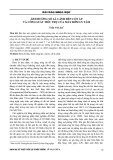
The response fitw
n
(E) normalized to the s
HEH
value is
shown in Figure 2 in logarithmic scale and along with the
proton response v
p
(E). Similarly to the proton case, a
15% error is attributed to the use of an analytical fitvnEðÞ
as opposed to the actual response. These results are
regarded as monoenergetic for SEU calibration purposes
as (i) the proportion of scattered neutrons is at the percent
level, (ii) the cross section decreases rapidly with energy in
this range. For the proton case, the fitinthisenergy
interval is determined by the experimental point at
30 MeV shown in Figure 1 and might therefore not be
realistic for lower energy values. However as shown in [2],
the proton (and in general charged hadron) spectrum in a
high-energy accelerator mixed-field decreases strongly
with energy in this range and therefore the impact of the
proton fit on the overall response is negligible in practical
terms.
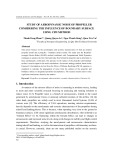
In order to evaluate the impact of the SRAM feature
size on the intermediate energy neutron response, Figure 3
shows the normalized cross section for the Atmel memory
considered in this study together with those measure for a
Toshiba (0.4 mm feature size, reference TC554001AF-70L)
and Cypress memory (90 nm feature size, reference
CY62157EV) both also calibrated for radiation level
measurement in the high-energy accelerator environment
[2,3]. The respective Weibull fit parameters are shown in
Table 2. As can be seen, the responses are qualitatively very
similar but visibly differ among the different components.
The comparison of the response of different SRAM
memories to intermediate energy neutrons relative to the
HEH cross section value is relevant to the calibration
procedure because it might not always be feasible to
calibrate individual detector candidate references in this
energy interval. Therefore, it is important to be able to
evaluate the impact of the actual response with respect to a
generalized assumption.
It is worth noting at this stage that the equivalent HEH
(using the Toshiba response shown in Fig. 3) and thermal
neutron equivalent fluxes are directly available in the
FLUKA Monte Carlo code [13–15] through the HEHAD-
EQ and THNEU-EQ generalized particles.
3 Application to quasi-monoenergetic and
spallation facilities
3.1 RCNP: quasi-monoenergetic neutrons at 100 and
300 MeV
At the Research Center for Nuclear Physics (RCNP), quasi-
monoenergetic neutron beams in the 80–400 MeV range are
provided through the
7
Li(p,xn) reaction [16]. A 1 cm thick
enriched Li target is used to produce theneutrons. AnNE213
liquid scintillator was used to detect the generated neutron
spectra using a TOF technique. The proton energy during
the ESA Monitor calibration experiments performed in
November 2014 was determined to be 100 and 296 MeV,
yielding neutron peak energies of 96 and 293 MeV respec-
tively. As a figure-of-merit of the contribution of scattered
neutrons to the total spectrum, the ratio between the peak
and total above 3 MeV fluences is used, F
peak
/F
>3MeV
,which
was reported to be equal to 0.41 for 100 MeV and 0.44 for
296 MeV. The relatively large proportion of off-peak neutron
justifies the treatment of the quasi-monoenergetic neutron
beams asa mixed-field case in which resultsor assumptions of
the monoenergetic response need to be applied in order to
Fig. 2. Normalized PTB neutron cross section data together
with the fitted neutron and proton Weibull response function for
the Atmel memory.
Fig. 3. PTB neutron cross section data normalized to the
230 MeV proton value together with the fitted Weibull response
function for the Atmel, Cypress and Toshiba memories. The
Toshiba part was biased at 3 V and 5 V yielding compatible
normalized cross sections [2], whereas and the Atmel and Cypress
were biased at 3.3 V.
Table 2. Weibull fit parameters for the different SRAMs
shown in Figure 3.
SRAM W(MeV cm
2
/mg) s
Cypress 14.9 2.73
Atmel 11.6 3.14
Toshiba 9.25 3.02
4 R.G. Alía et al.: EPJ Nuclear Sci. Technol. 4, 1 (2018)

retrieve the cross section value for the energy of interest. The
beam intensity is monitored using a Faraday cup collecting
the protons after interacting with the production target.
The measured spectra as reported by the facility are
shown in Figure 4. The response function v
n
(E)is
convoluted with the neutron fluxes dfn
dE ðEÞin order to
yield the feq
HEH from equation (3) in which the thermal
neutron contribution is assumed to be negligible. The
resulting expression is shown in equation (11). In addition
and similarly to what is performed in [17], one can also
consider the extreme cases in which the quasi-monoener-
getic SEE cross section is derived based (i) only on the
neutron peak fluence F
peak
, and represented as s
np
, and (ii)
the full neutron spectrum, and represented as s
n
.
s
HEH ¼N
∫wnðEÞdfnðEÞ
dE dE :ð11Þ
The resulting cross section values of the two different
energies and three expressions considered are shown in
Table 3. Two important conclusions can be drawn from the
relative comparison of the different cross sections. The fact
that the cross section considering the weighted response
(s
HEH) is less than 10% larger than the one considering the
total neutron flux (s
n
) indicates that the impact of the off-
peak neutrons in the SEU induction is similar to that
associated to the peak itself. Therefore, the consideration of
only the latter in the cross section derivation (i.e. the s
np
)
can lead to a significant overestimation.
It is to be noted at this stage however that this situation
would not apply to lower quasi-monoenergetic energies or
response functions w(E) with a larger energy dependence, for
which the difference between s
HEH and s
n
could be significant.
In order to compare them with the high energy proton
case, the resulting quasi-monoenergetic RCNP cross
sections considered are those labeled as s
HEH in Table 3.
These values have an uncertainty deriving from the count
statistics, the sensitivity spread, a 10% margin in the
neutron flux measurement and a 15% uncertainty related
to the use of w
n
(E) as a response function. The normalized
cross section results are plotted in Figure 5. As can be seen,
the 96 and 293 MeV neutron values are 27% and 5% larger
than the saturation value, respectively; and therefore
within the considered statistical uncertainty. This is
compatible with the fact that in virtue of their similar
nuclear reaction cross section protons and neutrons are
expected to yield equivalent SEE cross sections above
roughly 50 MeV [18,19].
Despite being compatible with the expected saturation
value, the normalized quasi-monoenegetic neutron cross
section at 96 MeV is clearly larger than that obtained at
293 MeV and, as will later be shown, than those obtained at
other mixed-field facilities. It is to be noted that other
experiments performed during the same test campaign
showed a similar trend, therefore a systematic error in the
associated dosimetry cannot be excluded.
3.2 VESUVIO: atmospheric-like neutron spectrum
The VESUVIO neutron beam is part of the ISIS-STFC
laboratory in Oxford, UK. Despite its main use as a
condensed matter research instrument [20] benchmark
measurements have been performed proving that VESUVIO
provides a neutron spectrum similar to the ambient at sea
level. Neutrons are generated through the interaction of a
800 MeV, 2 mA proton beam with a tungsten spallation
target. The proton beam is accelerated in a synchrotron as
two 100 ns long pulses with a frequency of 50 Hz. The
VESUVIO beamline is at 60°with respect to the initial
proton beamline. The neutron flux obtained above 10 MeV is
∼5.8⋅104n=cm2=stherefore roughly an order of magnitude
lower than those available at TRIUMF or LANSCE. The
neutron spectrum is calculated using the MCNPX Monte
Carlo simulation tool and benchmarked against TOF
measurements performed with different detectors including
Bonner spheres, activation foils, CCD devices and thin film
breakdown counters [20]. The flux measurement during the
VESUVIO experiments relies on the benchmarked MCNPX
calculations scaled with the beam current.
Concerning the ESA SEU Monitor measurements
performed in March 2014, two configurations were used:
one with the primary neutron VESUVIO beam and one
with a 1.5 mm Cd foil surrounding the detector in order to
Fig. 4. RCNP spectra for 100 and 296 MeV as measured through
the NE213 TOF technique [16].
Fig. 5. Normalized RCNP neutron quasi-monoenergetic cross
section data together with the fitted Weibull proton response
function.
Table 3. SEU cross section summary for the ESA SEU
Monitor at RCNP. The associated relative 2suncertainties
are 26%, as justified in the text.
Energy
(MeV)
s
HEH
(·10
14
cm
2
/bit)
s
n
(·10
14
cm
2
/bit)
s
np
(·10
14
cm
2
/bit)
96 3.36 3.24 7.29
293 2.77 2.59 6.37
R.G. Alía et al.: EPJ Nuclear Sci. Technol. 4, 1 (2018) 5


![Đề ôn tập cuối kỳ môn Kỹ thuật nhiệt - Nhiệt động học [mới nhất]](https://cdn.tailieu.vn/images/document/thumbnail/2026/20260310/hoaphuong0906/135x160/60681773197823.jpg)

![Bài giảng thang máy và thang cuốn: Tổng hợp kiến thức [chuẩn nhất]](https://cdn.tailieu.vn/images/document/thumbnail/2026/20260310/hoaphuong0906/135x160/41471773283876.jpg)
