
89
5
CHAPTER
10 “Soft” Tools You
Will Need on a Six
Sigma Team
In Chapter 4, we reviewed 10 technical tools that any Six Sigma
project team member is expected to use in their work of applying
DMAIC. At first, these tools may present a challenge as team
members both learn these tools and apply them to their actual
work. After the first or second use of the tool, confidence grows in
their usage.
Technical tool usage is not the only area of expertise a team
member must possess. There are several tools that are considered
non-technical in nature that a team member must learn. Some-
times these non-technical tools are called soft tools, because virtu-
ally none of them have any mathematics or statistics associated
with them. While this may be good news to those on Six Sigma
teams that have some degree of math phobia, in reality, these soft
tools can be challenging. The challenge of the soft tools that we
are about to discuss in Chapter 5 centers around the fact that so
many of these tools are applied to people in the organization.
Thus, it is important that Six Sigma team members learn them

90 SIX SIGMA FOR EVERYONE
carefully and apply them diligently and tactfully. Without them,
the chances of Six Sigma improvement reduce dramatically. With
them, success is just around the corner.
The 10 tools covered in Chapter 5 can be divided into two
major categories. Five of the 10 tools focus around the acceptance
of the Six Sigma project team’s solutions. The other five tools
focus on how the team conducts its work.
The Concept of Acceptance
In our second Six Sigma book, Making Six Sigma Last, Managing
the Balance between Cultural and Technical Change, we discussed
a simple equation that contributes to the success of Six Sigma:
Q×A=E
Qrefers to the quality of the technical elements of Six Sigma,
whether it be the strategic component that is the responsibility of
management or the tactical elements of Six Sigma projects which
is the responsibility of the Six Sigma team members. Ain the for-
mula refers to the acceptance of Qand Erefers to the excellence
of the results.
At the Six Sigma project level, acceptance refers to how well the
project team’s solutions are embraced by the stakeholders. Stake-
holders are those individuals affected by the team’s solutions or
those individual’s needed to implement the team’s solutions.
The equation Q×A=Eis a multiplicative function. This means
the team should evaluate how well they have done Q(usually on a 1
to 10 scale where 10 is excellent and 1 is poor) and evaluate how
well they have attempted to gain acceptance of their Qwith stake-
holders (again using a 1 to 10 scale). Multiplying the two numbers
together will determine how successful the team will be with their
project. A 60 is usually the minimum number necessary to have a
successful project.
We addressed many of the tools in Chapter 4 that will assist
the team in generating a high Q. We now detail the major tools
necessary for a project team to generate a high Anumber.
10 “Soft” Tools You Will Need on a Six Sigma Team 91
Tool #1: The Stakeholder Analysis Chart
A stakeholder is anyone affected by the solutions of a Six Sigma
project team or anyone needed to implement the solutions of a Six
Sigma project team. The stakeholder analysis chart is an analysis
of the key stakeholders affected by a Six Sigma project. The chart
does two things: First, there is an analysis of where the key stake-
holders are currently in terms of acceptance to the solutions. Sec-
ond, there is the projection of where the key stakeholders need to
be if the team is to be successful.
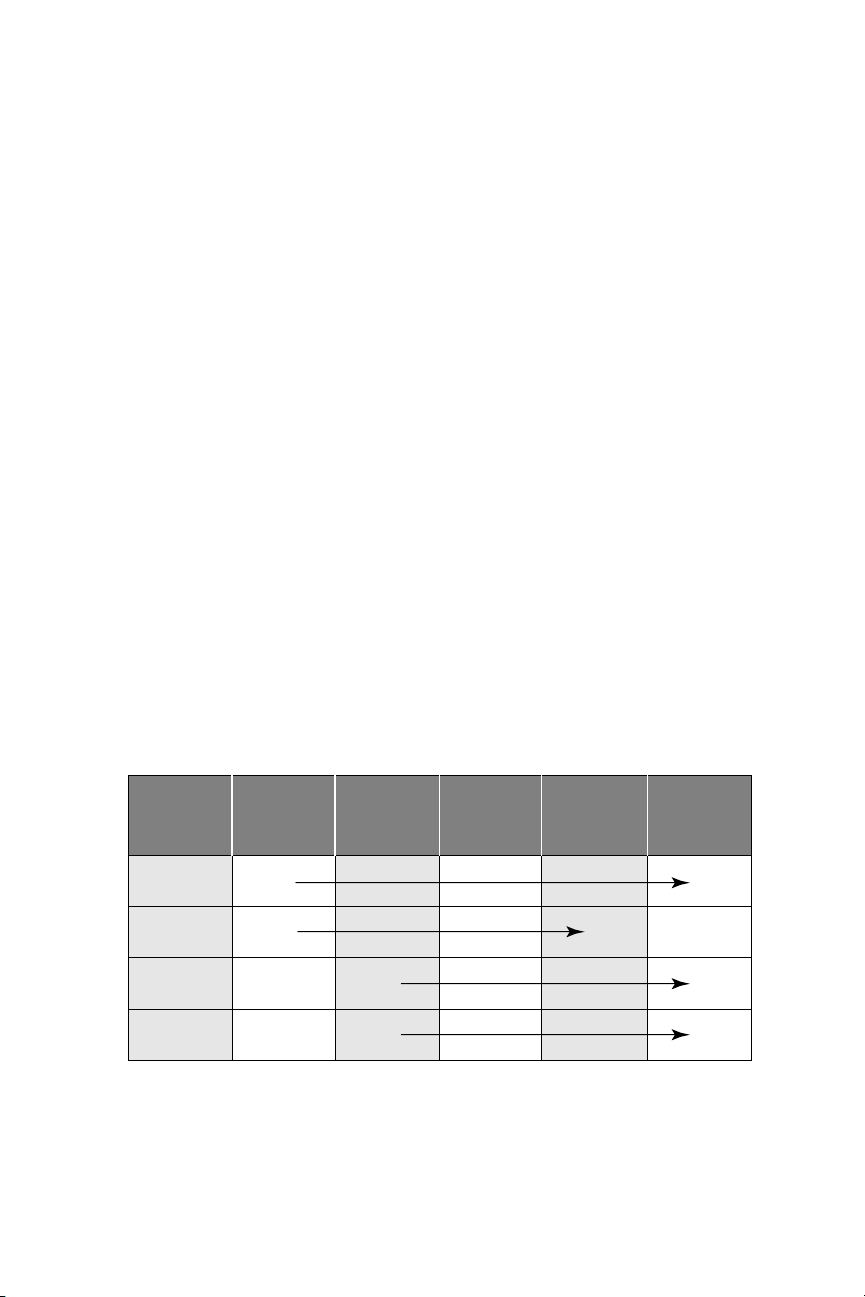
Figure 5.1 shows an example of a stakeholder analysis chart.
First, let’s review what each column means. The first column
is “Key Stakeholder.” A key stakeholder is a stakeholder who has
influence over other stakeholders. It is quite possible that a Six
Sigma project team could have solutions that affect hundreds of
stakeholders. It is not feasible to expect a Six Sigma project team
to seek out hundreds of stakeholders to gain their acceptance.
Therefore, a Six Sigma project team should identify only their key
stakeholders.
Let’s examine the remaining columns, starting from the far
right and moving to the left. The last column indicates someone
who is strongly supportive (Makes It Happen). This is someone
who not only does what is asked of them by way of the project, but
Figure 5.1 Stakeholder analysis chart.
Strongly
Against
Having It
Happen
Moderately
Against
Having It
Happen
Lets It
Happen
Helps It
Happen
Makes It
Happen
Key
Stakeholder
Robyn
Rick
Hanna
Josh
O
O
O
O
O
X
X
X
X
X
= current
= needed

92 SIX SIGMA FOR EVERYONE
also goes out of their way to do more than is asked. The column to
the left (Helps It Happen) is designated for those who do what is
asked of them and do it well. The next column (Lets It Happen) is
designated for those who are neither for nor against the proposed
solutions. They will not get in the way of the team implementing
its solutions. The Moderately Against column is reserved for those
who will not do what is asked of them relative to the project. Fi-
nally, to be in the Strongly Against column means not only does
this stakeholder not do what is asked of them, but tries to recruit
others against the solutions.
As you can see from Figure 5.1, Robyn is strongly against
the project team’s solutions as indicated by the “O.” The “X” in-
dicates where Robyn must be if the project team is going to be
successful.
The stakeholder analysis chart is a critical first step to gaining
acceptance to the project team’s solutions. In keeping with the
concept of Six Sigma being a management philosophy based on
fact and data, a stakeholder analysis chart is a way of measuring
support to the team’s solutions.
Keys to Using This Tool
• Don’t list every stakeholder; list only those that are key to
the implementation of your solutions.
• Use actual names of key stakeholders. Don’t list functions
or departments (e.g., finance, manufacturing).
• To determine where the key stakeholders are currently will
require data collection. That means talking to key stake-
holders at a conceptual level about the project and how they
will be affected.
•
Recognize that to be successful in implementing a set of so-
lutions, a key stakeholder does not necessarily need to be
moved to the “Makes It Happen” column. Many times a key
stakeholder only needs to be in the “Helps It Happen” or
even in the “Lets It Happen” category.
• Keep the list confidential. The goal is not to “bad mouth”
those that are not currently in their desired level of support.

10 “Soft” Tools You Will Need on a Six Sigma Team 93
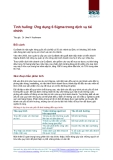
Tool #2: Planning for Influence Chart
Figure 5.2 shows a planning for influence chart. Once the project
team has identified a gap between where a key stakeholder is cur-
rently and where they need to be in order for their solutions to be
implemented, a planning for influence chart needs to be created.
The gap between current and desired positions usually indicates
some form of resistance. There are four common types of resist-
ance. It is the responsibility of the project team to diagnose the
type of resistance, the underlying issue behind the resistance, and
to develop a strategy to overcome the resistance that will move the
key stakeholder to the desired state of support for the project
team’s solutions.
First, let’s review why Robyn is resistant. The first type of re-
sistance is called technical resistance. As it turns out, Robyn will
Key Type of Underlying
Stakeholder Resistance Issue Strategy
Figure 5.2 Planning for influence chart.


%20--%3e%3cdefs%3e%3cstyle%3e%20.st0%20{%20fill:%20%23fff;%20}%20.st1%20{%20fill:%20%237800fa;%20}%20%3c/style%3e%3c/defs%3e%3cpath%20class='st1'%20d='M117.78,12.18H43.11c2.9,3.47,4.65,7.94,4.65,12.82,0,5.6-2.3,10.66-6.01,14.29h76.02l7.22-13.56-7.22-13.56Z'/%3e%3cg%3e%3cpath%20class='st0'%20d='M53.58,26.17h-.59v-1.46h.59v-4.96h2.83c1.78,0,2.67.94,2.67,2.82v5.76c0,1.87-.89,2.81-2.67,2.81h-2.83v-4.96ZM55.36,21.37v3.34h1.1v1.46h-1.1v3.34h1.01c.61,0,.91-.37.91-1.1v-5.93c0-.74-.3-1.1-.91-1.1h-1.01Z'/%3e%3cpath%20class='st0'%20d='M65.99,31.14h-1.8l-.31-2.07h-2.19l-.31,2.07h-1.64l1.82-11.39h2.62l1.82,11.39ZM65.28,18.04c-.25.46-.51.77-.75.94-.21.15-.47.22-.79.22-.26,0-.57-.07-.92-.22l-.38-.15c-.14-.05-.26-.07-.37-.07-.3,0-.53.18-.71.54l-.91-.68c.25-.46.51-.77.75-.94.21-.14.48-.21.79-.21.26,0,.57.07.92.21l.38.15c.14.05.26.07.37.07.3,0,.53-.18.71-.54l.91.68ZM61.91,27.52h1.73l-.87-5.76-.87,5.76Z'/%3e%3cpath%20class='st0'%20d='M74.53,26.89v1.52c0,1.91-.89,2.86-2.67,2.86s-2.67-.95-2.67-2.86v-5.93c0-1.91.89-2.86,2.67-2.86s2.67.95,2.67,2.86v1.11h-1.69v-1.22c0-.75-.31-1.12-.93-1.12s-.93.37-.93,1.12v6.15c0,.74.31,1.11.93,1.11s.93-.37.93-1.11v-1.63h1.69Z'/%3e%3cpath%20class='st0'%20d='M81.4,31.14h-1.8l-.31-2.07h-2.19l-.31,2.07h-1.64l1.82-11.39h2.62l1.82,11.39ZM75.9,19.2l1.52-1.91h1.71l1.51,1.91h-1.61l-.76-.95-.75.95h-1.61ZM77.32,27.52h1.73l-.87-5.76-.87,5.76ZM83.1,15.99l-1.76,1.91h-1.26l1.17-1.91h1.86Z'/%3e%3cpath%20class='st0'%20d='M84.86,19.75c1.78,0,2.67.94,2.67,2.82v1.48c0,1.87-.89,2.81-2.67,2.81h-.85v4.28h-1.79v-11.39h2.64ZM84.01,21.37v3.86h.85c.58,0,.87-.36.87-1.08v-1.71c0-.71-.29-1.07-.87-1.07h-.85Z'/%3e%3cpath%20class='st0'%20d='M93.51,19.75c1.78,0,2.67.94,2.67,2.82v1.48c0,1.87-.89,2.81-2.67,2.81h-.85v4.28h-1.79v-11.39h2.64ZM92.66,21.37v3.86h.85c.58,0,.87-.36.87-1.08v-1.71c0-.71-.29-1.07-.87-1.07h-.85Z'/%3e%3cpath%20class='st0'%20d='M98.8,31.14h-1.79v-11.39h1.79v4.88h2.03v-4.88h1.83v11.39h-1.83v-4.88h-2.03v4.88Z'/%3e%3cpath%20class='st0'%20d='M105.36,24.55h2.46v1.62h-2.46v3.34h3.09v1.63h-4.88v-11.39h4.88v1.63h-3.09v3.18ZM108.17,17.29l-1.76,1.91h-1.26l1.17-1.91h1.86Z'/%3e%3cpath%20class='st0'%20d='M112.2,19.75c1.78,0,2.67.94,2.67,2.82v1.48c0,1.87-.89,2.81-2.67,2.81h-.85v4.28h-1.79v-11.39h2.64ZM111.35,21.37v3.86h.85c.58,0,.87-.36.87-1.08v-1.71c0-.71-.29-1.07-.87-1.07h-.85Z'/%3e%3c/g%3e%3ccircle%20class='st1'%20cx='25'%20cy='25'%20r='20'/%3e%3cpath%20class='st0'%20d='M32.78,19.27c2.92,0,4.43,2.55,5.28,5.33l.71,2.17c.14.38-.33.75-.71.75h-5.61c.19-.33.24-.71.09-1.08l-.75-2.45c-.43-1.32-.99-2.64-1.79-3.77.75-.57,1.65-.94,2.78-.94h0ZM25,18.38c3.25,0,4.9,2.78,5.89,5.89l.76,2.45c.14.42-.33.8-.8.8h-11.69c-.42,0-.94-.38-.8-.8l.75-2.45c.99-3.11,2.64-5.89,5.89-5.89h0ZM25,11.35c1.74,0,3.11,1.37,3.11,3.11s-1.37,3.11-3.11,3.11-3.11-1.41-3.11-3.11,1.41-3.11,3.11-3.11h0ZM17.27,19.27c1.08,0,1.98.38,2.73.94-.8,1.13-1.37,2.45-1.74,3.77l-.8,2.45c-.14.38-.05.75.09,1.08h-5.56c-.42,0-.9-.38-.75-.75l.71-2.17c.9-2.78,2.41-5.33,5.33-5.33h0ZM17.27,12.91c1.51,0,2.78,1.27,2.78,2.83s-1.27,2.83-2.78,2.83-2.83-1.27-2.83-2.83,1.27-2.83,2.83-2.83h0ZM32.78,12.91c1.56,0,2.78,1.27,2.78,2.83s-1.23,2.83-2.78,2.83-2.83-1.27-2.83-2.83,1.27-2.83,2.83-2.83h0ZM27.07,28.56v.09c0,.57-.24,1.08-.61,1.46h0v.05c-.38.33-.9.57-1.46.57s-1.08-.24-1.46-.61h0c-.38-.38-.61-.9-.61-1.46v-.09h1.41v.09c0,.19.05.38.19.47v.05c.09.09.28.19.47.19s.38-.09.47-.19v-.05c.14-.09.24-.28.24-.47t-.05-.09h1.41ZM30.99,28.56v.09c0,1.65-.66,3.16-1.74,4.24-1.08,1.08-2.59,1.79-4.24,1.79s-3.16-.71-4.24-1.79l-.05-.05c-1.04-1.08-1.7-2.55-1.7-4.2v-.09h1.41v.09c0,1.27.47,2.4,1.27,3.25h.05c.85.85,1.98,1.37,3.25,1.37s2.4-.52,3.25-1.37c.85-.8,1.37-1.98,1.37-3.25v-.09h1.37ZM34.99,28.56v.09c0,2.78-1.13,5.28-2.92,7.07-1.79,1.79-4.29,2.92-7.07,2.92s-5.23-1.13-7.07-2.92c-1.79-1.79-2.92-4.29-2.92-7.07v-.09h1.41v.09c0,2.4.94,4.53,2.5,6.08,1.56,1.56,3.72,2.5,6.08,2.5s4.52-.94,6.08-2.5c1.56-1.56,2.5-3.68,2.5-6.08v-.09h1.41Z'/%3e%3c/svg%3e)