
118 Le Hoang Son, Truong Nguyen Song Ha, Nguyen Ngoc Phuong, Phan Bao An
VEHICLE ROUTING PROBLEM IN WASTE COLLECTION:
A CASE STUDY IN SON TRA, DANANG
Le Hoang Son1*, Truong Nguyen Song Ha1, Nguyen Ngoc Phuong2, Phan Bao An3
1The University of Danang - University of Science and Technology, Vietnam
2Danang PMU-ICUD, Danang city, Vietnam
3The University of Danang - University of Technology and Education, Vietnam
*Corresponding author: lhson@dut.udn.vn
(Received: September 15, 2024; Revised: September 26, 2024; Accepted: October 15, 2024)
DOI: 10.31130/ud-jst.2024.569E
Abstract - This study investigates the application of network
analysis to optimize solid waste collection routes in Son Tra
District, Da Nang City. Twelve collection routes, encompassing
30 collection points, were tracked using GPS equipment and
digitized in QGIS. Key parameters such as length, velocity, and
time were analyzed. By employing the Dijkstra algorithm, route
optimization resulted in a significant reduction in average route
length, from 12.94 ± 3.5 km to 9.42 ± 2.67 km, representing a
9-42% improvement. A paired sample t-test confirmed the
statistical significance of this reduction (p<0.001). These findings
demonstrate the potential of network analysis to optimize waste
collection routes and reduce operational costs. However, the
model's limitations, such as its focus on static, point-based
collection routes and the exclusion of dynamic factors like traffic
conditions and residential habits, should be considered for future
research.
Key words - Municipal solid waste; Waste collection and
transportation; Vehicle routing problem; QGIS; Optimization
1. Introduction
Urbanization, driven by population growth and
economic development, worsens the challenge of managing
municipal solid waste (MSW). Increased consumption of
goods and products, especially those with short lifespans
and excessive packaging, contributes to a growing volume
and diversity of waste, particularly MSW [1]. Vietnam's
MSW generation has increased significantly, reaching
23.6 million tons annually. Urban areas contribute 35,000
tons daily, while rural areas generate 28,000 tons daily. This
represents a substantial 46% increase compared to 2010.
Major cities like Ho Chi Minh City (3.4 milions ton/year),
Hanoi (2.4 milion ton/year), and others account for about a
quarter of this total [2]. While 83-85% of urban MSW is
collected for treatment, the remaining 15-17% is disposed
of unsustainably, leading to severe environmental pollution
from open dumping and burning. The increasing generation
of MSW exacerbates the burden on waste management
authorities.
The national master plan aims to achieve a 95%
collection and treatment rate for municipal solid waste in
urban areas by 2030, ensuring compliance with all relevant
standards and regulations [3]. The socialization of waste
collection and transportation has been a key factor in
improving urban waste management. Thanks to this
approach, the MSW collection rate has risen from 78% in
2008 to 92% in 2019. Large and medium-sized cities have
achieved particularly high collection rates, with some cities
collecting 100% of their MSW. The collection services
have also been extended to smaller urban areas, covering
household, community, and public places [2].
While residents contribute through tipping fees (regular
environmental sanitation fees), these fees only account for
a small portion (20-25%) of the total costs of collecting and
transporting MSW. To ensure the sustainability of waste
management services, local governments, particularly the
People's Committees of provinces and cities, must allocate
a substantial portion of their budgets (48-55% of urban
public service costs) to cover the remaining expenses [4].
However, the inconsistency in tipping fees across different
localities remains a problem, leading to a lack of
standardization and uniformity. Lower service rates for
mechanized collection compared to manual methods have
discouraged businesses from investing in modern
technology to improve efficiency and reduce labor [5]. In
low-income areas, the collection and transportation of
MSW is often the most expensive part of urban solid waste
management, typically accounting for 70-90% of the total
costs [6]. Given the need to improve productivity and cut
costs, optimizing collection routes is imperative for waste
collection and transportation services [7].
Vehicel routing problems, or route optimization has
become a standard practice in the transportation sector, but
its application in urban solid waste collection remains
limited. Current collection routes in the city are manually
designed, heavily reliant on the experience of workers who
must possess a thorough understanding of local geography
and traffic conditions. The informal nature of these routes,
shaped by individual habits and gradual adjustments, is time-
consuming and lacks a systematic approach. The
overarching objective of route planning is to minimize the
number of trips and total distance traveled, thereby reducing
operational costs and increasing efficiency [8]. Numerous
studies have demonstrated the significant benefits of route
optimization, including improved labor productivity,
reduced operational costs, and enhanced competitiveness
among waste collection companies. Common optimization
techniques involve the use of Geographic Information
Systems (GIS) [9] - [14] or weighted graph models [15] -
[18]. This study aims to optimize waste collection routes in
Son Tra district, Da Nang City by implementing a vehicle
routing problem (VRP) model using network analysis
functions within QGIS.
ISSN 1859-1531 - THE UNIVERSITY OF DANANG - JOURNAL OF SCIENCE AND TECHNOLOGY, VOL. 22, NO. 11C, 2024 119
2. Methodology
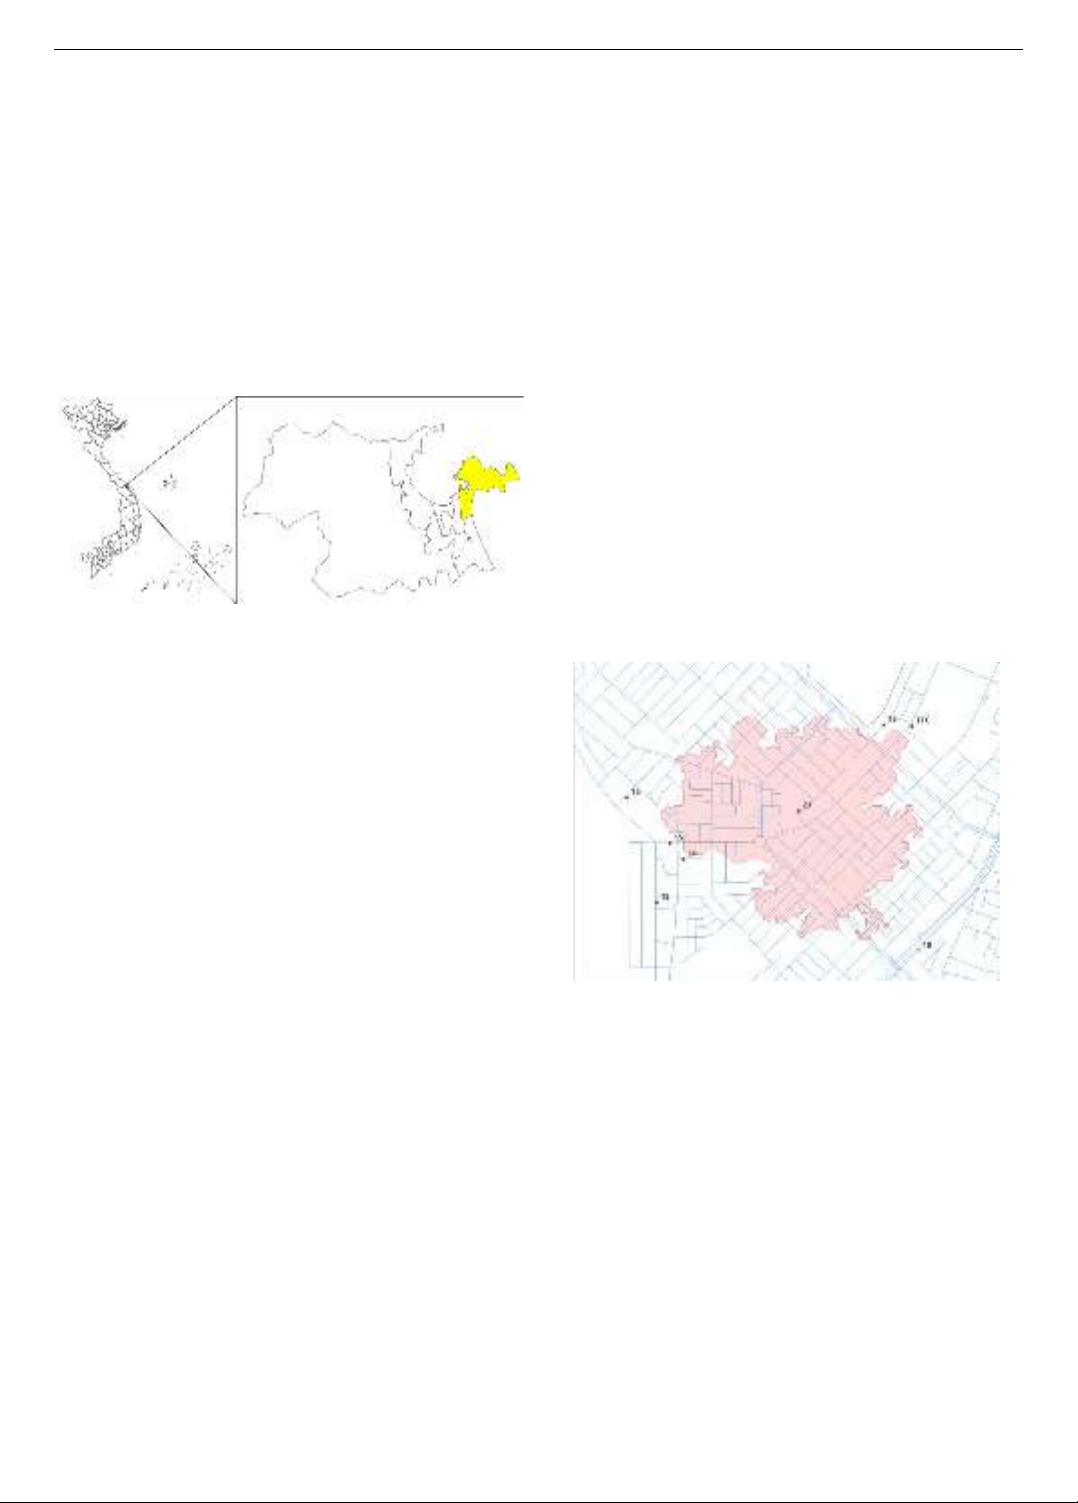
2.1. Research area
This study was conducted in Son Tra District, Da
Nang, Vietnam (Figure 1), focusing on residential areas
served by URENCO Son Tra. The district generates
approximately 185 tons of MSW daily, collected through
communal bins and door-to-door services. Wards with
high population densities and commercial activities, such
as Nai Hien Dong, An Hai Bac, An Hai Dong, and Man
Thai, produce over 24 tons of waste per day, while wards
with lower population densities, such as Tho Quang, An
Hai Tay, and Phuoc My, generate less than 20 tons. At the
time of the study (March 2023), 30 meeting points were
operational.
Figure 1. Research area
2.2. Data collection and analysis method
Data was collected through on-site surveys in the study
area. Based on the production plan of Son Tra
Environmental Enterprise, the research team identified the
collection routes, including: time, collection point names,
the order of collection at each collection point in each
route, and the type of vehicle. Additionally, investigators
directly followed the garbage trucks and used GPS
applications on smartphones to determine the coordinates
of the collection points. The location of the transfer station
and collection points is shown in Figure 3. Each waste
collection route consisted of three stages:
Moving forward: starting from the "transfer station" to
the "first collection point".
Collection: starting from the "first collection point" to
the "last collection point".
Moving backward: starting from the "last collection
point" to the "transfer station".
The study period was from December 2022 to March
2023.
2.3. Developing a spatial map
Each record includes survey route information, including
starting point, start of collection, end of collection, and
ending point, along with GPS coordinates. VN-2000 grid
coordinate (central meridian: 107o45’, zone: 3 degrees,
ellipsiod: WGS84) were used for this study, corresponding
to the Da Nang City area. Data was processed using QGIS
to analyze distances, times, and speeds for each segment
based on field data. Using the collected route data on the
QGIS map, the research team constructed a weighted matrix
of points and distances between them to serve the
optimization process. Figure 3 shows the results of the data
processing on the QGIS platform.
2.4. Data analysis
The mean and standard deviation were used to present
the analytical results. A paired sample t-test was conducted
to compare the travel distance before and after route
optimization. Data analysis was performed using R.
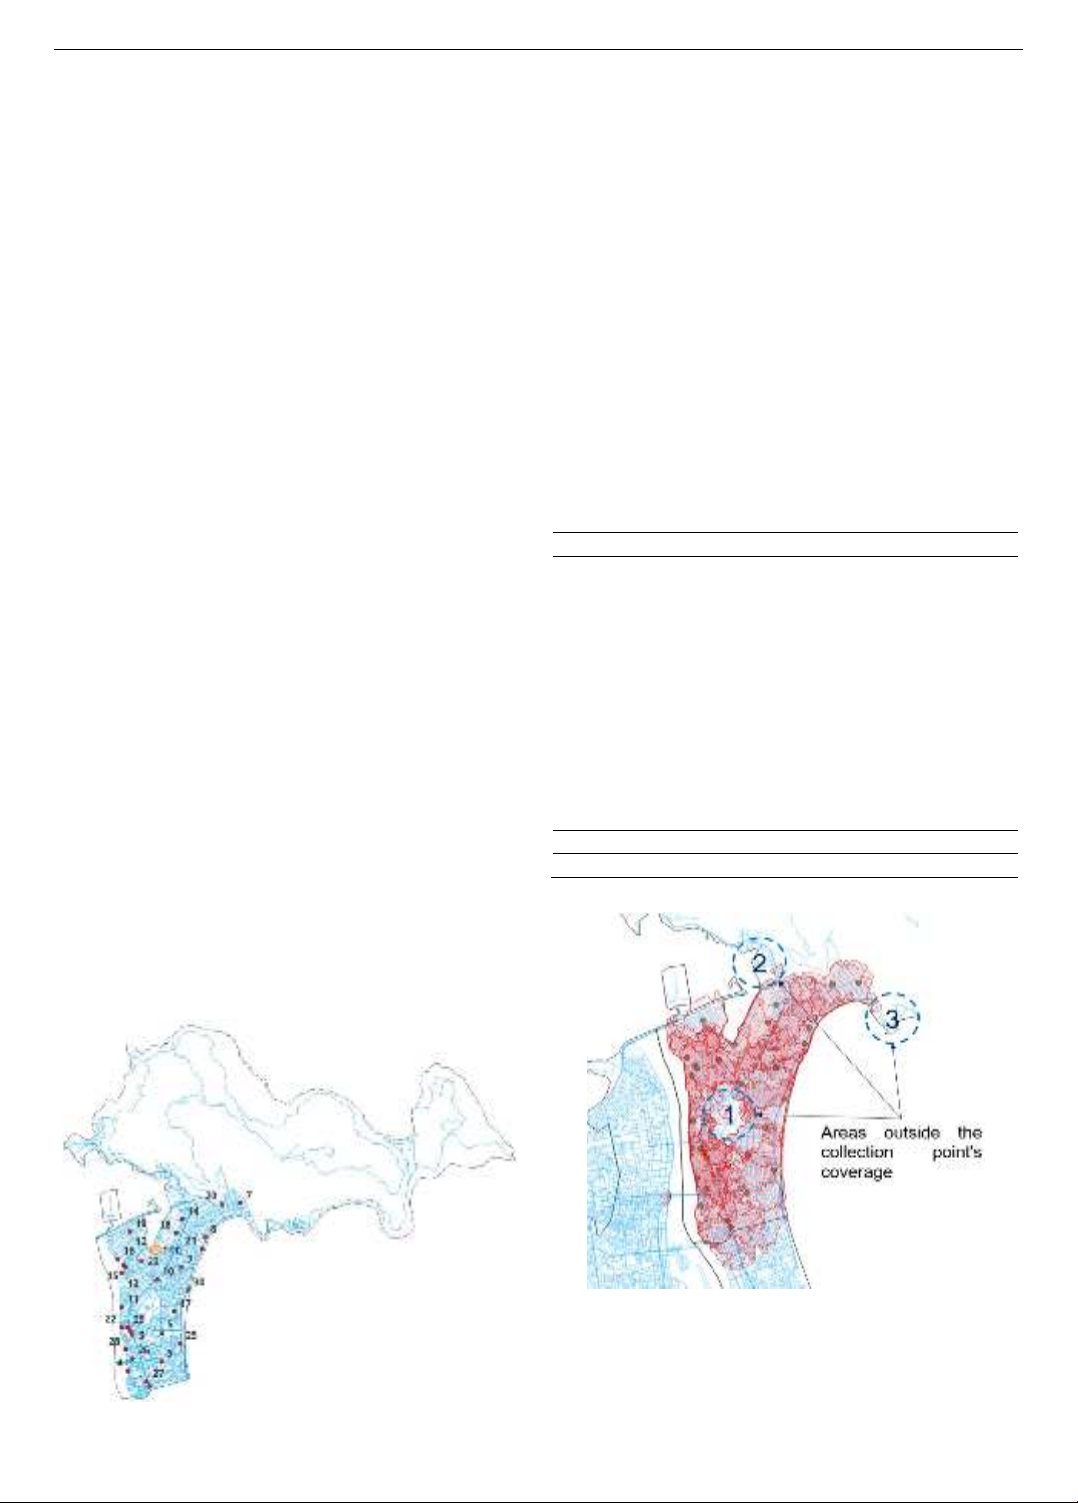
2.5. Assessment of the service coverage
This study employed the Time Travel Plugin in QGIS
to assess the coverage range of various features, including
collection points, service areas, and delivery routes. Figure
2 shows service coverage of collection point 23rd. The
following steps were undertaken:
Feature Selection: The point layer representing
collection points, service areas, or delivery routes was
selected.
Parameter Setting: The starting time, ending time,
and travel speed (set at 7.7 km/h) were specified.
Analysis Execution: The Time Travel analysis was
initiated.
Coverage Visualization: A new layer representing
the coverage area for each feature within the specified time
frame was created.
Coverage Evaluation: The extent and overlap of the
coverage areas were analyzed to assess the efficiency of
collection points, service areas, or delivery routes.
Figure 2. Service coverage of collection point 23rd
2.6. Waste collection route optimization
To identify the most efficient waste collection routes, a
network analysis was performed using QGIS Network
Analyst extension. By leveraging network analysis
functions within QGIS, efficient and cost-effective
collection routes that minimize travel distances, reduce
fuel consumption, and improve overall operational
efficiency was conducted.
The road network was modeled as a network dataset
with nodes representing intersections and links
representing road segments. A shortest path analysis was
conducted to determine the optimal routes for each vehicle,
considering factors such as road distance, traffic
congestion, and vehicle capacity. The outline of
optimization processes as follow:
Data Collection and Preparation: Relevant data on
the road network, waste collection points, and vehicle
characteristics was gathered. This data was subsequently
120 Le Hoang Son, Truong Nguyen Song Ha, Nguyen Ngoc Phuong, Phan Bao An
used to construct a network dataset in QGIS, with
intersections defined as nodes and road segments as links.
Attributes such as length, travel time, and road type were
assigned to these links.
Define the Optimization Problem: The primary
objective of this study is to minimize total travel distance,
working hours, and workload among vehicles. This
optimization is subject to constraints such as vehicle
capacity, driver hours of service, time windows for waste
collection, and road restrictions.
Create Network Analysis Layers: Point layers were
established for waste collection points, demand points, and
transfer stations. A line layer was also created to represent
the road network.
Configure Network Analysis Settings: The network
dataset attributes were defined as length (km) and travel
time (minutes). The Dijkstra algorithm was selected as the
solver based on the optimization objectives and
constraints.
Run Network Analysis: Using QGIS's network
analysis tools, shortest paths between waste collection
points and transfer stations were generated, incorporating
factors such as time windows, vehicle capacity, and traffic
congestion.
6. Analyze and Interpret Results: The generated routes
were evaluated to ensure their alignment with optimization
objectives and constraints. QGIS was used to visualize the
optimized routes on a map. Potential areas for further
optimization were identified through a thorough
assessment of the results.
3. Result and discussion
3.1. Current status of collection routes
The manual collection of MSW in Son Tra district is a
labor-intensive process, with an average of 389 daily trips
to 30 collection points, amounting to 58.9 tons of waste.
Compactor trucks are then used to transport this waste to
the Son Tra transfer station. The locations of these
collection points and the transfer station are depicted in
Figure 3.
Figure 3. Collection points and transfer station
The daily routine of primary waste collectors involved
starting their shift at 6:30 AM and ending at 3:00 PM,
completing an average of 9 collection trips. Each manual
collection required traversing a distance of approximately
2.4 ± 0.3 km, taking around 18.4 ± 4.3 minutes at an average
speed of 7.7 ± 1.6 km/h. The round trip component of each
collection, which accounted for approximately 1.0 ± 0.2 km,
was typically completed in 4.0 ± 1.2 minutes [19].
URENCO Son Tra employs a fleet of 2 compactor
trucks, each with a 5-ton capacity, to facilitate secondary
waste collection. These trucks can accommodate
approximately 34 dustbins (660L) per trip, transporting
MSW from collection points to the Son Tra transfer station.
The average round trip distance for these collections is 12.94
± 3.5 km, completed in an average of 29 ± 3 minutes. As
outlined in Table 1, a total of 12 trips are necessary to collect
and transport the equivalent of 389 dustbins (660L) from the
30 designated collection points, covering a cumulative
distance of 155.3 km and requiring a total of 348 minutes.
Table 1. Curent status of collection route
Route
Dustbin
Distance (km)
Time (min)
1
33
12.9
29
2
33
13.2
31
3
34
7.8
25
4
29
16.8
31
5
31
12.1
28
6
33
13.8
27
7
34
7.8
25
8
33
18.9
37
9
31
11.0
28
10
30
13.6
27
11
34
10.0
26
12
34
17.3
34
Ave
32.42 ± 1.73
12.94 ± 3.5
29 ± 3
Total
389
155.3
348
3.2. Assessment of the service coverage
Figure 4. Collection point’s coverage
Figure 4 illustrates the simulated service areas of the
planned collection points. The analysis reveals three
uncovered areas: An Don Industrial Zone, Tien Sa
Port, and Son Tra Marina F&B service area. Since these
areas are non-residential, the current distribution of
ISSN 1859-1531 - THE UNIVERSITY OF DANANG - JOURNAL OF SCIENCE AND TECHNOLOGY, VOL. 22, NO. 11C, 2024 121
collection points in Son Tra adequately serves the
residential population.
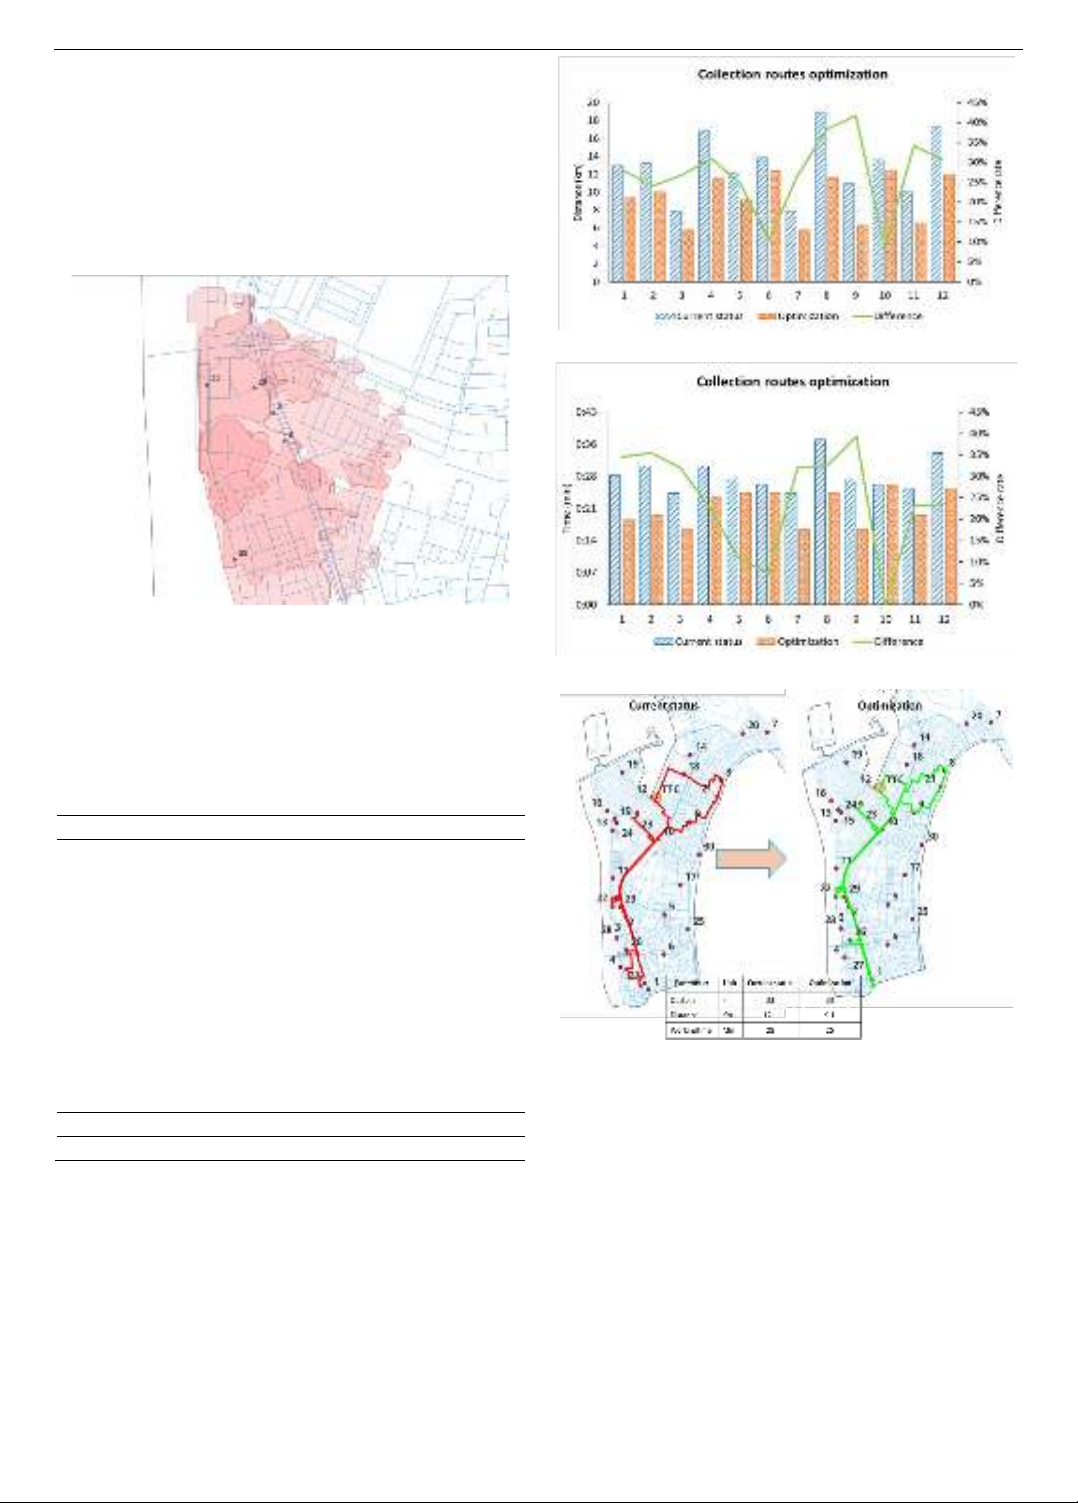
Figure 5 highlights instances where the proximity of
collection points results in overlapping service areas,
compromising the efficiency of waste collection operations
in those areas. To address this issue and improve both
operational efficiency and urban aesthetics, a realignment
of collection points within the Son Tra area is
recommended.
Figure 5. Overlapping service areas
3.3. Waste collection route optimization
As summarized in Table 2, route optimization resulted
in a total distance reduction from 155.3 km to 113 km,
representing a 27.2% savings. Additionally, the
optimization process reduced working time from 348
minutes to 262 minutes, resulting in a 24.7% time savings.
Table 2. Optimization of collection route
Route
Dustbin
Distance (km)
Time (min)
1
33
9.3
19
2
33
10.0
20
3
34
5.7
17
4
29
11.6
24
5
31
9.1
25
6
33
12.4
25
7
34
5.7
17
8
33
11.6
25
9
27
6.4
17
10
34
12.4
27
11
34
6.6
20
12
34
12.0
26
Ave
32.42 ± 1.73
9.42 ± 2.67
22 ± 4
Total
389
113
262
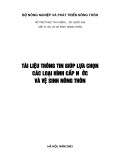
As illustrated in Figure 6 and Figure 7, route
optimization led to a significant reduction of 9% to 42%
compared to current practices, with variation across
different routes. A paired sample t-test confirmed the
statistical significance of this difference (p<0.001). These
findings align with previous studies by Navarro et al.
(Bolivia, 7%) and Rim Sallem et al. (Tunisia, 4.19-
14.68%) [8, 16]. In line with Kinobe et al.'s findings in
Kampala, route optimization in this study demonstrated a
potential reduction in travel distance of 2-40% [7]. The
optimized routes No 5 are visualized in Figure 8.
Figure 6. Evaluation by distance
Figure 7. Evaluation by working time
Figure 8. Optimization for route No 5.
4. Conclusion
This study explored the application of network analysis
to optimize solid waste collection routes in Son Tra
District. The results demonstrate the effectiveness of this
approach in reducing travel distance and potentially
lowering operational costs. However, it is crucial to note
that the model's limitations include a focus on point
collection routes and the exclusion of dynamic factors like
traffic conditions and residential habits.
Our findings suggest that by optimizing routes, a
substantial reduction in travel distance, ranging from 9% to
42%, can be achieved. This improvement is statistically
significant and has the potential to enhance the overall
efficiency of waste collection operations.

122 Le Hoang Son, Truong Nguyen Song Ha, Nguyen Ngoc Phuong, Phan Bao An
REFERENCES
[1] United Nation Environmental Program, "Developing Integrated
Solid Waste Management Plan", Osaka, Japan, 2009.
[2] Ministry of Natrural Resource and Environment, "National
Environmental Status Report 2019: Domestic solid waste
management", Hanoi, Vietnam, 2020.
[3] National Assembly of Vietnam, "National master plan for the period
2021 - 2030, vision to 2050", Hanoi, Vietnam, 2023.
[4] Ministry of Construction, Circular guidance on determination and
management of costs of urban public services No. 14/2017/TT-
BXD, 2017.
[5] Journal of Environment and Urban, "Discussion on costs of
collection, transportation, and treatment of household solid waste",
quanly.moitruongvadothi.vn, June 3, 2022 [online]. Available:
https://quanly.moitruongvadothi.vn/1/13615/Tong-thuat-Toa-dam-
Chi-phi-thu-gom-van-chuyen-xu-ly-chat-thai-ran-sinh-hoat.aspx
[Accessed April 24, 2024].
[6] A. S. Aremu, “In town tour optimization of conventional mode for
municipal solid waste collection”, Niger. J. Technol., vol. 32, no. 3,
pp. 443–449, 2013.
[7] J. R. Kinobe, T. Bosona, G. Gebresenbet, C. B. Niwagaba, and B.
Vinnerås, “Optimization of waste collection and disposal in
Kampala city”, Habitat Int., vol. 49, pp. 126–137, 2015, doi:
10.1016/j.habitatint.2015.05.025.
[8] R. Sallem, M. M. Serbaji, A. M. Alamri, A. Kallel, and I. Trabelsi,
“Optimal routing of household waste collection using ArcGIS
application: a case study of El Bousten district, Sfax city, Tunisia”,
Arab. J. Geosci., vol. 14, no. 11, 2021, doi: 10.1007/s12517-021-
07265-2.
[9] T. Ogwueleke, “Route optimization for solid waste collection:
Onitsha (Nigeria) case study”, J. Appl. Sci. Environ. Manag., vol.
13, no. 2, pp. 6–11, 2010, doi: 10.4314/jasem.v13i2.55299.
[10] S. Sahoo, S. Kim, B. I. Kim, B. Kraas, and A. Popov, “Routing
optimization for Waste Management”, Interfaces (Providence)., vol.
35, no. 1, pp. 24–36, 2005, doi: 10.1287/inte.1040.0109.
[11] J. Q. Li, D. Borenstein, and P. B. Mirchandani, “Truck scheduling
for solid waste collection in the City of Porto Alegre, Brazil”,
Omega, vol. 36, no. 6, pp. 1133–1149, 2008, doi:
10.1016/j.omega.2006.04.007.
[12] M. K. Ghose, A. K. Dikshit, and S. K. Sharma, “A GIS based
transportation model for solid waste disposal - A case study on
Asansol municipality”, Waste Manag., vol. 26, no. 11, pp. 1287–
1293, 2006, doi: 10.1016/j.wasman.2005.09.022.
[13] P. N. Huyen, “Assessing the Current Situation and Application of
Gis Technology in the Management of Domestic Solid Waste
Collection and Transportation in Dong Hoi City, Quang Binh
Province”, Master dissertation, The University of Danang -
University of Science and Technology, Danang, Vietnam, 2015.
[14] P. H. Thang, “Research on GIS application to improve the efficiency
of household solid waste collection in Dien Bien Phu city, Dien Bien
province”, Master dissertation, University of Natural Resource and
Environment Hanoi, Hanoi, Vietnam, 2017.
[15] H. D. Tuyen, “Postman Problem and Application to Find Optimal
Garbage Collection Vehicle Route in Dong Hoi City”, Quang Binh
University - Journal of Science and Technology, vol. 4, no. 1, pp. 1–
6, 2015.
[16] N. Ferronato, G. Preziosi, M. A. G. Portillo, E. G. G. Lizarazu, and
V. Torretta, “Assessment of municipal solid waste selective
collection scenarios with geographic information systems in
Bolivia”, Waste Manag., vol. 102, pp. 919–931, 2020, doi:
10.1016/j.wasman.2019.12.010.
[17] J. Janela, M. C. Mourão, and L. S. Pinto, “Arc routing with trip-
balancing and attractiveness measures - A waste collection case
study”, Comput. Oper. Res., vol. 147, no. November 2021, p.
105934, 2022, doi: 10.1016/j.cor.2022.105934.
[18] M. A. Hannan et al., “Solid waste collection optimization objectives,
constraints, modeling approaches, and their challenges toward
achieving sustainable development goals”, J. Clean. Prod., vol. 277,
p. 123557, 2020, doi: 10.1016/j.jclepro.2020.123557.
[19] L. H. Son and N. N. Phuong, “The potential of weighted graph
models for household solid waste collection route optimization: a
case study in Son Tra, Danang”, The University of Danang - Journal
of Science and Technology (UD-JST), vol. 22, no. 4, p.90-94, 2024.


![Bài giảng Cấp nước và vệ sinh môi trường nông thôn [chuẩn nhất]](https://cdn.tailieu.vn/images/document/thumbnail/2025/20250522/phongtrongkim2025/135x160/406_bai-giang-cap-nuoc-va-ve-sinh-moi-truong-nong-thon.jpg)


![Ô nhiễm không khí từ nông nghiệp: Thách thức toàn cầu và định hướng hành động [Mới nhất]](https://cdn.tailieu.vn/images/document/thumbnail/2025/20250917/kimphuong1001/135x160/52891758099584.jpg)