
Ann. For. Sci. 63 (2006) 537–546 537
c
INRA, EDP Sciences, 2006
DOI: 10.1051/forest:2006036 Original article
High potential for increase in CO2flux from forest soil surface
due to global warming in cooler areas of Japan
Shigehiro Ia,b*,**, Tadashi Sa*,b, Satoshi S c, Shigeto Ib*,d,
Chisato Te, Nobuaki Te,f*,HisaoSa*,g, Takanori Sh,KensakuK-Ni,
Shin-ichi Oj, Nagaharu Ta, Masamichi Tb
aHokkaido Research Center, Forestry and Forest Products Research Institute, 7 Hitsujigaoka, Sapporo, Hokkaido 062-8516, Japan
bForestry and Forest Products Research Institute, Tsukuba, Ibaraki 305-8687, Japan
cAkita Prefecture Forest Technology Center, Akita, Akita 019-2611, Japan
dTohoku Research Center, Forestry and Forest Products Research Institute, Morioka, Iwate 020-0123, Japan
eGraduate School of Bioagricultural Sciences, Nagoya University, Nagoya, Aichi 464-8601, Japan
fMizuho Information and Research Institute Inc., Tokyo 101-8443, Japan
gKiso Experimental Station, Forestry and Forest Products Research Institute, Kisogun, Nagano 397-0001, Japan
hKyushu Research Center, Forestry and Forest Products Research Institute, Kumamoto, Kumamoto 860-0862, Japan
iOkinawa Prefecture Forestry Experiment Station, Nago, Okinawa 905-0017, Japan
jHiroshima University, Higashi Hiroshima, Hiroshima 739-8521, Japan
(Received 8 December 2005; accepted 22 February 2006)
Abstract – The CO2fluxes from the forest floor were measured using a closed chamber method at 26 sites from 26◦NLat.to44
◦N Lat. in Japan.
Seasonal fluctuation in CO2flux was found to correlate exponentially with seasonal fluctuation in soil temperature at each site. Estimate of annual
carbon emission from the forest floor ranged from 3.1 to 10.6 Mg C ha−1. The emission rate of soil-organic-carbon-derived CO2, obtained by incubation
of intact soil samples, correlated closely with the carboxymethylcellulase (CMCase) activity in the soil. The sum of cool-water soluble polysaccharides,
hot-water soluble polysaccharides, hemicellulose, and cellulose content in the soil was greater at the sites with low CMCase activity than that at the
sites with high CMCase activity. Because the sites in cooler-climate sites had a high content of easily decomposable soil organic carbon and organic
litter, the potential increase in CO2efflux from forest floor with increasing soil temperature would be greater in cooler-climate sites.
cellulose /Japanese forest /soil organic carbon /soil respiration
Résumé – Fort potentiel d’accroissement de flux de CO2issu de la surface du sol forestier en relation avec le réchauffement global dans les
régions fraîches du Japon. Le flux de CO2issu du sol forestier a été mesuré dans 26 sites, allant du 26◦au 44◦de latitude Nord dans l’archipel
japonais, en utilisant la méthode des chambres fermées. Il a pu être mis en évidence que la fluctuation saisonnière du flux de CO2était corrélée de
façon exponentielle avec celle de la température du sol de chacun des sites étudiés. L’estimation annelle de l’émission de carbone venant du sol variait
de 3,1 à 10,6 Mg C ha−1. Le taux d’émission de CO2obtenu par incubation d’échantillons intacts de sol est corrélé positivement avec l’activité de la
carboxyméthacellulase (CMCase), dans le sol. La somme totale des polysaccharides solubles dans l’eau froide, des polysaccharides solubles dans l’eau
chaude, des hémicelluloses et de la cellulose contenus dans le sol était plus grande dans les sites caractérisés par une faible activité CMCase que dans
les sites avec une forte activité CMCase. Du fait que les sites en climat frais ont un contenu élevé en carbone organique du sol facilement décomposable
et une litière organique, le potentiel d’accroissement du flux de CO2avec l’accroissement de la température du sol devrait être plus grand dans les sites
à climat frais.
cellulose /forêt japonaise /carbone organique du sol /respiration du sol
1. INTRODUCTION
Carbon dioxide (CO2) is the most important greenhouse
gas, contributing to 60% of global warming [12]. The world-
wide carbon stock in soils is estimated to be 1500 Pg, three
times greater than that in terrestrial plants [12], and soil car-
bon is gradually mineralized by microorganisms to be released
* Present address.
** Corresponding author: ishiz03@ffpri.affrc.go.jp
to the atmosphere as CO2gas. Generally the forest ecosys-
tem is considered to be a CO2sink [33], but if the decompo-
sition of soil carbon in the forest ecosystems is promoted by
global warming, it would be doubtful whether forests could
serve as CO2sinks. A recent study shows that soil in England
and Wales lost carbon at a mean rate of 0.6% y−1from 1978
to 2003 according to soil inventory data [1]. In light of global
warming, the amount of carbon transferred from soil organic
matter to the atmosphere is a serious concern [5].
Article published by EDP Sciences and available at http://www.edpsciences.org/forest or http://dx.doi.org/10.1051/forest:2006036
538 S. Ishizuka et al.
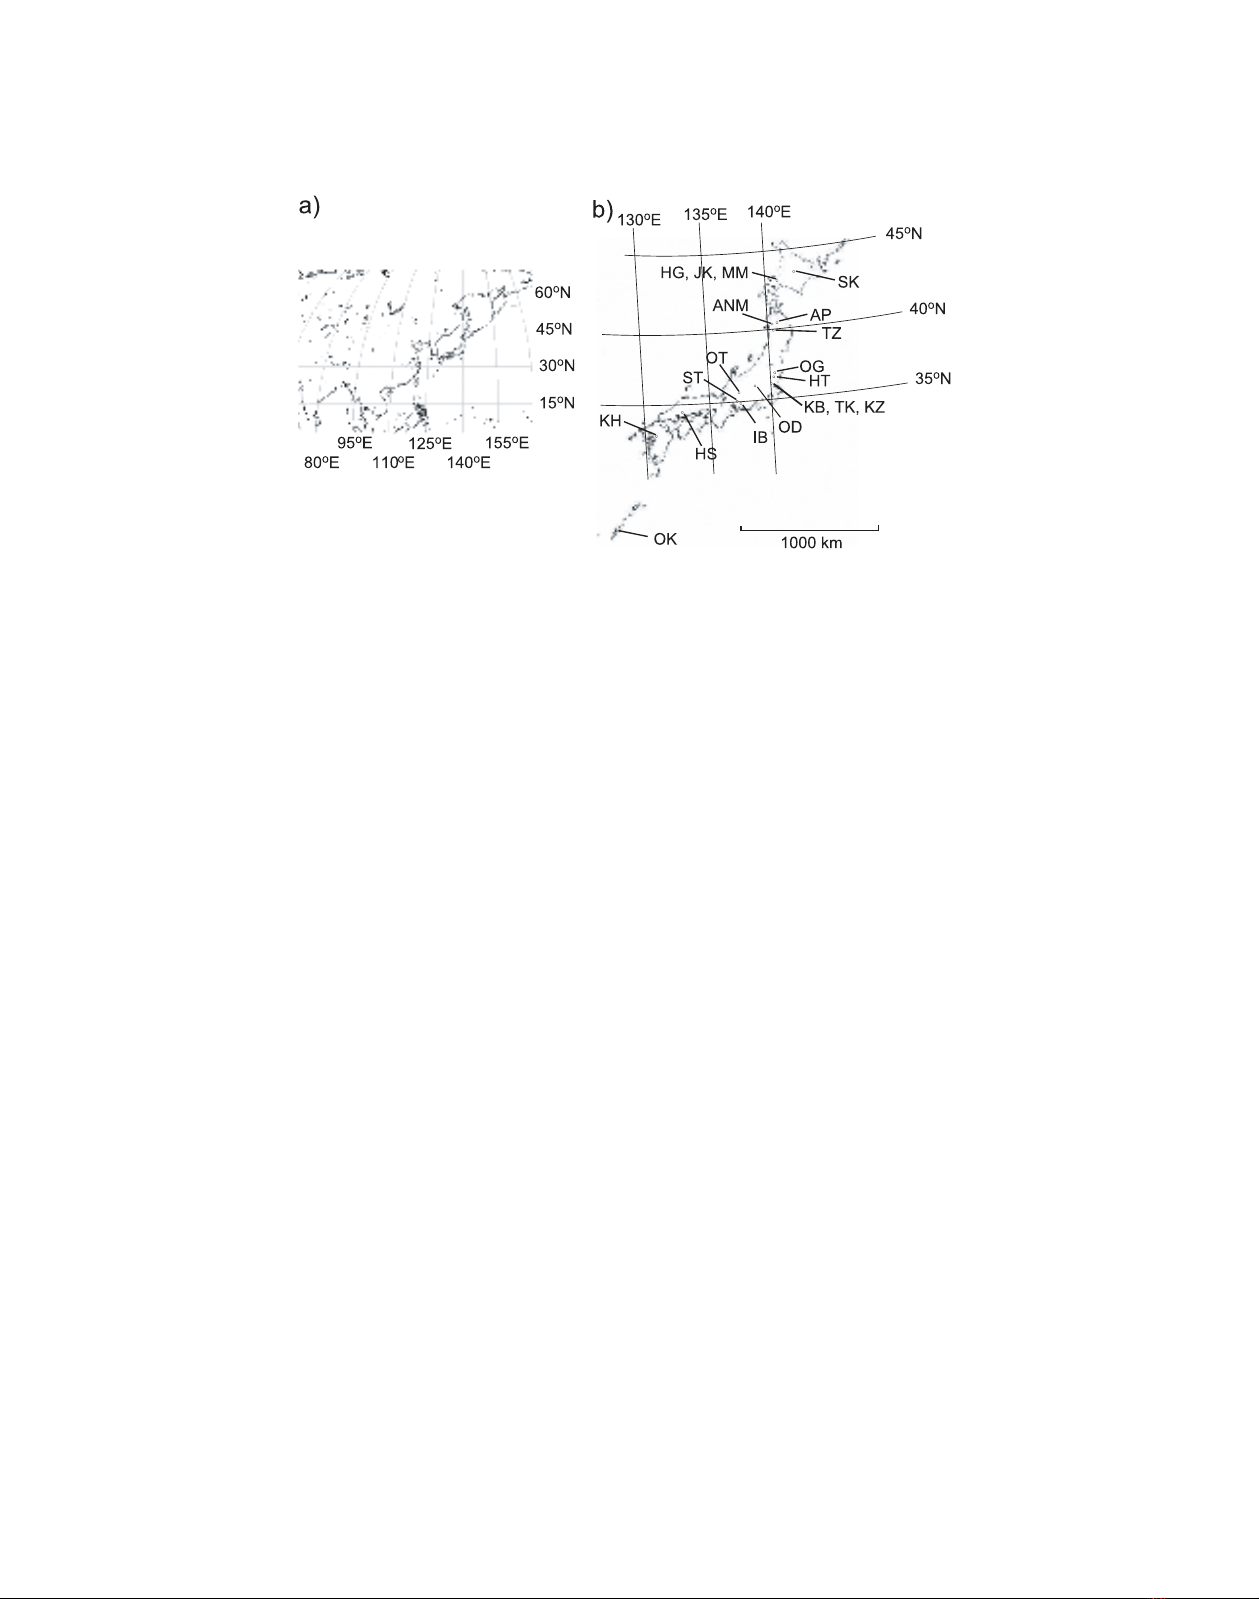
Figure 1. (a) Japan in East Asia, (b) sampling sites in Japan.
Many factors affect the decomposition of soil organic car-
bon in a forest ecosystem. Soil temperature often controls
the seasonal fluctuation of soil respiration, which increases in
summer and decreases in winter [7]. Rainfall and soil water
content also affect the soil respiration, as is seen in the suppres-
sion of soil respiration by drought in Mediterranean forests
in summer [15]. Besides environmental factors, the quality of
organic matter is important. Soil organic carbon consists of
various components with different turnover rates. Radiocarbon
study indicates that the turnover times of soil organic carbon
range from decades (or shorter) to millennia [31, 32]. Accord-
ing to these studies, the cooler the climate is, the more organic
carbon with short turnover time accumulates [31]. Thus when
we consider the effects of global warming on soil organic car-
bon, we need to take into account changes in the proportion of
components with different turnover rates, as well as the direct
effect of temperature on soil organic matter decomposition.
In a soil warming experiment, soil respiration was found to
increase for the initial 6 years to 28% of the respiration be-
fore the experiment, but respiration was negligible from the
tenth year onward, suggesting that the consumption of eas-
ily decomposable substrates within ten years serves as a lim-
iting factor [18]. Another interpretation for the global warm-
ing effect on the soil respiration is possible: changes in soil
respiration may be caused by changes in net primary produc-
tion, which is related to the input of organic matter to the
soil [16, 18]. Therefore, the relationship between the quality
and quantity of soil carbon and CO2flux from the soil surface,
and litter respiration remains a serious concern [10].
On the global scale, the amount of soil respirations is
greater in warmer climates than in cooler climates [23]. In the
tropics, vigorous plant growth and rapid decomposition of soil
organic matter are responsible for the high rates of soil respira-
tion [26]. Cold temperature inhibits organic matter decomposi-
tion, which results in the low rate of soil respiration seen in bo-
real forests [25]. On a continental scale, soil respiration varies
from site to site. It does not relate to mean annual tempera-
ture over a wide range of European forest ecosystems [9, 15].
Davidson et al. [5] suggest that this insensitivity to temperature
results from a great accumulation of easily decomposable sub-
strates in cool climates. However, few studies had been con-
ducted to examine how soil respiration varies with latitude. To
estimate the soil respiration rate on a global scale, observation
at different latitude at another longitude would be useful.
Much soil respiration research has been conducted on for-
est ecosystems in Japan, but different researches have used dif-
ferent methods (e.g., alkaline absorption, dynamic chamber),
which raises the problem of comparing data among sites. The
objectives of this research are (1) to compare soil respiration
in various forest ecosystems at different latitude in Japan, from
26◦Nto44
◦N Lat., using a single method, and (2) to analyze
the relationship between CO2flux from the soil and the quali-
ties of soil organic carbon. This study promises to contribute to
understanding of Japan-wide CO2emission from the soil sur-
face and the characteristics of soil organic carbon in Japanese
forests.
2. MATERIALS AND METHODS
2.1. Site description
We established 26 forested plots for CO2flux measurement
through the Japanese islands from 26◦Nto44
◦NLat.(Fig.1
and Tab. I). These are mainly humid temperate forests, with four
exceptions: 1 subtropical forest (OK) and 3 sub-alpine coniferous
forests (SK, OD1 and OD2). The mean annual soil temperatures of
these sites range from 4 to 22 ◦C. The mean annual rainfall for the
last ten years at the meteorological station nearest each site ranged
from 1200 to 3500 mm (1630 mm on average) (Japan Meteorolog-
ical Agency, Automated Meteorological Data Acquisition System:
http://www.data.kishou.go.jp/). The northern sites (SK, HG, JK, MM,
AP, ANM and TZ) and the high-altitude sites (OD and OT) are usu-
ally covered with snow from December through April. The central
sites (OG, HT, KB, TK, KZ, ST and IB) are sometimes covered with
snow for a few weeks in winter. The ages of trees at all plantations
were greater than 20 years. Four soil types (Cambisol, Andosol, Pod-
zol and Alisol) exist at the study sites, and most sites are affected by

CO2flux from soil surface in Japan 539
Table I . General Information of the Sites.
Site Lat. Long. Elev. VegetationaForest Soil typebAnnual Avg. soil Flux observation Number of
(m) type rainfallctemp. (˚C) period samplings
SK 43◦40’ 143◦06’ 1000 PJ, AS Natural Podzol 1418 4.1eSep 99 – Oct 01 8
JK 42◦58’ 141◦10’ 322 AS Planted Cambisol 1268 7.3eJun99–May01 6
MM 42◦56’ 141◦16’ 440 AS Planted Cambisol 1268 6.4fJun99–Sep99 4
HG1 42◦59’ 141◦23’ 240 BP, QM Natural Andosol 1167 7.6fJun98–Sep99 12
HG2 42◦59’ 141◦23’ 260 BP, QM Natural Andosol 1167 7.5fJun98–Sep99 11
HG3 42◦59’ 141◦23’ 175 BP, QM Natural Andosol 1167 8.3eJun98–Aug00 6
AP 39◦59’ 140◦54’ 825 FC Natural Andosol 1207 6.9eJun00–Nov01 13
ANM 39◦59’ 140◦24’ 200 CJ Planted Cambisol 2006 9.4fJun01–Nov02 14
TZ 39◦46’ 140◦43’ 350 CJ Planted Andosol 2188 9.6eJul 00 – May 02 13
OG1 36◦56’ 140◦35’ 650 FC, FJ Natural Andosol 1948 10.6eMay 95 – Mar 02 30
OG2 36◦56’ 140◦35’ 650 FC, FJ Natural Cambisol 1948 10.6eJul 95 – Mar 98 13
OG3 36◦56’ 140◦35’ 650 CJ Natural Andosol 1948 9.5eJun97–Mar02 18
OG4 36◦56’ 140◦35’ 650 QS, CA Deforested Cambisol 1948 NDgNov 96 – Dec 97 6
HT 36◦35’ 140◦35’ 380 CA MixeddCambisol 1371 12.1fJul97–May98 6
KB1 36◦18’ 140◦09’ 470 CA, QM MixeddCambisol 1310 11.1fAug97–Jun02 23
KB2 36◦19’ 140◦09’ 250 CO Planted Cambisol 1310 12.0eApr 99 – Jun 02 19
TK 36◦10’ 140◦11’ 330 CJ Planted Andosol 1310 12.2fMay95–Nov95 6
KZ 36◦00’ 140◦08’ 22 CO Planted Andosol 1203 14.0fFeb 95 – Aug 95 5
OT 35◦55’ 137◦19’ 1350 CO Planted Andosol 3502 6.4fAug 00 – Dec 01 13
OD1 35◦51’ 138◦39’ 2090 AV Natural Podzol 1365 4.2eJun99–Sep01 14
OD2 35◦51’ 138◦39’ 2080 LK Planted Podzol 1365 5.2eJun99–Sep01 14
ST 35◦14’ 137◦08’ 630 CO Planted Cambisol 1528 11.2eJul 00 – Dec 01 14
IB 35◦12’ 137◦34’ 1010 CO Planted Cambisol 1972 9.3eJul 00 – Dec 01 14
HS 34◦24’ 132◦43’ 240 PD Natural Cambisol 1513 15.1fOct01–Dec01 3
KH 33◦05’ 130◦26’ 165 CO, CJ Planted Cambisol 2072 14.2eMay 00 – Mar 03 35
OK 26◦31’ 127◦59’ 100 CC Natural Alisol 2131 21.5eApr 99 – Jan 02 7
aAV: Abies veitchii,AS:Abies sachalinensis,BP:Betula platyphylla,CA:Carpinus spp., CC: Castanopsis cuspidata,CJ:Cryptomeria japonica,CO:
Chamaecyparis obtusa,FC:Fagus crenata,FJ:Fagus japonica,LK:Larix kaempferi, CJ: Cryptomeria japonica,CO:Chamaecyparis obtusa,FC:
Fagus crenata,FJ:Fagus japonica,LK:Larix kaempferi, PD: Pinus densiflora,PJ:Picea jezoensis,QM:Quercus mongolica,QS:Quercus serrata.
bWRB classification (ISSS Working Group RB, 1998).
c1993–2002 at the nearest meteorological station of Japan Meteorological Agency.
dUnsuccessful afforestation (overgrown by natural vegetation).
eAverage soil temperature through a year measured with a thermorecorder at 1-h intervals.
fEstimation; based on the mean annual air temperature at the nearest meteorological station and the elevation of the site.
gND: cannot be estimated because the daily fluctuation of flux did not correlate with soil temperature due to deforestation.
volcanic ash deposition to some extent even though the soil is not
Andosol. The general soil properties are shown in Table II.
2.2. Flux measurement
CO2flux was measured by static chamber method [24]. Three or
five stainless-steel chambers (40 cm in diameter, 15 cm in length)
were inserted in the soil to a depth of at least 1 cm at each site. Each
chamber was fixed at its location throughout the observation period.
For CO2flux measurement, the chamber was covered with a PVC
lid with a sampling port and an air bag to equalize the air pressure
in the chamber. We took gas samples from the chamber using a dis-
posable syringe at 0, 10, 20 and 40 min elapsed after the chamber
was covered with a lid. Each gas sample was filled into a glass vial
with a butyl rubber top that had been evacuated beforehand in the
laboratory. The CO2gas concentration was determined using a gas
chromatograph equipped with a thermal conductivity detector (Shi-
mazu GC-14B-TCD, Japan). A 5-mL gas sample was used for anal-
ysis. Standard calibration was made using standard gases of 310 and
4130 µLCO
2L−1(Sumitomo Seika Chemicals Co., Japan). We cal-
culated fluxes using a non-linear model [11], in which the chamber
volume was corrected according to the air pressure for the altitude of
the plot. The CO2fluxes were measured monthly, avoiding a rainy

540 S. Ishizuka et al.
Table II. Soil characteristics of the surface 5 cm of soil.
Site pH Water Total C Total N Bulk Inorganic N Microbial Soil texture
(H2O) content density NH4-N NO3-N biomass C Sand Silt Clay
kg kg−1mg g−1mg g−1Mg m−3µgg
−1µgg
−1µgCg
−1(%) (%) (%)
SK 4.2 0.78 86 4.6 NDa17.2 2.0 1305 51.3 27.8 20.9
JK 5.1 0.45 50 3.1 NDaNDaNDaNDa50.0 32.6 17.4
MM 5.3 0.59 55 4.0 0.46 25.0 2.3 NDa56.8 34.0 9.2
HG1,2 6.0 0.68 78 5.7 0.55 19.7 1.7 534 59.7 25.1 15.2
HG3 6.2 1.08 104 5.6 0.36 11.8 0.5 1704 NDaNDaNDa
AP 4.5 1.17 129 8.7 0.41 21.5 7.8 3119 16.3 40.2 43.4
ANM 5.2 NDa300 12.5 NDaNDaNDaNDa11.9 53.5 34.6
TZ 5.8 1.23 140 8.6 0.33 21.7 12.9 1702 13.5 75.4 11.1
OG1 4.9 1.67 230 13.0 0.33 13.8 15.3 2262 NDaNDaNDa
OG2 4.8 0.78 54 4.0 0.51 9.0 1.2 1524 NDaNDaNDa
OG3 4.5 1.04 162 10.4 0.35 NDaNDaNDa30.9 20.1 49.0
OG4 4.8 0.64 94 5.6 0.58 10.6 6.4 2021 63.1 22.5 14.4
HT 4.5 0.50 48 3.1 0.55 13.5 18.5 NDa40.9 36.5 22.6
KB1 4.6 0.94 125 10.2 0.34 10.0 9.2 NDa62.6 18.3 19.2
KB2 NDa1.32 148 9.1 0.30 NDaNDaNDaNDaNDaNDa
TK 4.4 1.45 169 11.0 0.31 14.9 48.8 NDaNDaNDaNDa
KZ NDaNDaNDaNDaNDaNDaNDaNDaNDaNDaNDa
OT 4.1 1.68 133 9.2 0.31 20.6 22.3 1700 NDaNDaNDa
OD1 3.7 1.18 212 11.6 0.32 14.9 14.2 3275 43.1 20.7 36.2
OD2 4.0 0.62 132 7.5 0.55 13.6 9.3 2361 59.6 16.5 23.9
ST 4.2 0.45 24 1.7 0.79 9.7 1.9 634 26.1 20.2 53.6
IB 4.8 1.04 80 4.6 0.51 20.4 5.3 1123 25.3 21.6 53.1
HS 4.3 0.36 71 3.4 0.88 13.1 0.3 1008 74.3 12.7 13.0
KH 4.5 0.61 42 2.7 0.84 13.8 0.1 1157 28.3 37.5 34.2
OK 4.9 0.25 50 2.4 0.80 8.8 0.4 1632 41.6 38.9 19.4
aNot determined.
day. When snow covered the whole surface of the chamber, we did
not take gas samples. While collecting gas samples, we measured the
air temperature 1 m above the ground and the soil temperature at 5 cm
depth. Soil temperature at 5 cm depth was also recorded hourly using
a data logger (TR-71S or TR-52, T & D Co., Japan). At sites without a
temperature data logger, hourly soil temperature was estimated from
the air temperature obtained from the nearest meteorological station
(Japan Meteorological Agency, Automated Meteorological Data Ac-
quisition System) using the relationship between air temperature and
soil temperature measured on sampling days. We defined an “inte-
grated soil temperature” as the sum of the daily average soil temper-
atures for one year.
2.3. Soil analysis
Soils for chemical analysis were sampled from the depths of 0–5,
5–10 and 10–15 cm. All soils were sieved with a 2-mm-mesh sieve
and stored in a refrigerator at 4 ◦C until analysis. The soil total carbon
and nitrogen contents were measured using an NC analyzer (NC-800,
Sumitomo Chemical Co., Japan). The inorganic NH4and NO3in the
extractant of 10 g fresh soil shaken with 100 mL 2M KCl for 1 h were
determined using a flow-injection analyzer (Aquatec 5400, Tecator
Co., Sweden). Soil water content was calculated by the weight differ-
ence before and after oven drying at 105 ◦C for 24 h. We determined
the content of wax, cool-water-soluble polysaccharides, hot-water-
soluble polysaccharides, hemicellulose, cellulose, and lignin in the
soils of ten sites (HG3, AP, TZ, OD1, OD2, IB, ST, KH, HS and OK).
The wax was extracted using a Soxhlet-extraction system with 1:1
benzene-ethanol solution for 24 h and weighed after the solvent was
evaporated. After the Soxhlet-extraction, cool-water-soluble polysac-
charides, hot-water-soluble polysaccharides, hemicellulose and cel-
lulose were obtained by sequential extraction using cool water, hot
water, 2% HCl solution, and 72% H2SO4solution, respectively, and
lignin was obtained in the residue [29]. The contents in each fraction,
except lignin, were expressed as the sum of pentose and hexose [20].
The pentose content was determined by orcinol method [19], and the
hexose content was determined by anthrone method [4]. Once all the
extraction were complete, carbon and nitrogen contents of the residue
were measured using an NC analyzer and the lignin content was cal-
culated using this equation: lignin content =carbon content ×1.724 –
nitrogen content ×6.25. The microbial biomass carbon was measured
CO2flux from soil surface in Japan 541
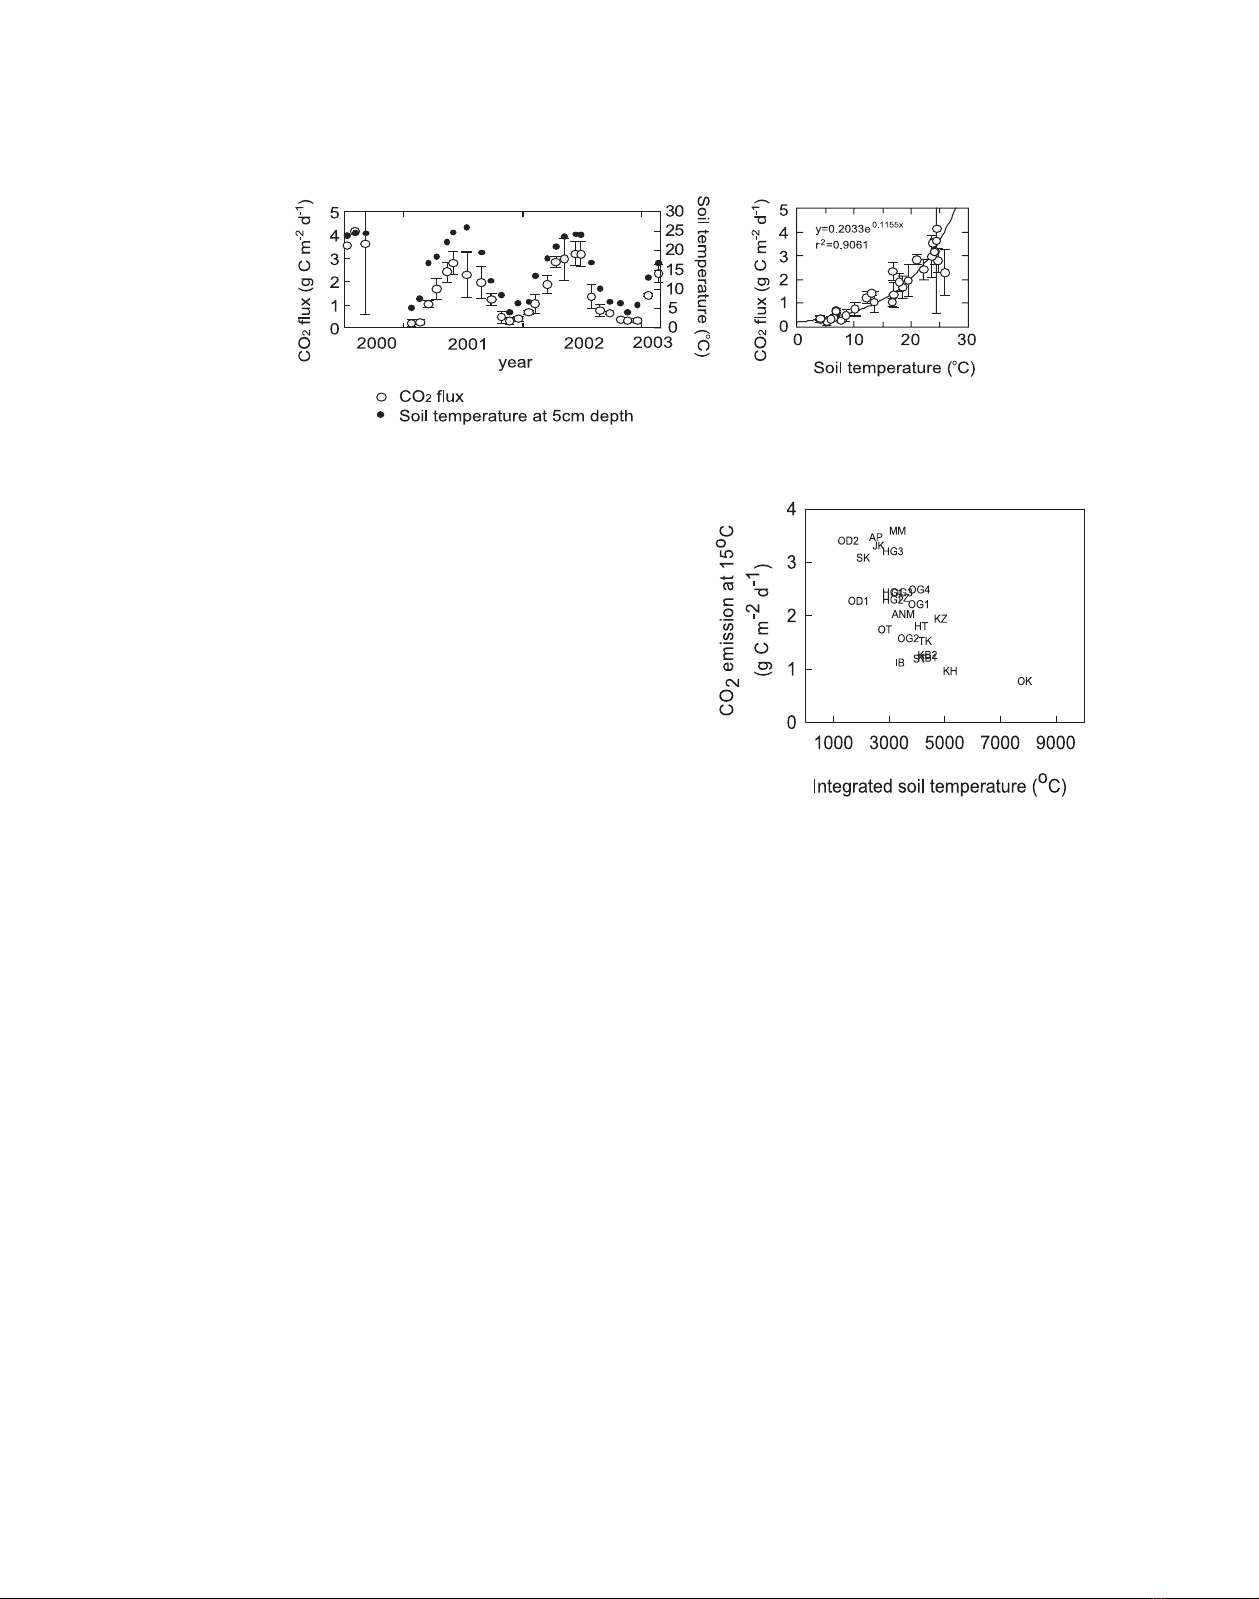
Figure 2. Example of seasonal fluctuation of CO2flux (left) and the correlation between CO2flux and soil temperature (right) at KH.
by chloroform fumigation extraction method [34] using a TOC ana-
lyzer (TOC-5000, Shimazu Co., Japan). Carboxymethylcellulase ac-
tivity (CMCase) was determined by the difference in the reducing
sugar contents in the sample and in a control solution [21]. The reduc-
ing sugar contents were determined by Somogyi-Nelson method [28].
The activity of phosphomonoesterase was determined by colorimetric
method [30] with a minor modification [13]. The particle size distri-
bution was determined by pipette sampling method [6].
2.4. Soil core incubation
Intact soil cores with a volume of 100 mL (5 cm in diameter,
5.1 cm in height) were collected from the soil depths correspond-
ing to the soil sampling depth at each plot. Triplicate samples were
collected for each depth. We incubated soil cores to evaluate the po-
tential of CO2emission of the soils at the ten sites (HG3, AP, TZ,
KB2, OD1, OD2, IB, ST, KH and OK) by the following method [14].
An intact soil core was placed in a 500-mL incubation jar at 25 ◦C
and stopped with a butyl rubber stopper. The gas in the headspace
was sampled 4 h and 24 h after closure. The CO2concentration in the
headspace was preliminarily found to show a linear increase during
this incubation period. The emission rate of CO2from the soil core
was calculated using the slope of a line showing the rate of increase
in CO2concentration with time. All data are the means of triplicate
samples. We defined the emission potential of CO2derived from soil
organic carbon decomposition (hereafter SOC-CO2) as the sum of the
emission rates at 0–5 cm, 5–10 cm and 10–15 cm depths obtained by
incubation method.
3. RESULTS
3.1. CO2flux from the forest floor
The CO2flux from the forest floor fluctuated seasonally,
showing maximum in summer and minimum in winter. The
CO2fluxes during the observation period ranged from 0.08 to
5.89 g C m−2d−1(Tab. III). The fluxes correlated exponen-
tially with the soil temperature at 5 cm depth at most sites (an
example is shown in Fig. 2), and the flux can be expressed by
the following equation:
Flux (gC m−2d−1)=AeBT (1)
where Tis the soil temperature at 5 cm depth (◦C), and Aand
Bare constants for each site. Ais the CO2flux at 0 ◦CandB
Figure 3. Relationship between integrated soil temperature and CO2
flux at 15 ◦C calculated using the parameter in Table III.
is the parameter of temperature dependency (if Bis larger than
0.069, then Q10 is greater than 2). To compare the CO2flux
under the same temperature at all sites, the CO2flux at 15 ◦C
calculated using the (Eq. (1)) was used. The fluxes correlated
negatively with the integrated soil temperature (Fig. 3).
Annual CO2flux from the forest floor at each site was es-
timated by the sum of hourly CO2flux calculated by equa-
tion (1), using the data logger records of hourly soil temper-
ature at 5 cm depth on the site (Tab. III). Because the soil
temperature and CO2flux at KZ did not show a close rela-
tionship, we did not calculate the annual CO2efflux at KZ.
The estimated CO2flux from the forest floor ranged from 3.1
to 10.6 Mg C ha−1y−1(Tab. III). A correlation between inte-
grated soil temperature and CO2efflux was not found (Fig. 4).
The average of annual CO2efflux at the northern sites (SK,
JK, MM, HG, AP, ANM, TZ and OG; the mean and standard
deviation were 6.82 ±1.18) was significantly greater than at
southern sites (HT, KB, TK, OT, OD, ST, IB, HS, KH and OK;
the mean and standard deviation were 4.91 ±2.06) (p=0.009
in student’s t-test). To compare our data with global-scale ob-
servations, the estimated CO2flux was calculated by the fol-
lowing equation [25]:
EVOL =−0.242 ×(LAT) +17.215 (2)
where EVOL (Mg C ha−1y−1)isCO
2flux from the forest floor
and LAT (◦) is the north latitude of the site. The flux rates


