
RESEARC H Open Access
Fuzzy obesity index (MAFOI) for obesity
evaluation and bariatric surgery indication
Susana Abe Miyahira
1,2,3*
, João Luiz Moreira Coutinho de Azevedo
1
and Ernesto Araújo
1,2,3
Abstract
Background: The Miyahira-Araujo Fuzzy Obesity Index (MAFOI) for being used as an alternative in bariatric surgery
indication (BSI) is validated in this paper. The search for a more accurate method to evaluate obesity and to
indicate a better treatment is important in the world health context. Body mass index (BMI) is considered the main
criteria for obesity treatment and BSI. Nevertheless, the fat excess related to the percentage of Body Fat (%BF) is
actually the principal harmful factor in obesity disease that is usually neglected. The aim of this research is to
validate a previous fuzzy mechanism by associating BMI with %BF that yields the Miyahira-Araujo Fuzzy Obesity
Index (MAFOI) for obesity evaluation, classification, analysis, treatment, as well for better indication of surgical
treatment.
Methods: Seventy-two patients were evaluated for both BMI and %BF. The BMI and %BF classes are aggregated
yielding a new index (MAFOI). The input linguistic variables are the BMI and %BF, and the output linguistic variable
is employed an obesity classification with entirely new types of obesity in the fuzzy context, being used for BSI, as
well.
Results: There is gradual and smooth obesity classification and BSI criteria when using the Miyahira-Araujo Fuzzy
Obesity Index (MAFOI), mainly if compared to BMI or %BF alone for dealing with obesity assessment, analysis, and
treatment.
Conclusion: The resulting fuzzy decision support system (MAFOI) becomes a feasible alternative for obesity
classification and bariatric surgery indication.
Background
The clinical conditions that are characterized as over-
weight (pre-obesity) and obesity are currently a universal
epidemic of critical proportions. Efforts have been made
to minimize this public health problem, but the preva-
lence of obesity is still growing in both developed and
developing countries [1-6].
An excess of fat tissue (obesity) has been shown to be
harmful for multiple organs and systems through trom-
bogenic, atherogenic, oncogenic, hemodynamic, and
neuro-humoral mechanisms [7-11]. Recently, obesity
and related diseases (comorbidities), including diabetes
mellitus, hypertension, coronary artery disease, cancer,
sleep apnea, and osteoartrosis, have replaced tobacco
use as a leading cause of death, where obesity contri-
butes directly to the severity of the comorbities [12-15].
Therefore, a great clinical interest exists for evaluating
overweight and obese patients to determine the risks
inherent with these conditions, to prescribe and control
conservative treatments, and to indicate when surgical
treatment is needed. In the last 30 years, only the over-
weight and obesity rating system, which uses the body
mass index (BMI), has been internationally recognized
[16] (Table 1).
BMI is a mechanism to measure weight excess exten-
sively used in a myriad of epidemiologic studies, and is
incorporated with clinical practice because of its simpli-
city [17]. However, it does not properly evaluate the
body fat (BF) proportion because it fails to distinguish
lean muscle mass from body fat [18]. The BF measure-
ment has more value than global body mass measure-
ments since the harmful factor in obesity is the
accumulation of fat in the body, and lean muscle mass
* Correspondence: susana_miyahira@uol.com.br
1
Universidade Federal de São Paulo (UNIFESP), Brazil. R. Botucatu 740 - São
Paulo, SP, CEP 04023-900, Brazil
Full list of author information is available at the end of the article
Miyahira et al.Journal of Translational Medicine 2011, 9:134
http://www.translational-medicine.com/content/9/1/134
© 2011 Miyahira et al; licensee BioMed Central Ltd. This is an Open Access article distributed under the terms of the Creative
Commons Attribution License (http://creativecommons.org/licenses/by/2.0), which permits unrestricted use, distribution, and
reproduction in any medium, provided the original work is properly cited.

does not burden the individual health [19,20]. Addition-
ally, the BMI itself is revealed as an imprecise and inac-
curate method to measure the percentage of Body Fat
(%BF), especially when people from different categories
are took into account, which happens in populations of
different ages and with different body types [21,22].
Despite of these limitations, the BMI is often used in
the therapeutic approach to obesity classification, analy-
sis, and treatment as well as to determine bariatric sur-
gery (Table 2) [1].
Taking into account that the BF percentage is the most
reliable indicator of obesity and that the BMI is used to
prescribe surgery, it would also be convenient to simulta-
neously consider BF when approaching the patient to
recommend bariatric surgery (Table 3) [23-25]. In this
sense, the BMI should be included in conjunction with
the %BF when evaluating the condition of the patient and
determining an obesity treatment algorithm [18,26].
Therefore, the search for a more accurate model that
evaluates overweight and obese patients with apparent
body mass excess led to the conception that indicates when
surgery is appropriate for these patients. Previously pre-
sented, the Miyahira-Araujo Fuzzy Obesity Index (MAFOI)
evaluates the obesity by correlating BMI and the BF in the
context of fuzzy set theory and fuzzy logic. MAFOI must
also have the ability to accurately recommend which
patients should be referred for bariatric surgery.
Objectives
General: To determine a more accurate parameter for
the evaluation of obesity and in bariatric surgical
indication.
Specifics:
1) To evaluate the use of Miyahira-Araujo Fuzzy Obe-
sity Index (MAFOI) in a random sample of the obese
population.
2) To validate Miyahira-Araujo Fuzzy Obesity Index
(MAFOI) in indicating bariatric surgery.
Methods
This prospective study was carried out at the Hospital
Municipal Dr. José de Carvalho Florence (HMJCF), in
the city of São José dos Campos, São Paulo state, Brazil
from December of 2008 to August of 2009. Such a
research is approved by the Ethic and Research Com-
mission (CEP) of the Universidade de Taubaté (UNI-
TAU) (Exhibit I) and the Universidade Federal de São
Paulo (UNIFESP) (Exhibit II). All participants in the
study signed an informed consent form that was in
accordance with Decree no. 196/96 of the National
Health Council (CNS)/Health Ministry (MS) and its
complements (Decrees 240/97, 251/97, 292/99, 303/00,
and 304/00 of the CNS/MS) (Exhibit III). This research
was sponsored by the funding agency Fundação de
Amparo à Pesquisa do Estado de São Paulo (FAPESP),
process # 2009/07956-7.
Inclusion criteria were the following: patients from
emergency and nursing rooms in the HMJCF, of both
gender, and aged 18 years and older, and patients fasting
at least for 6 hours of solid food and 4 hours of liquids.
Exclusion criteria were the following: patients who
refused to take part in the study, pregnant women, and
patients with kidney failure, hydroelectrical alterations,
inadequate hydration, fever (T>37.8°C), ascites, hepatic
cirrhosis, a coronary by-pass, or an amputation of the
inferior or superior members.
The weight, height, and BF of the patients were mea-
sured during the same day and at subsequent time
points.
BMI Calculation
To calculate the BMI, a stadiometer, which was graded
at every 0.5 cm, and a digital scale, with 0.1-kg sensitiv-
ity, were used.
BF Calculation
To obtain BF and fat-free mass (FFM) values, a body
composition analyzer was used, a method that uses
direct multi-frequency bio-impedance (BIA) and the
Table 1 Guidelines for the classification of overweight
and obese adults using BMI
Condition Classification BMI
Overweight OW 25 to 29.9
Obesity class I OI 30 to 34.9
Obesity class II OII 35 to 39.9
Obesity class III (Morbid) OIII ≥40
Clinical guidelines on the identification, evaluation, and treatment of
overweight and obesity in adults. Washington, National Institute of Health,
1998. (Modified).
Table 2 Indication of bariatric surgery according to the
BMI and comorbidities
BMI >35 and <40 Kg/m
2
BMI >40 Kg/m
2
Without comorbidities Without indication With indication
With comorbidities With indication With indication
Table 3 Obesity classified by BF
BF (%) Women Men
ADEQUATE <25% <15%
LIGHT 25 - 30% 15 - 20%
MODERATE 30 - 35% 20 - 25%
HIGH 35 - 40% 25 - 30%
MORBID >40% >30%
Guideline for the classification of obesity in adults. National Institute of
Diabetes and Digestive and Kidney Diseases. U.S. Department of Health and
Human Services. (Modified).
Miyahira et al.Journal of Translational Medicine 2011, 9:134
http://www.translational-medicine.com/content/9/1/134
Page 2 of 10
Segmental-model InBody230 (Biospace Co., Ltd. Seoul
135-784 KOREA) Tetra-polar System with 8-points. The
BF values and FFM system were obtained through the
BIA from equations that were incorporated in the
equipment, as described by Bedogni [35].
Protocol for the evaluation
1) The patients were instructed to refrain from drinking
alcohol and to not perform heavy physical activity dur-
ing the day prior to the exam.
2) Fasting at least for 6 h of solid food and 4 h of
liquids prior to the exam.
3)Thepatientswereinstructedtousetherestroom
before the test.
4) The patients wore light clothes or a hospital gown.
5) The patients did not wear watches or jewelry in the
vicinity of the electrodes.
6) The patients remained standing for 5 minutes
before the exam performance.
7) The room temperature at the exam was maintained
from 20°C to 25°C.
Fuzzy Set Theory and Fuzzy Logic for Fuzzy BMI, Fuzzy %BF
and Fuzzy Obesity Output Classes and Values in Obesity
Assessment
Initially, the BMI was modified by the treatment of the
crisp classes, as adopted by the World Health Organiza-
tion (WHO), into fuzzy sets, i.e., fuzzy classes (Figure 1
and 2). While the classical set theory is based on the
excluded middle principle where an element belongs, or
not, to a set (crisp set/class), the fuzzy set theory allows
a relation of gradual membership of an element to a
determined set [27,28]. Such an approach was, thus,
extended to the %BF classes (Figure 3). The fuzzy BMI
and fuzzy %BF classes were aggregated by employing
logical connectives and mapped into fuzzy obesity
output classes and values resulting in a new index
named the Miyahira-Araujo Fuzzy Obesity Index
(MAFOI) (Figure 4). MAFOI was, then, used to classify
individuals in relation to their obesity condition and
establish a criterion that provides a decision-making sys-
tem that can recommend bariatric surgery, as well.
These described steps embrace the mapping process
that includes the following: (i) the knowledge basis, (ii)
the fuzzification that translates the crisp value (classical
number) of the input variable into a fuzzy value, (iii) the
cylindrical extension, the aggregation, the conjunction,
and the projection, and (iv)thedefuzzification that
translates the output linguistic variable in a crisp value.
To build the input variable for the fuzzy BMI, the
WHO classification (Table 1) was used. The fuzzy sets
for the fuzzy BMI are assigned the following linguistic
terms: overweight (OW), obesity class I (OI), obesity
class II (OII), and obesity class III (OIII).
To build the input variable for the fuzzy %BF, the
NIDDK classification of overweight and obesity was
used (Table 3). The fuzzy sets for the fuzzy %BF are
assigned the following linguistic terms: adequate (AD),
light obesity (LI), moderate obesity (MDE), high obesity
(HI), and morbid obesity (MOR).
The fuzzy obesity or surgical-treatment-indication eva-
luation constituted the output linguistic variable (conse-
quent of the rule). The fuzzy sets for the fuzzy obesity
or surgical-treatment indication are assigned the follow-
ing linguistic terms: thin (TH), muscular hypertrophy
(MUH), excess of weight (EW), sutomori (SUT), fuzzy
obesity (FZOB), and morbid obesity (MOR). The rules
were restricted to those classes considered relevant, i.e.
restricted to only those than can happen in ordinary
practice (Table 4).
The base of rules is represented as a fuzzy matrix in
table 4.
Fuzzy BMI, % Fuzzy BF, Fuzzy Obesity Output Classes, and
MAFOI performance to obesity diagnosis and to surgical
treatment indication
The WHO reference standard is employed to evaluate
the obesity diagnosis performance, which is evaluated by
using the BMI (Table 1). Values that are already
described in the literature were used to evaluate the obe-
sity-diagnosis performance, which was evaluated using
the %BF cut-off value [25]. To evaluate the MAFOI, a
value defined by the defuzzification of the output variable
is used by using the center of area method.
Statistical analysis
The continuous variables are presented as mean and
standard deviation (SD) and numbers and percentages
as categorical variables. The Pearson coefficients of cor-
relation and the respective intervals of confidence (IC)
(95%) are estimated to compare BMI, BF and MAFOI
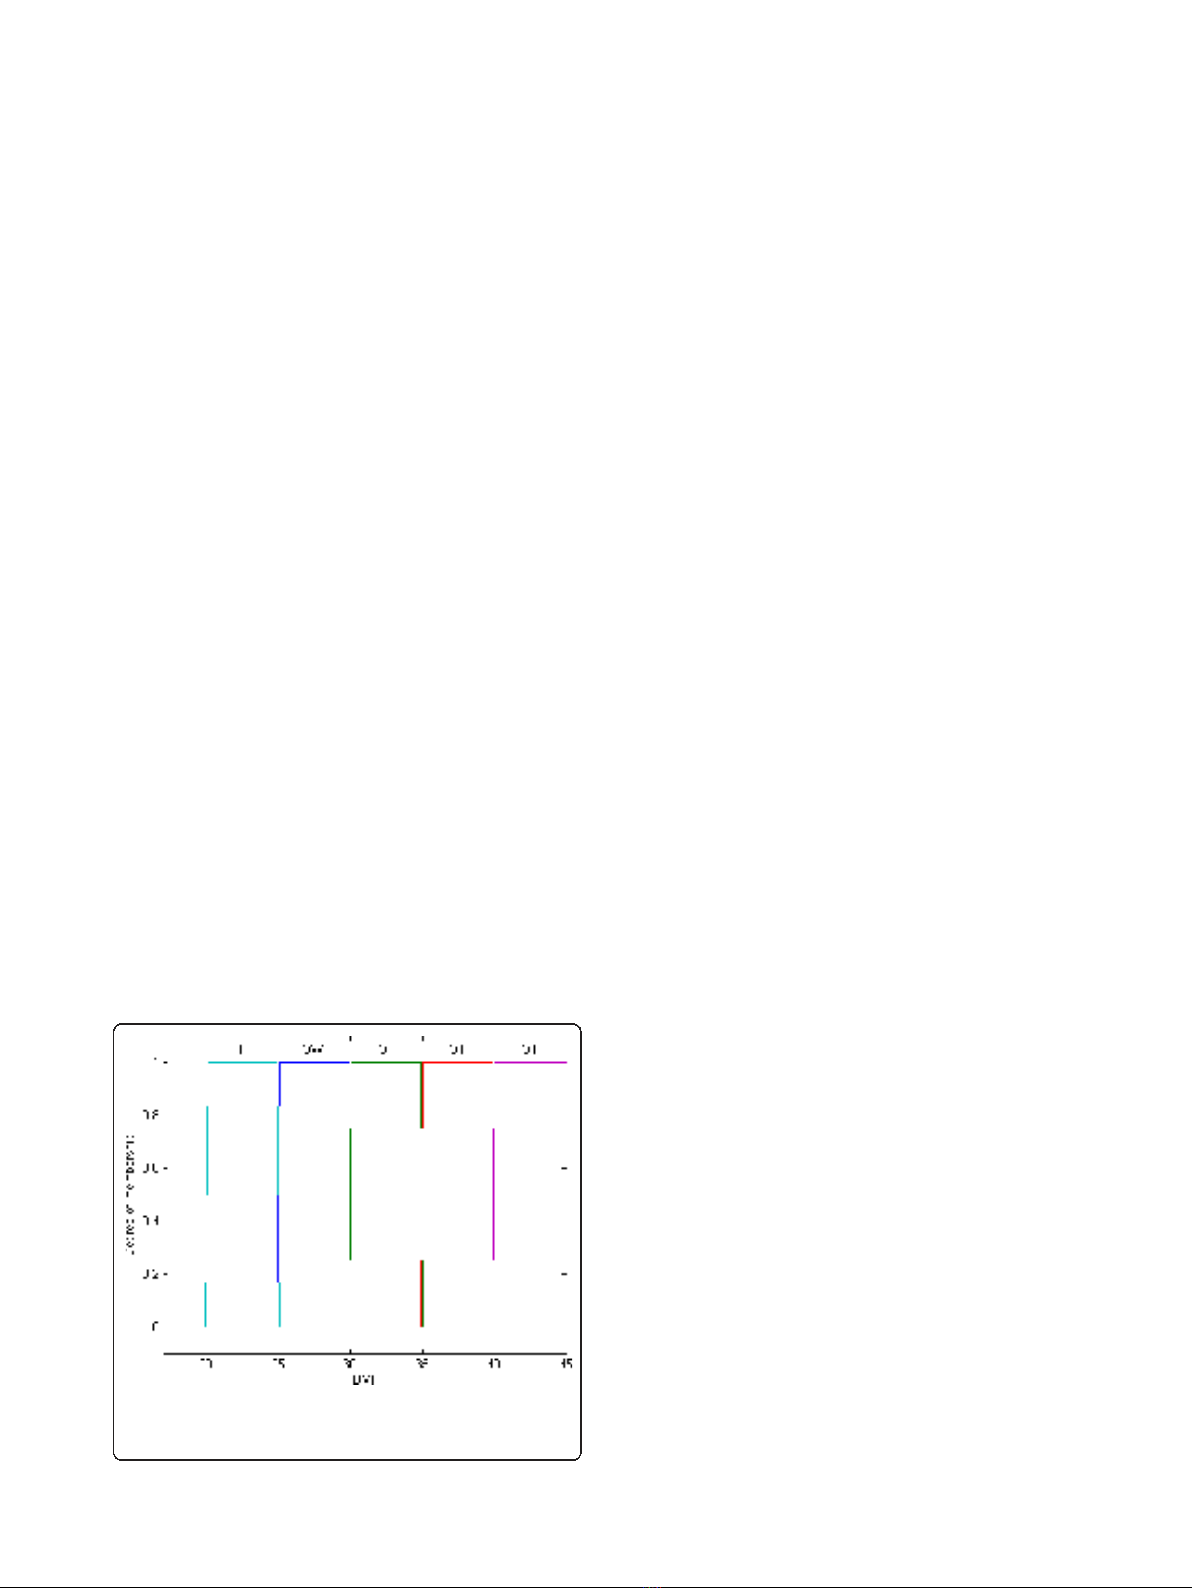
Figure 1 Classical BMI. BMI classical set, with the linguistic values:
slim (S), overweight (OW), obesity class I (OI), obesity class II (OII),
obesity class III (OIII).
Miyahira et al.Journal of Translational Medicine 2011, 9:134
http://www.translational-medicine.com/content/9/1/134
Page 3 of 10
by genre. The McNemar test [29] is used to compare
the percentage of the individuals considered obese by
the BMI versus BF, BMI versus MAFOI and BF and BF
versus MAFOI.
Results
In the current study, 81 patients were evaluated and 72
out of the 81 were evaluated by analyzing the BMI and
%BF. Among the excluded patients, 7 were not fasting, a
patient had consumed alcohol within 24 h prior to the
test, and a patient had a fever (T = 38.2°C) at the time
of evaluation. Within the 72 patients, 42 were female
and 30 were male. The mean age standard deviation
(SD) was 39.5 ± 11.2 years old for women and 43.5 ±
15.8 years old for men. The mean weight SD was 70.0 ±
14.5 kg for women and 79.6 ± 25.3 kg for men. The
mean BMI SD was 27.1 ± 5.8 kg/m
2
for women and 27
±7.4kg/m
2
for men. The mean %BF SD was 38.7 ±
6.7% for women and 26.3 ± 7.9% for men. The demo-
graphic data are described in Table 5.
The maximum and minimum BMI, %BF, and MAFOI
values are presented in Table 6. Mean and SD values
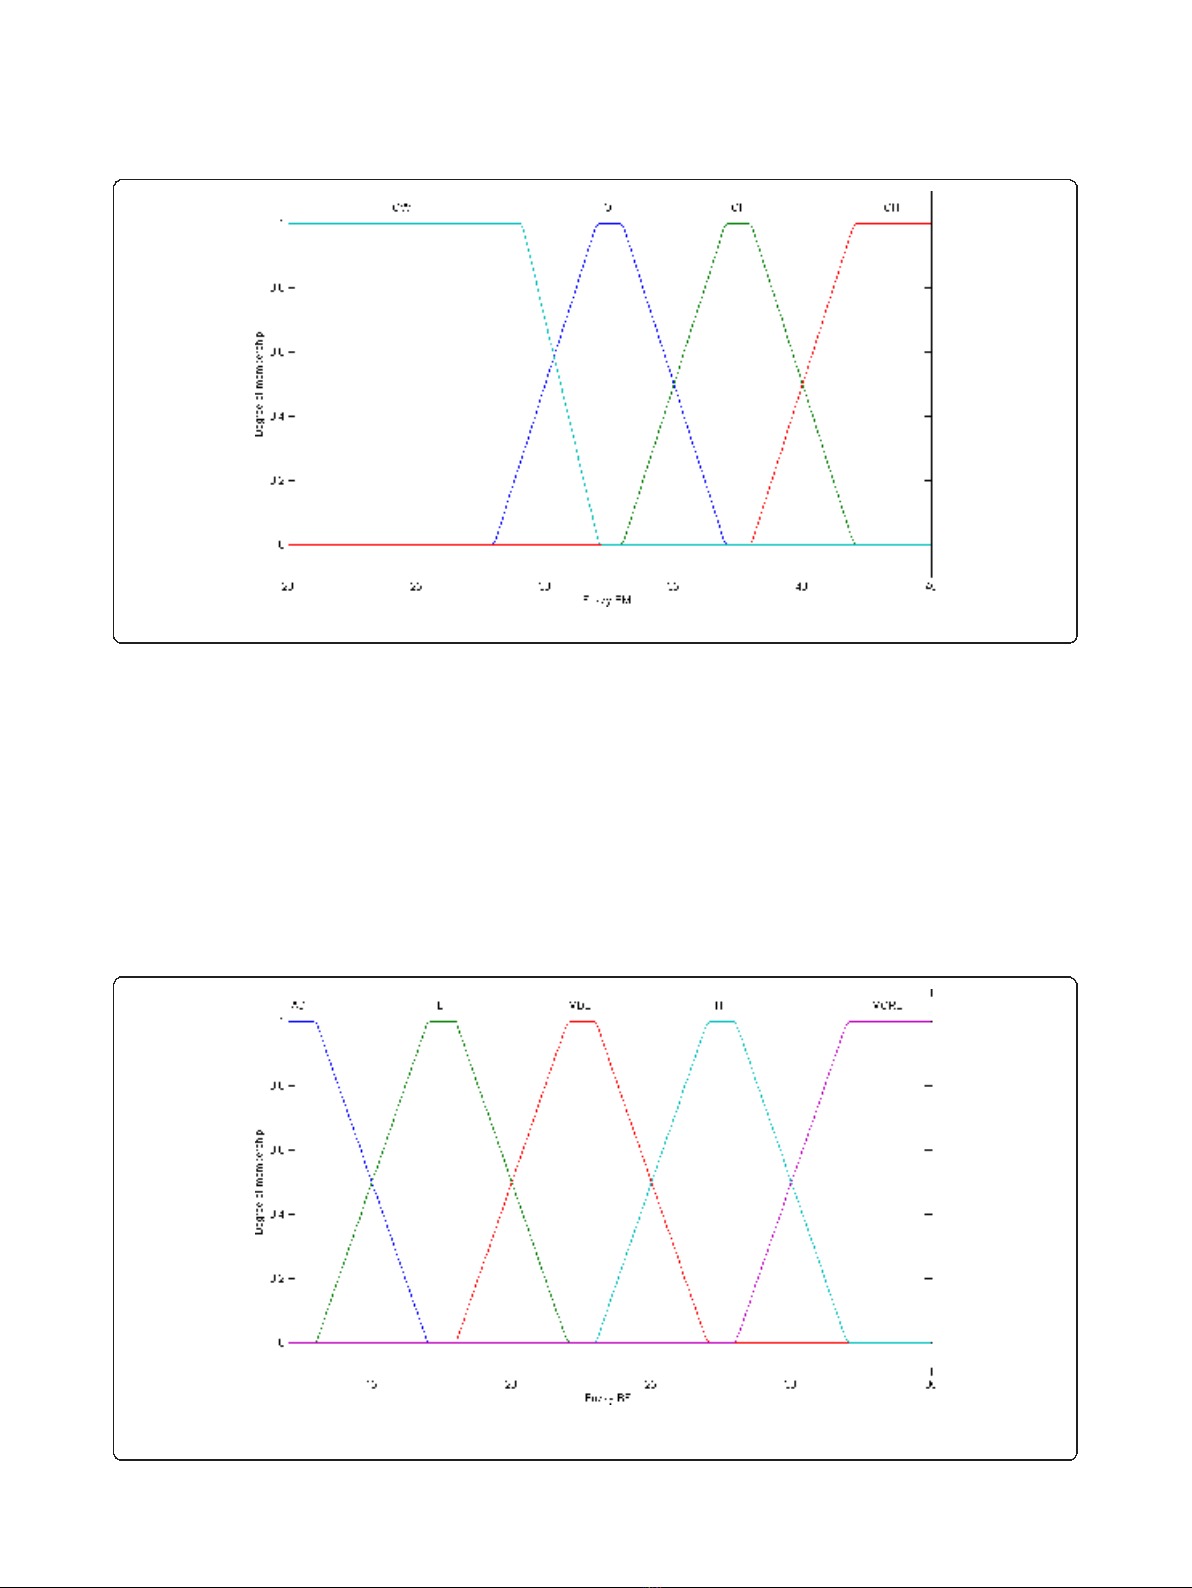
Figure 2 Fuzzy BMI. BMI fuzzy set, with the linguistic terms: overweight (OW), obesity class I (OI), obesity class II (OII), obesity class III (OIII).
Figure 3 Fuzzy BF. BF fuzzy set, with the linguistic terms: adequate (AD), light obesity (LI), moderate obesity (MDE), high obesity (HI), morbid
obesity (MORB).
Miyahira et al.Journal of Translational Medicine 2011, 9:134
http://www.translational-medicine.com/content/9/1/134
Page 4 of 10
are given for BMI and %BF. Table 7 displays the Pear-
son linear correlation coefficients between BMI (Kg/m
2
)
and the remaining variables: BF, FFM, and MAFOI for
both genders.
The low bound value of BMI obesity class I classifica-
tion (OI) = 30 and the low bound value of %BF high
obesity classification (HI) = 35 (women = 35; men = 25
+10), which are defined by the WHO/NIDDK [16,25]
were used as input values of the fuzzy model. The fuzzy
inference was performed. The outcome was the cut-off
value of index MAFOI/BSI (MAFOI) = 68.
The percentage of individuals that were considered
obese by the BF criteria was statistically lower than by
the BMI criteria (Table 8).
The percentage of obese individuals determined by the
MAFOI criteria was statistically higher than by the BMI
criteria (Table 9). The percentage of obese individuals
determined by the BF criteria was statistically higher
than the MAFOI criteria (Table 10).
The correlation between the BMI and %BF for women
was stronger than for men. When comparing BMI to
FFM, the correlation was better for men. The groups
show a strong correlation for all of the variables in both
genders. Regarding the BMI and MAFOI, the correlation
was strong for both women and men. The correlation
between BF and MAFOI was the best one for both
genders.
The percentages of individuals that were considered
obese by the BMI, %BF, and MAFOI criteria are pre-
sented in Table 11. The percentage of individuals con-
sidered obese by the %BF criteria (63.9%) was
statistically higher than the BMI criteria (23.9%) (p <
0.001). The percentage of individuals considered obese
by the MAFOI criteria (41.7%) was statistically higher
than the BMI criteria (23.6%) (p < 0.001). The percen-
tage of individuals considered obese by the %BF criteria
(63.9%) was statistically higher than the MAFOI criteria
(41.7%) (p < 0.001) [30].
Discussion
Use of BMI to classify obesity
Despite its limitations, the BMI is currently considered
the most useful measurement of the obesity level of the
population. Thus, the BMI can be used to estimate the
prevalence of obesity in the population and the risks
associated with this condition. However, it does not elu-
cidatethewidevariationinthenatureofobesity
between different individuals and diverse populations.
Among sedentary and overfed individuals, the increase
of body mass is generally due to both body fat and mus-
cle mass. Nevertheless, among men, the increase of body
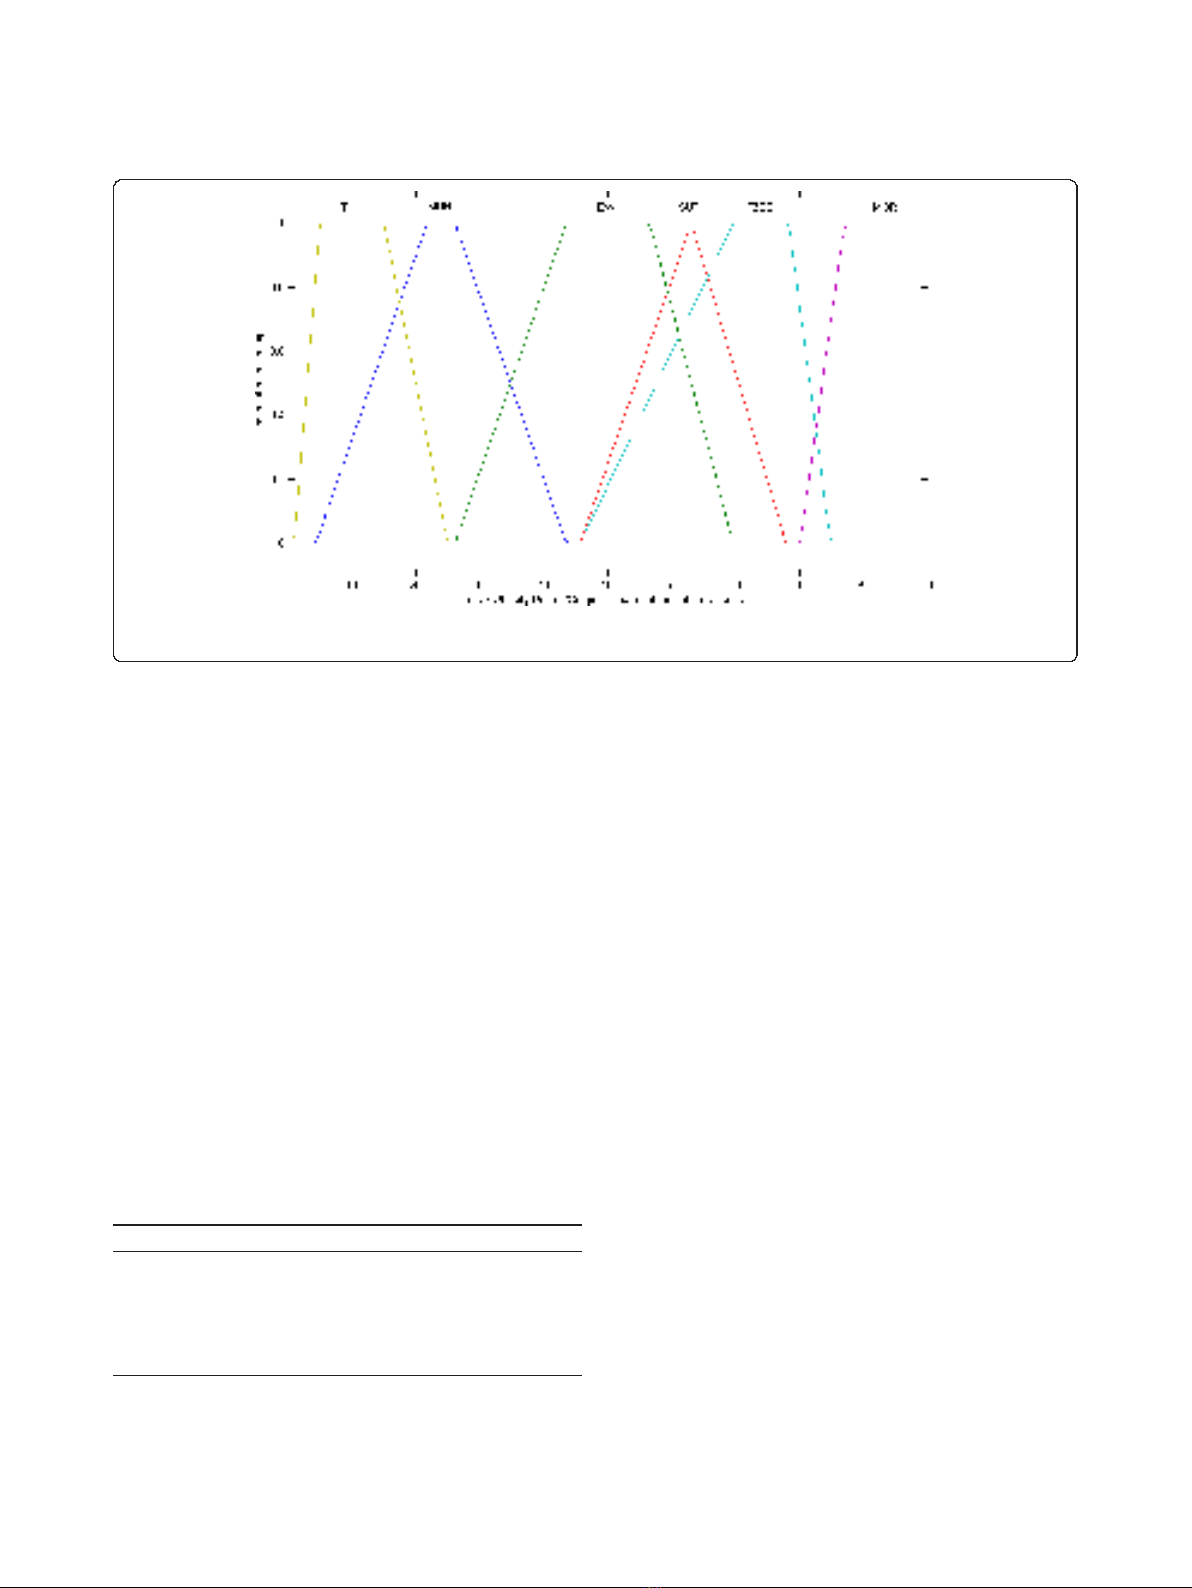
Figure 4 Fuzzy Obesity-Degree/Surgical-Treatment-Indication Classes. Obesity-Degree/Surgical-Treatment-Indication classes set, with the
linguistic terms: thin (TH), muscular hypertrophy (MUH), excess of weight (EW), sutomori (SUT), fuzzy obesity (FZOB), and morbid obesity (MOR).
Table 4 Bases of Fuzzy Rules
BMI/BF TH OW OI OII OIII
AD TH MUH MUH MUH X
LI TH HM HM HM X
MDE EW EW SUT SUT MOR
HI EW FZOB FZOB FZOB MOR
MOR X FZOB FZOB FZOB MOR
BMI (body mass index), overweight (OW), obesity class I (OI), obesity class II
(OII), and obesity class III (OIII). BF (body fat percentage), adequate (AD), light
obesity (LI), moderate obesity (MDE), high obesity (HI), thin (TH), muscular
hypertrophy (MUH), excess of weight (EW), sutomori (SUT), fuzzy obesity
(FZOB), and morbid obesity (MOR).
Miyahira et al.Journal of Translational Medicine 2011, 9:134
http://www.translational-medicine.com/content/9/1/134
Page 5 of 10


%20--%3e%3cdefs%3e%3cstyle%3e%20.st0%20{%20fill:%20%23fff;%20}%20.st1%20{%20fill:%20%237800fa;%20}%20%3c/style%3e%3c/defs%3e%3cpath%20class='st1'%20d='M117.78,12.18H43.11c2.9,3.47,4.65,7.94,4.65,12.82,0,5.6-2.3,10.66-6.01,14.29h76.02l7.22-13.56-7.22-13.56Z'/%3e%3cg%3e%3cpath%20class='st0'%20d='M53.58,26.17h-.59v-1.46h.59v-4.96h2.83c1.78,0,2.67.94,2.67,2.82v5.76c0,1.87-.89,2.81-2.67,2.81h-2.83v-4.96ZM55.36,21.37v3.34h1.1v1.46h-1.1v3.34h1.01c.61,0,.91-.37.91-1.1v-5.93c0-.74-.3-1.1-.91-1.1h-1.01Z'/%3e%3cpath%20class='st0'%20d='M65.99,31.14h-1.8l-.31-2.07h-2.19l-.31,2.07h-1.64l1.82-11.39h2.62l1.82,11.39ZM65.28,18.04c-.25.46-.51.77-.75.94-.21.15-.47.22-.79.22-.26,0-.57-.07-.92-.22l-.38-.15c-.14-.05-.26-.07-.37-.07-.3,0-.53.18-.71.54l-.91-.68c.25-.46.51-.77.75-.94.21-.14.48-.21.79-.21.26,0,.57.07.92.21l.38.15c.14.05.26.07.37.07.3,0,.53-.18.71-.54l.91.68ZM61.91,27.52h1.73l-.87-5.76-.87,5.76Z'/%3e%3cpath%20class='st0'%20d='M74.53,26.89v1.52c0,1.91-.89,2.86-2.67,2.86s-2.67-.95-2.67-2.86v-5.93c0-1.91.89-2.86,2.67-2.86s2.67.95,2.67,2.86v1.11h-1.69v-1.22c0-.75-.31-1.12-.93-1.12s-.93.37-.93,1.12v6.15c0,.74.31,1.11.93,1.11s.93-.37.93-1.11v-1.63h1.69Z'/%3e%3cpath%20class='st0'%20d='M81.4,31.14h-1.8l-.31-2.07h-2.19l-.31,2.07h-1.64l1.82-11.39h2.62l1.82,11.39ZM75.9,19.2l1.52-1.91h1.71l1.51,1.91h-1.61l-.76-.95-.75.95h-1.61ZM77.32,27.52h1.73l-.87-5.76-.87,5.76ZM83.1,15.99l-1.76,1.91h-1.26l1.17-1.91h1.86Z'/%3e%3cpath%20class='st0'%20d='M84.86,19.75c1.78,0,2.67.94,2.67,2.82v1.48c0,1.87-.89,2.81-2.67,2.81h-.85v4.28h-1.79v-11.39h2.64ZM84.01,21.37v3.86h.85c.58,0,.87-.36.87-1.08v-1.71c0-.71-.29-1.07-.87-1.07h-.85Z'/%3e%3cpath%20class='st0'%20d='M93.51,19.75c1.78,0,2.67.94,2.67,2.82v1.48c0,1.87-.89,2.81-2.67,2.81h-.85v4.28h-1.79v-11.39h2.64ZM92.66,21.37v3.86h.85c.58,0,.87-.36.87-1.08v-1.71c0-.71-.29-1.07-.87-1.07h-.85Z'/%3e%3cpath%20class='st0'%20d='M98.8,31.14h-1.79v-11.39h1.79v4.88h2.03v-4.88h1.83v11.39h-1.83v-4.88h-2.03v4.88Z'/%3e%3cpath%20class='st0'%20d='M105.36,24.55h2.46v1.62h-2.46v3.34h3.09v1.63h-4.88v-11.39h4.88v1.63h-3.09v3.18ZM108.17,17.29l-1.76,1.91h-1.26l1.17-1.91h1.86Z'/%3e%3cpath%20class='st0'%20d='M112.2,19.75c1.78,0,2.67.94,2.67,2.82v1.48c0,1.87-.89,2.81-2.67,2.81h-.85v4.28h-1.79v-11.39h2.64ZM111.35,21.37v3.86h.85c.58,0,.87-.36.87-1.08v-1.71c0-.71-.29-1.07-.87-1.07h-.85Z'/%3e%3c/g%3e%3ccircle%20class='st1'%20cx='25'%20cy='25'%20r='20'/%3e%3cpath%20class='st0'%20d='M32.78,19.27c2.92,0,4.43,2.55,5.28,5.33l.71,2.17c.14.38-.33.75-.71.75h-5.61c.19-.33.24-.71.09-1.08l-.75-2.45c-.43-1.32-.99-2.64-1.79-3.77.75-.57,1.65-.94,2.78-.94h0ZM25,18.38c3.25,0,4.9,2.78,5.89,5.89l.76,2.45c.14.42-.33.8-.8.8h-11.69c-.42,0-.94-.38-.8-.8l.75-2.45c.99-3.11,2.64-5.89,5.89-5.89h0ZM25,11.35c1.74,0,3.11,1.37,3.11,3.11s-1.37,3.11-3.11,3.11-3.11-1.41-3.11-3.11,1.41-3.11,3.11-3.11h0ZM17.27,19.27c1.08,0,1.98.38,2.73.94-.8,1.13-1.37,2.45-1.74,3.77l-.8,2.45c-.14.38-.05.75.09,1.08h-5.56c-.42,0-.9-.38-.75-.75l.71-2.17c.9-2.78,2.41-5.33,5.33-5.33h0ZM17.27,12.91c1.51,0,2.78,1.27,2.78,2.83s-1.27,2.83-2.78,2.83-2.83-1.27-2.83-2.83,1.27-2.83,2.83-2.83h0ZM32.78,12.91c1.56,0,2.78,1.27,2.78,2.83s-1.23,2.83-2.78,2.83-2.83-1.27-2.83-2.83,1.27-2.83,2.83-2.83h0ZM27.07,28.56v.09c0,.57-.24,1.08-.61,1.46h0v.05c-.38.33-.9.57-1.46.57s-1.08-.24-1.46-.61h0c-.38-.38-.61-.9-.61-1.46v-.09h1.41v.09c0,.19.05.38.19.47v.05c.09.09.28.19.47.19s.38-.09.47-.19v-.05c.14-.09.24-.28.24-.47t-.05-.09h1.41ZM30.99,28.56v.09c0,1.65-.66,3.16-1.74,4.24-1.08,1.08-2.59,1.79-4.24,1.79s-3.16-.71-4.24-1.79l-.05-.05c-1.04-1.08-1.7-2.55-1.7-4.2v-.09h1.41v.09c0,1.27.47,2.4,1.27,3.25h.05c.85.85,1.98,1.37,3.25,1.37s2.4-.52,3.25-1.37c.85-.8,1.37-1.98,1.37-3.25v-.09h1.37ZM34.99,28.56v.09c0,2.78-1.13,5.28-2.92,7.07-1.79,1.79-4.29,2.92-7.07,2.92s-5.23-1.13-7.07-2.92c-1.79-1.79-2.92-4.29-2.92-7.07v-.09h1.41v.09c0,2.4.94,4.53,2.5,6.08,1.56,1.56,3.72,2.5,6.08,2.5s4.52-.94,6.08-2.5c1.56-1.56,2.5-3.68,2.5-6.08v-.09h1.41Z'/%3e%3c/svg%3e)