
Open Access
Available online http://arthritis-research.com/content/8/1/R28
Page 1 of 14
(page number not for citation purposes)
Vol 8 No 1
Research article
Identification of blood biomarkers of rheumatoid arthritis by
transcript profiling of peripheral blood mononuclear cells from the
rat collagen-induced arthritis model
Jianyong Shou1,2, Christopher M Bull1, Li Li1, Hui-Rong Qian3, Tao Wei1, Shuang Luo1,
Douglas Perkins1, Patricia J Solenberg1, Seng-Lai Tan4, Xin-Yi Cynthia Chen4, Neal W Roehm5,
Jeffrey A Wolos1 and Jude E Onyia1
1Integrative Biology, Lilly Research Laboratories, Indianapolis, Indiana, USA
2Angiogenesis and Tumor Microenvironment Biology, Lilly Research Laboratories, Indianapolis, Indiana, USA
3Statistics, Lilly Research Laboratories, Indianapolis, Indiana, USA
4Cancer Inflammation and Cell Survival, Lilly Research Laboratories, Indianapolis, Indiana, USA
5Platform/CFARS, Lilly Research Laboratories, Indianapolis, Indiana, USA
Corresponding author: Jianyong Shou, shou@lilly.com
Received: 28 Sep 2005 Revisions requested: 25 Nov 2005 Revisions received: 7 Dec 2005 Accepted: 9 Dec 2005 Published: 10 Jan 2006
Arthritis Research & Therapy 2006, 8:R28 (doi:10.1186/ar1883)
This article is online at: http://arthritis-research.com/content/8/1/R28
© 2006 Shou et al.; licensee BioMed Central Ltd.
This is an open access article distributed under the terms of the Creative Commons Attribution License (http://creativecommons.org/licenses/by/2.0),
which permits unrestricted use, distribution, and reproduction in any medium, provided the original work is properly cited.
Abstract
Rheumatoid arthritis (RA) is a chronic debilitating autoimmune
disease that results in joint destruction and subsequent loss of
function. To better understand its pathogenesis and to facilitate
the search for novel RA therapeutics, we profiled the rat model
of collagen-induced arthritis (CIA) to discover and characterize
blood biomarkers for RA. Peripheral blood mononuclear cells
(PBMCs) were purified using a Ficoll gradient at various time
points after type II collagen immunization for RNA preparation.
Total RNA was processed for a microarray analysis using
Affymetrix GeneChip technology. Statistical comparison
analyses identified differentially expressed genes that
distinguished CIA from control rats. Clustering analyses
indicated that gene expression patterns correlated with
laboratory indices of disease progression. A set of 28 probe
sets showed significant differences in expression between
blood from arthritic rats and that from controls at the earliest
time after induction, and the difference persisted for the entire
time course. Gene Ontology comparison of the present study
with previous published murine microarray studies showed
conserved Biological Processes during disease induction
between the local joint and PBMC responses. Genes known to
be involved in autoimmune response and arthritis, such as those
encoding Galectin-3, Versican, and Socs3, were identified and
validated by quantitative TaqMan RT-PCR analysis using
independent blood samples. Finally, immunoblot analysis
confirmed that Galectin-3 was secreted over time in plasma as
well as in supernatant of cultured tissue synoviocytes of the
arthritic rats, which is consistent with disease progression. Our
data indicate that gene expression in PBMCs from the CIA
model can be utilized to identify candidate blood biomarkers for
RA.
Introduction
Rheumatoid arthritis (RA) is a chronic autoimmune disease of
unknown etiology that affects 0.5–1% of the population [1]. It
is a polyarthritis characterized by inflammation, altered
humoral and cellular immune responses, and synovial hyper-
plasia, leading to destruction and subsequent loss of function
of multiple joints [1-4]. Although the exact pathogenesis of RA
is not fully understood, the immune and inflammatory systems
are intimately linked. Studies on affected joints focusing on
cartilage, bone, and synovial tissues have yielded important
insights into the mechanisms of disease initiation and progres-
sion. Initially, T cell recruitment and recognition of autologous
or cross-reacting antigens in the joint produce a variety of
mediators, some of which facilitate the development of autoan-
ANOVA = analysis of variance; CIA = collagen-induced arthritis; CII = type II collagen; DEG = differentially expressed gene; FDR (fdrate) = false
discovery rate; GO = Gene Ontology; IL = interleukin; PBMC = peripheral blood mononuclear cell; RA = rheumatoid arthritis; RT-PCR = reverse
transcriptase polymerase chain reaction; TNF = tumor necrosis factor.

Arthritis Research & Therapy Vol 8 No 1 Shou et al.
Page 2 of 14
(page number not for citation purposes)
tibodies that are detectable in the serum of RA patients [5].
The ensuing inflammatory responses, induced by tumor necro-
sis factor (TNF)-α and other proinflammatory cytokines, lead to
synovial fibroblast hyperplasia, destruction of the extracellular
matrix, and eventual damage to the affected joints [5,6].
Although there have been many studies of cells within the
arthritic joint, the responses of the peripheral blood leukocytes
are not well understood. An examination of the circulating lym-
phocytes may provide an important alternative perspective of
the processes that underlie RA and complement local charac-
terization of affected joints [7].
Circulating leukocytes provide an important source for biomar-
ker discovery for RA. Emerging high content approaches such
as genomics and proteomics have radically changed the ways
in which biomarkers are being studied [8-10]. The genomic
approaches have been used to elucidate the pathogenesis of
inflammatory diseases, including RA, and to identify novel drug
targets for RA treatment [3,11-15]. In contrast to target tissue
biopsy based approaches, which are often limited by
restricted access to target tissues, profiling peripheral blood
cells has emerged as an attractive biomarker discovery strat-
egy [10,16-22]. Another added advantage to analyzing periph-
eral blood cells is the fact that blood is a highly dynamic
environment, communicating with practically every tissue in
the body, and is thus proposed as a 'sentinel tissue' that
reflects disease progression in the body [21,23]. Profiling
peripheral blood cells has indeed been used to elucidate
autoimmune diseases [7,24].
The rat model of collagen-induced arthritis (CIA) has many
similarities to RA [25]. In this model (also demonstrable in
mice and monkeys), immunization with type II collagen (CII) –
the collagen found in joint cartilage – induces T cell activation,
anti-CII autoantibody production, and inflammation and joint
destruction similar to that observed in human RA [25,26].
Although there are clearly differences between RA and CIA,
changes in peripheral blood gene expression during the devel-
opment of CIA may suggest potential novel biomarkers for RA.
This could be of value both in monitoring the effects of drugs
on disease progression and in discovering potential biomark-
ers, particularly for individuals with early RA. The latter is major
problem in RA biomarker identification efforts because human
studies are often limited by the late diagnosis relative to the
early disease onset. Studying CIA with gradual induction of
arthritis could potentially reveal early biomarkers for RA. More-
over, gene expression profiling in animal model holds great
promise for our understanding of human pathogenesis. For
example, profiling gene expression in a rat model of inflamma-
tion using SAGE (serial analysis of gene expression) has pro-
vided novel insights into mast cell activation [27].
In the present study, we profiled gene expression in rat periph-
eral blood mononuclear cells (PBMCs) during the develop-
ment of CIA. We established the method for blood collection,
cell fractionation, RNA isolation, and microarray analysis using
the Affymetrix GeneChip technology (Affymetrix, Santa Clara,
CA, USA). We identified a large number of genes that were
differentially expressed between blood from control and
arthritic animals. The gene expression signature in blood
appeared to correlate with laboratory indices of disease induc-
tion. Using bioinformatics and statistical analyses, we identi-
fied a subset of putative biomarkers, which were subsequently
validated using TaqMan RT-PCR and immunoblot analyses.
Materials and methods
Rat collagen-induced arthritis model, blood collection,
and peripheral blood mononuclear cell isolation
The protocol for the in vivo studies was approved by the Lilly
Institutional Animal Care and Use Committee. Adult (approxi-
mately 8 weeks old) female Lewis rats weighing approximately
150 g were obtained from Charles River (Wilmington, MA,
USA), housed under standard conditions, and given free
access to food and water. Animals were acclimated to the
holding room for at least 7 days before initiation of the studies.
For the induction of CIA, CII (Elastin Products Company,
Owensville, MO, USA) was dissolved in sterilized 0.01 mol/l
acetic acid (Sigma-Aldrich, St. Louis, MO, USA) to a final con-
centration of 2 mg/ml. The mixture was stirred at 4°C overnight
until the CII was completely dissolved. CII (2 mg/ml) and
incomplete Freund's adjuvant were homogenized at a 1:1 ratio
using a PowerGen 125 (Fisher Scientific, Pittsburgh, PA,
USA). Each rat was injected intradermally at multiple sites on
the back with a total of 0.3 ml of the emulsion (day 0). Seven
days later (day 7) this immunization protocol was repeated.
Induction and severity of arthritis was determined by change in
ankle weight, measured using calipers. Based on previous
experience, arthritis (as determined by the first signs of red-
ness or swelling of the ankle joints) is observed approximately
12 days after the first CII immunization. By day 21 the inflam-
matory response in the ankles has reached its peak, and by
day 28 there is significant joint pathology. For these reasons,
samples were collected on day 0 (baseline), and on days 10,
21, and 28. Ten rats were collected at each time point. We
also included non-immunized animals as negative controls on
days 10, 21, and 28. Because of the loss of a few samples due
to sample processing or raw chip data quality assurance, the
actual number of chips that were statistically analyzed were
(respectively) 10, 5, 4, and 5 for control rats on days 0, 10, 21,
and 28; and 9, 2, and 8 for arthritic rats on days 10, 21, and
28.
For gene expression analysis, on days 0, 10, 21, and 28, a vol-
ume of 3–5 ml blood from individual animals at time of sacrifice
was collected by cardiac puncture into heparinized vacutainer
tubes (Becton Dickenson, San Jose, CA, USA). Leukocyte
counts were determined using a Hemovet 950 (Drew Scien-
tific, Oxford, CT, USA). For PBMC isolation, blood was centri-
fuged at 1500 g for 20 minutes to remove the plasma. The cell
pellet was resuspended in Hanks' balanced salt solution
Available online http://arthritis-research.com/content/8/1/R28
Page 3 of 14
(page number not for citation purposes)
(Gibco BRL/Invitrogen, Carlsbad, CA, USA) to the original vol-
ume and the cell suspension was carefully layered over the top
of 5 ml of Lympholyte-Rat (Cedarlane Labs, Hornby, Ontario,
Canada) in a 15 ml Falcon tube. The tubes were centrifuged
for 40 minutes at 1500 g and the white cell layer was collected
using a Pasteur pipette. PBMCs were rinsed twice with cold
Hanks' balanced salt solution and stored in RNAlater (Ambion
Inc., Austin, TX) until RNA isolation.
RNA isolation and microarray experiments
RiboPure-Blood Kit (Ambion Inc., Austin, TX, USA) was used
for isolation of high quality total RNA from PBMCs. After
removing RNAlater by centrifugation, blood cell pellets were
lysed in lysis buffer with sodium acetate solution, in accord-
ance with the manufacturer's instruction. RNA was isolated by
acid-phenol:chloroform extraction and further purified on a col-
umn with glass fiber filter. RNA was then eluted in RNase-free
water. Samples were run on a RNA 6000 Nano Gel System
(Agilent Technologies Inc., Palo Alto, CA, USA) using Agilent
2100 Bioanalyzer (Agilent) for RNA quality determination.
RNA was further purified by using the RNeasy spin column
(QIAGEN Inc., Valencia, CA, USA), and then cDNA was gen-
erated and labeled for Affymetrix GeneChip according to the
standard Affymetrix approach and as previously described
[28,29]. Two micrograms of total RNA was used per labeling
reaction. cDNA and labeled in vitro transcription product were
purified using the GeneChip Sample Clean Module (Affyme-
trix). We obtained an average in vitro transcription product
yield of about 26.8 ± 9.7 µg/2 µg input RNA, which is suffi-
cient for chip hybridization. Biotin labeled RNA was frag-
mented and hybridized to rat genome RAE230A chips. Chip
processing, image capturing, and raw data analyses were per-
formed using the Affymetrix Microarray Suite MAS5. Probe set
signal intensities of each hybridized gene chip were extracted
using MAS5 and were normalized using all probe sets to reach
the overall 2% trimmed mean of 1,500 for each chip. Chip per-
formance of both control and arthritic samples met standard
quality assurance criteria. The chips had an average back-
ground of 61.3 ± 8.2, a Raw Q of 2.5 ± 0.4, and percent
present call of 46.8 ± 3.3%.
Statistical analysis to identify differentially expressed
genes
The signal intensity data were fitted to an analysis of variance
(ANOVA) model to compare the CIA treated samples with
control samples at each time point. For a particular probe set,
let Yijk be the normalized signal of sample k in treatment j at
time I (specifically, i = 1, 2, 3, and 4 for days 0, 10, 21, and 28,
respectively; j = 1 and 2 for control and CII injected rats,
respectively; and k = 1 ... 10 for rats in each treatment group
at each time point). The data were fitted to the following statis-
tical model:
Yijk = µ + βi + τj + β τij + εijk, εijk ~ N(0,σ2)
This ANOVA model uses data from all the samples for each
probe set to estimate accurately the sample variance to reach
robust hypothesis testing. It applies the time effects of sample
collection for both CIA and control animals when identifying
changes in gene expression after CII injection. This model
allows identification of gene expression changes between CIA
and control samples at each matched time points, as well as
gene expression changes over time in the control samples.
The gene expression fold change is the ratio of the average
signals of samples in the comparison (for example, treated/
control); if the fold change is less than 1, then the ratio is
reversed and a '-' added (for example, minus control/treated).
Data from each probe set were fitted to the above model inde-
pendently as is done in other studies [30,31].
To control the false positive rate of testing the expression
change of thousands of genes simultaneously, false discovery
rate (fdrate or FDR) was estimated using an algorithm derived
by Benjamini and Hochberg [32]. FDR estimates the false
positive rate of a 'significant' gene list. Suppose that Pi (i = 1,
2 ... m) are the P values resulting from testing m expression
changes. Sort Pi from the smallest to the largest, and let P(i) be
the ith sorted P value and i its rank. Then, the FDR for each
sorted P value was calculated by timing the P value with m/i,
and monotonizing all of the FDRs from the largest to the small-
est:
fdrate P
fdrate m
iPfdrate
mm
iii
() ()
() () ( )
;
min , ,
=
=
=
+1for i 112 1,…m−
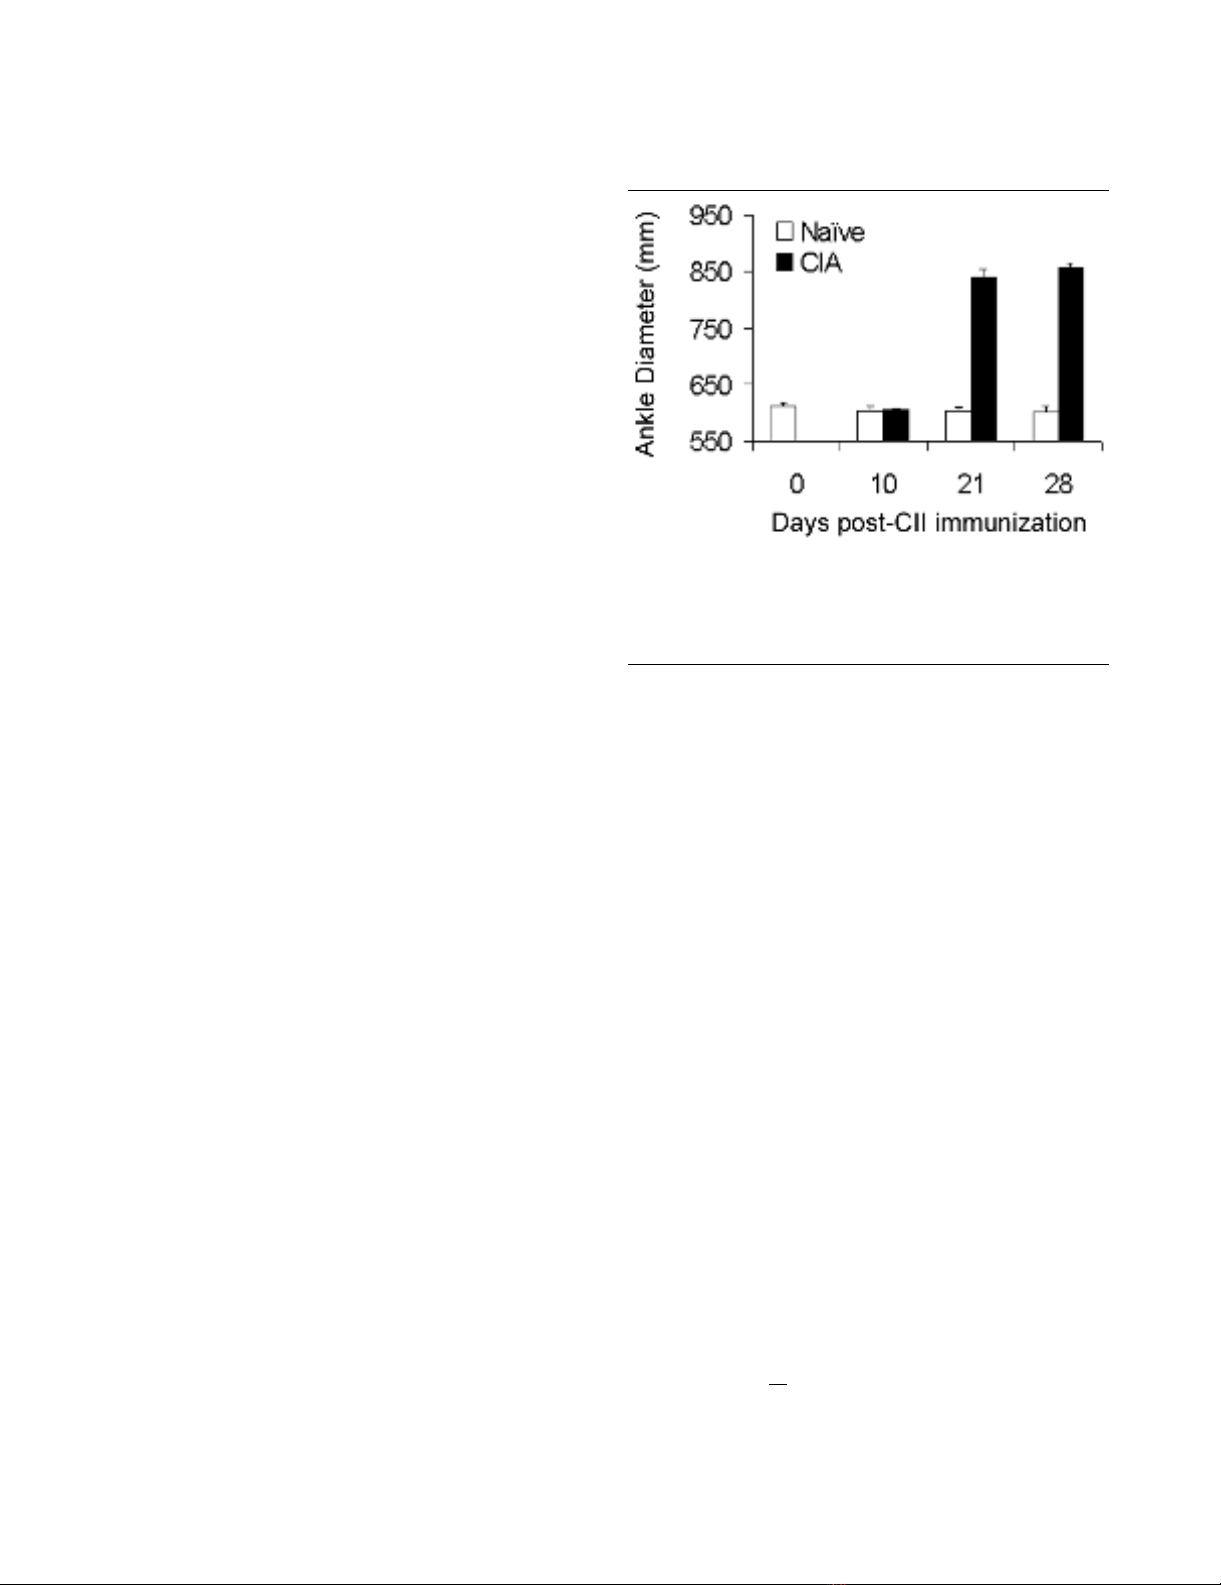
Figure 1
Inflammatory response in the ankles of rats during the development of CIAInflammatory response in the ankles of rats during the development of
CIA. Ankle diameters were measured in naïve (n = 5) and CII immu-
nized (n = 10) rats on the indicated days, before blood collection and
sacrifice of the animals. Each time point represents a different set of
animals. CIA, collagen-induced arthritis; CII, collagen type II.
Arthritis Research & Therapy Vol 8 No 1 Shou et al.
Page 4 of 14
(page number not for citation purposes)
Bioinformatics analyses
Clustered correlation analysis
Cluster correlation analysis was performed with an R script
written in-house, in accordance with the method proposed by
Weinstein and coworkers [33].
Ortholog mapping and Gene Ontology analyses
Genbank accessions or gene identifications were retrieved
from published papers or online supplementary materials, and
their rat orthologs were obtained by querying NCBI Homolo-
Gene database [34]. The Gene Ontology (GO) analysis was
carried out by using GoMiner, developed by Weinstein and
colleagues [35]. Briefly, retrieved gene symbols were input
into GoMiner, which maps them onto the GO tree, in particular
the ontology Biological Process, using organism-specific
information provided by NCBI GoMiner server. Percentages of
differentially expressed genes were calculated for 10 selected
entries within the ontology Biological Process at the third or
fourth GO level.
Quantitative real-time RT-PCR validation
RNA from an independent CIA life phase study was used to
validate microarray data. Before cDNA synthesis, RNA sam-
ples were DNase treated to remove genomic DNA contamina-
tion by using Ambion's DNA-free Kit (Ambion Inc., Austin, TX,
USA), in accordance with the manufacturer's instructions.
cDNA was prepared from total RNA using Superscript III (InV-
itrogen, Carlsbad, CA, USA) with random primers as
described by the manufacturer. Real-time PCR was performed
on an ABI 7900HT from Applied Biosystems (ABI, Foster City,
CA, USA) with gene expression assays or with primers and
probes from Biosource International (Camarillo, CA). Primers
and probes were designed using Primer Express (ABI). Briefly,
cDNA templates for real-time PCR were prepared by diluting
1:100 with 10 mmol/l Tris (pH 7.5). The 20 µl TaqMan reac-
tion consisted of 1 × Universal Master Mix (ABI), 1 × Gene
Expression Assay (ABI), and 4 µl diluted cDNA. TaqMan reac-
tions for genes that were assayed with primers and probes
consisted of 1 × Universal Master Mix (ABI), 0.8 µmol/l for-
ward and reverse primers, 0.2 µmol/l probe, and 4 µl diluted
cDNA in a final volume of 20 µl.
Five replicates of each RT-PCR reaction were assembled in
384-well plates, on a Tecan Genesis 150 (Maennedorf, Swit-
zerland) liquid handling robot. Each plate included no RT con-
trols for each sample and no template control. Raw data were
analyzed using a macro created in Microsoft Excel. Briefly, the
high and low values from each of the five replicates were dis-
carded and the remaining three values averaged. The average
values were normalized to 18s rRNA relative expression val-
ues. Data analysis was conducted in JMP 5.1.1 (SAS Institute,
Cary, NC, USA). Best Box-Cox transformation was used in
order to fit the model. For comparing the means of groups with
the control group, the data for different time points were tested
through Dunnet's test. Conventional alpha (a = 0.05) is
regarded as significant.
Gene expression assays (ABI) were included for the following
genes: Galectin-3 (Lgals3, Rn_00582910_m1) and Cish3
(Rn00585674_s1). Primers and probes for Versican (Cspg2)
and IL-6 were purchased from Biosource International.
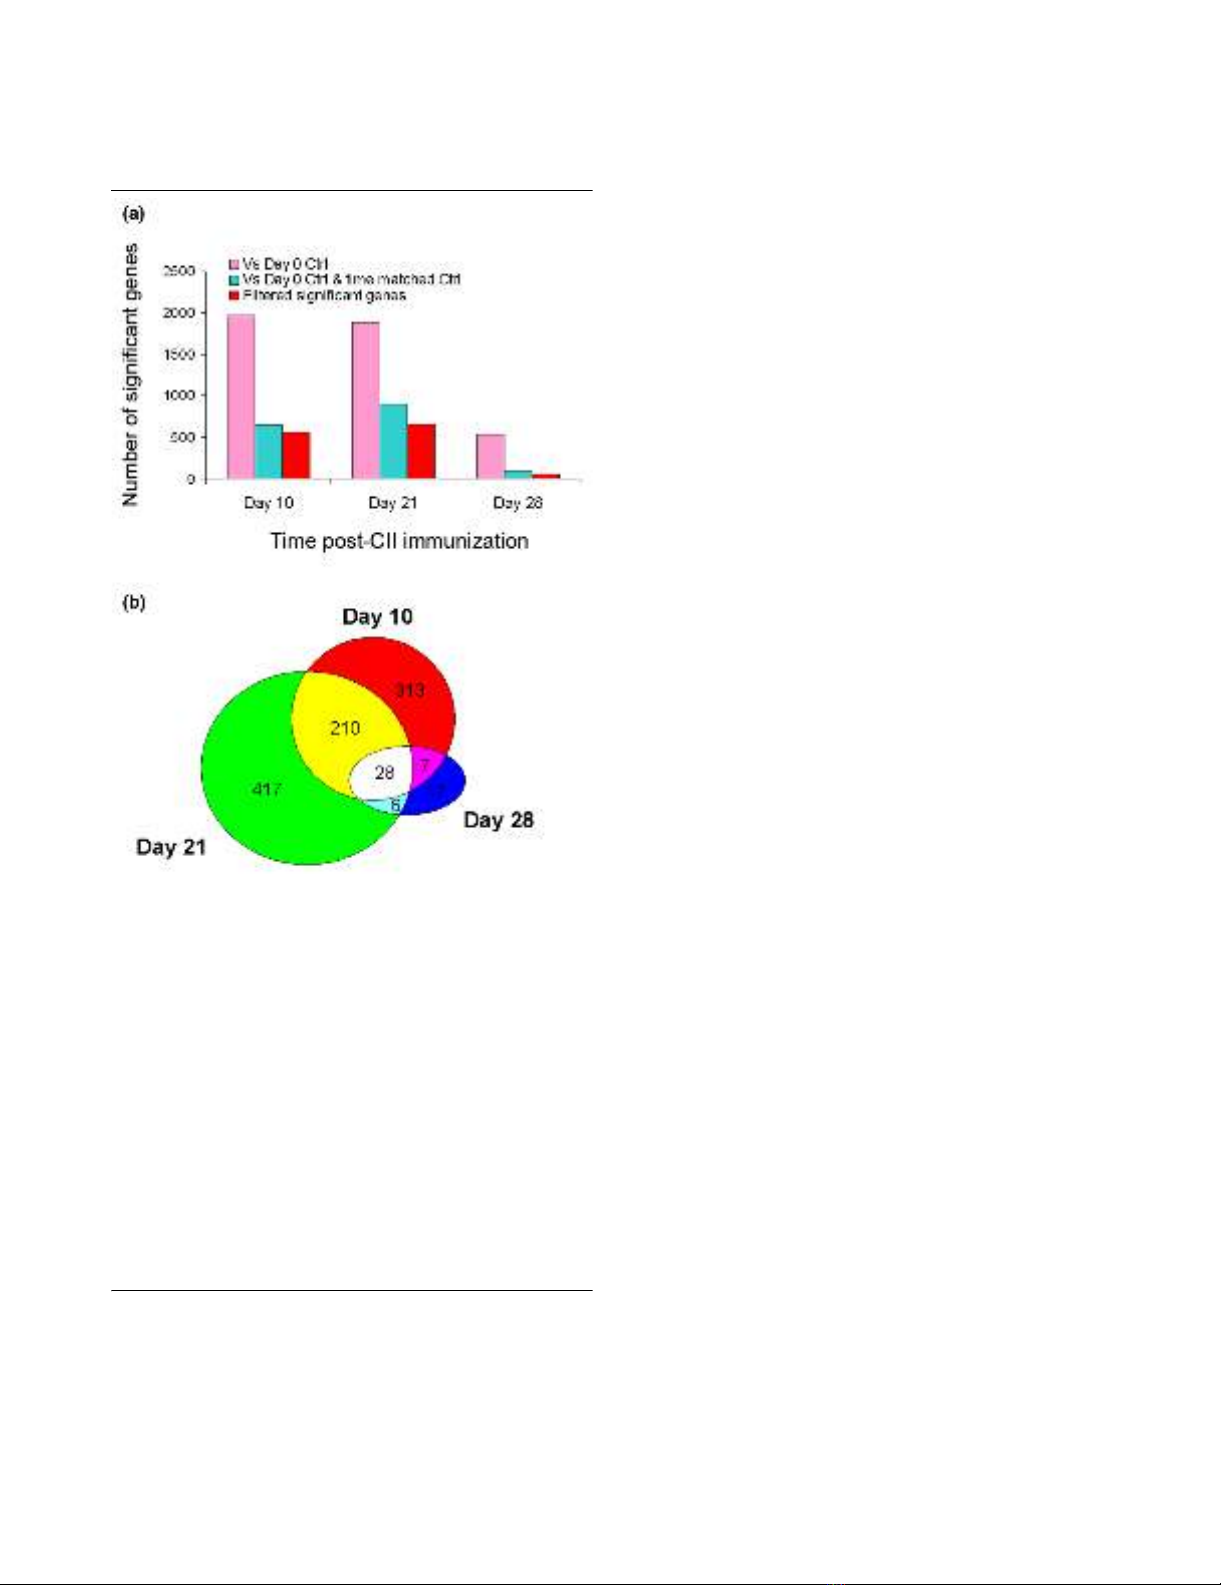
Figure 2
Identification of differentially expressed genes between the rats with CIA and the control ratsIdentification of differentially expressed genes between the rats with
CIA and the control rats. (a) Number of significantly changed probe
sets over time. Statistical pair-wise comparisons and empirical filtering
were applied to identify differentially expressed genes (FDR <0.05, fold
change >1.4, signal difference >250), as described in the Materials
and methods and Results sections. Pink bars represent the number of
probe sets that are significantly different from the day 0 control at the
indicated time points. Blue bars represent the number of probe sets
that are significantly different from the day 0 control as well as the time-
matched control at the indicated time points. Red bars represent the
number of probe sets that are significantly different from the day 0 con-
trol as well as the time-matched control at indicated time points, with
the probe sets that fluctuated in control animals excluded. (b) Venn dia-
gram of the differentially expressed genes. Probe sets identified as sig-
nificantly changed genes at each time point were examined for
overlapping over time. There are a total of 28 probe sets that signifi-
cantly changed at all three time points. Note that there is a considera-
ble amount of overlapping between day 10 and day 21; half of the
genes identified at day 28 are also included in the day 10 and day 21
gene lists. CII, collagen type II; FDR, false discovery rate.

Available online http://arthritis-research.com/content/8/1/R28
Page 5 of 14
(page number not for citation purposes)
Sequences for the Cspg2 primers were as follows: forward,
5'-CGCCTAAGACACTACGTATGCTTGT-3'; reverse, 5'-
TTGGTCCTATGTTGACTGTTTCTCA-3'; and probe, 5'-
AGCATAGTCATTCCCTCTAAGCCAAAGAAGGTTC-3',
labeled with 6-FAM and BHQ-1. IL-6 primers were as follows:
forward, 5'-CATAGTCGTGCCTGTGTGCTTAG-3'; reverse,
5'-AGGTCTCGTTTATTAAAGCAGAACAAG-3'; and probe,
5' TTTCCTCCTGACAACGCTGCTGGG-3', labeled with 6-
FAM and BHQ-1.
Synovial tissue culture and Western blot analysis for
Galectin-3
Synovial tissue from the arthritic rats at different times after CII
immunization were dissected and collected in the collecting
Table 1
Genes that changed significantly in all the arthritic rat blood samples
Probe set Fold change (CIA/control) Gene description
Day 10 Day 21 Day 28
1367612_at 4.94 4.31 2.10 Mgst1: microsomal glutathione S-transferase 1
1367816_at 1.89 2.58 1.51 GIIg15b: protein similar to 2300002F06Rik
1367900_at 4.93 4.56 2.93 Gyg: glycogenin (glycogenin glucosyltransferase)
1367904_at --1.84 --1.76 --1.49 Resp18: regulated endocrine-specific protein 18
1369584_at 1.76 2.32 1.91 Socs3 (Cish3): suppressor of cytokine signaling 3
1369956_at 2.81 2.82 1.98 Ifngr: similar to interferon gamma receptor
1370119_at 3.10 2.73 1.86 Lst1: member of the LST-1 protein family
1370249_at 3.01 3.99 1.92 Bzrp: peripheral-type benzodiazepine receptor
1371916_at 2.64 3.29 1.60 Sepr: selenoprotein R
1372150_at --2.24 --2.39 --1.72 Usp10: human ubiquitin specific protease 10 like
1372248_at --1.88 --3.11 --1.76 SESN1: p53 regulated PA26 nuclear protein
1372691_at 4.46 6.19 2.32 Upp1: uridine phosphorylase 1
1373656_at 2.83 4.03 1.74 --
1374375_at 3.45 5.60 2.21 2610034M16Rik
1377092_at 3.61 2.38 3.71
1377110_at --1.49 --2.60 --1.48 Plxdc1: plexin repeat containing family member
1386052_at --1.80 --2.70 --1.58
1386879_at 3.35 5.20 2.36 Lgals3: Galectin-3
1386908_at 2.66 2.32 1.61 Glrx1: Glutaredoxin
1387568_at 3.68 4.65 1.82 Pirb: paired immunoglobulin-like receptor-B
1387599_a_at 2.73 4.12 1.76 Nqo1: NADH:NADPH diaphorase
1388054_a_at 3.64 3.31 1.98 Cspg2: chondroitin sulfate proteoglycan 2 (versican)
1388142_at 3.82 3.15 1.90 Cspg2: chondroitin sulfate proteoglycan 2 (versican)
1388265_x_at 1.75 2.60 2.28 Cspg2: chondroitin sulfate proteoglycan 2 (versican)
1388416_at 3.10 2.03 1.99 --
1388528_at --1.50 --2.24 --1.43 Fbl: Fibrillarin
1389006_at 2.15 1.89 1.46 Mpeg1: member of the membrane attack complex
1389408_at 2.91 3.09 1.58
Listed are probe sets for genes that showed significant difference between the arthritic and control rat blood identified by analysis of variance and
filtered by empirical cutoffs. Probe set: identification of known genes and expressed sequence tags on the chip; Fold change: fold change values
that was calculated between the arthritic samples and the time-matched controls; gene description: description of the genes encoded by the
corresponding probe set.


