
Genome Biology 2006, 7:R44
comment reviews reports deposited research refereed research interactions information
Open Access
2006Mauet al.Volume 7, Issue 5, Article R44
Research
Genome-wide detection and analysis of homologous recombination
among sequenced strains of Escherichia coli
Bob Mau*†‡, Jeremy D Glasner‡, Aaron E Darling§ and Nicole T Perna‡¶
Addresses: *Department of Mathematics, Lincoln Drive, University of Wisconsin, Madison WI 53706, USA. †Department of Oncology,
University Ave, University of Wisconsin, Madison WI 53706, USA. ‡Genome Center of Wisconsin, Henry Mall, University of Wisconsin,
Madison WI 53706, USA. §Department of Computer Science, W. Dayton St, University of Wisconsin, Madison WI 53706, USA. ¶Department of
Animal Health and Biomedical Sciences, Linden Drive, University of Wisconsin, Madison WI 53706, USA.
Correspondence: Bob Mau. Email: bobmau@biochem.wisc.edu
© 2006 Mau et al.; licensee BioMed Central Ltd.
This is an open access article distributed under the terms of the Creative Commons Attribution License (http://creativecommons.org/licenses/by/2.0), which
permits unrestricted use, distribution, and reproduction in any medium, provided the original work is properly cited.
Recombination among bacterial strains<p>Multiple alignment of <it>E. coli </it>and <it>Shigella </it>genomes reveals that intraspecific recombination is more common than previously thought.</p>
Abstract
Background: Comparisons of complete bacterial genomes reveal evidence of lateral transfer of
DNA across otherwise clonally diverging lineages. Some lateral transfer events result in acquisition
of novel genomic segments and are easily detected through genome comparison. Other more
subtle lateral transfers involve homologous recombination events that result in substitution of
alleles within conserved genomic regions. This type of event is observed infrequently among
distantly related organisms. It is reported to be more common within species, but the frequency
has been difficult to quantify since the sequences under comparison tend to have relatively few
polymorphic sites.
Results: Here we report a genome-wide assessment of homologous recombination among a
collection of six complete Escherichia coli and Shigella flexneri genome sequences. We construct a
whole-genome multiple alignment and identify clusters of polymorphic sites that exhibit atypical
patterns of nucleotide substitution using a random walk-based method. The analysis reveals one
large segment (approximately 100 kb) and 186 smaller clusters of single base pair differences that
suggest lateral exchange between lineages. These clusters include portions of 10% of the 3,100
genes conserved in six genomes. Statistical analysis of the functional roles of these genes reveals
that several classes of genes are over-represented, including those involved in recombination,
transport and motility.
Conclusion: We demonstrate that intraspecific recombination in E. coli is much more common
than previously appreciated and may show a bias for certain types of genes. The described method
provides high-specificity, conservative inference of past recombination events.
Background
The role of lateral gene transfer (LGT) in shaping prokaryotic
genomes has been the subject of intense investigation and
debate in recent years [1-10]. In the pre-genomic era, the
handful of examples of LGT were detected primarily as dis-
cordance between phylogenetic reconstructions with differ-
ent housekeeping genes [11-14]. The explosion of publicly
available bacterial genome sequences, coupled with the
Published: 31 May 2006
Genome Biology 2006, 7:R44 (doi:10.1186/gb-2006-7-5-r44)
Received: 1 November 2005
Revised: 8 February 2006
Accepted: 8 May 2006
The electronic version of this article is the complete one and can be
found online at http://genomebiology.com/2006/7/5/R44

R44.2 Genome Biology 2006, Volume 7, Issue 5, Article R44 Mau et al. http://genomebiology.com/2006/7/5/R44
Genome Biology 2006, 7:R44
development of whole-genome comparison tools [15-17], ini-
tially focused LGT discovery on genome-wide scans for
islands of sequences specific to particular lineages of bacteria
(for example, [18-21]). Most recently, phylogenetic
approaches are applied to detect LGT among genome-wide
sets of putative orthologs [2,9,10]. Together, these studies
point to low, but detectable, levels of LGT among distantly
related species with occasionally higher rates found among
organisms that occupy similar environments. Closely related
organisms show higher levels of LGT, with intraspecific com-
parisons showing the highest levels. Two limitations of these
analyses are the lack of phylogenetic resolution, particularly
among intraspecific comparisons, and the reliance on anno-
tated boundaries of genes in delineating candidate regions.
Statistical and phylogenetic methods have been developed for
detecting recombination in aligned sequences of single genes
or relatively short genomic segments. One general approach,
referred to as nucleotide substitution distribution methods in
[22], assesses atypical clusters of nucleotide differences.
Clusters come in two flavors: groups of polymorphisms
exhibiting the same topologically discordant pattern [23,24],
or an elevated rate of mutation in a single lineage across a seg-
ment of the alignment [25-28]. The former indicates recom-
bination between compared strains, while the latter implies a
recombination with some unknown, more divergent, strain.
Phylogenetic methods are most often applied in the context of
detecting recombination break points in sequence alignments
[29-32]. These methods require longer alignments, are com-
putationally intensive, and have reportedly been outper-
formed by substitution distribution methods on simulated
test data [33].
Genome-scale analyses of lateral transfer events have typi-
cally relied on identification of incongruent tree topologies
from phylogenetic analyses of sets of putative orthologous
genes identified by reciprocal BLAST analyses [7,9,34]. This
approach can be confounded by errors associated with
BLAST, such as false-positive orthologs, is limited to identify-
ing recombination events that occur within gene boundaries,
and is unlikely to identify short recombined regions within
genes.
Recently, a Markov clustering algorithm was used to partition
orthologous pairs of genes, determined by an all versus all
BLAST comparison of 144 fully sequenced prokaryotic
genomes, into maximally representative clusters [10,35].
Bayesian phylogenetic analysis (for example, [36,37]) was
applied to each cluster of four or more taxa to infer lateral
gene transfer against the background of a consensus 'super-
tree' of sequenced bacteria. This approach is most successful
in determining global pathways of gene transfer between
phyla and divisions of prokaryotes, where homologous
recombination is unlikely to have played a significant role.
Rather, these likely arise as illegitimate recombination
events.
Here, we develop a method to detect segments of closely
related genomes that have been replaced with a homologous
copy from another conspecific lineage, that is, an allelic sub-
stitution. The method is not designed to detect non-homolo-
gous sequences that may have accompanied a homologous
recombination event or homologous recombination events
involving identical alleles.
The method compiles a list of polymorphism sites from a
whole-genome multiple alignment, then applies score func-
tions to locate clusters discordant with the predominant phy-
logenetic signal. Identified clusters can cross gene boundaries
and non-coding sequence. Our use of extreme value theory
furnishes us with a statistically defensible criterion to assess
significance of these clusters in much the same manner as the
Karlin-Altschul statistics help interpret BLAST results
[38,39].
We apply the recombination detection method to the pub-
lished genome sequences of several E. coli [18,40-44]. Con-
struction of a multiple whole genome alignment facilitates a
global survey of recombination among these E. coli isolates.
Genome sequences must first be partitioned into locally col-
linear blocks (LCBs) - regions without rearrangement. Most
LCBs contain lineage-specific sequence acquired through lat-
eral gene transfer or differential gene loss. To further compli-
cate matters, non-homologous sequences from different
organisms can integrate into different lineages at a common
locus [18]. In a previous work, we developed a software pack-
age called Mauve [17] that can construct global multiple
genome alignments in the presence of rearrangement and lin-
eage-specific content. The Mauve alignments provide a con-
venient starting point for locating polymorphic patterns
indicative of intraspecific recombination, which we call allelic
substitution.
Results
As seen in Figure 1, the Mauve genome aligner takes the four
E. coli and two Shigella flexneri genome sequences and
returns 34 local alignments spanning 3.4 Mb of homologous
sequence common to all strains. The majority of rearrange-
ments occur in Shigella genomes where inversions between
copies of repetitive elements are relatively frequent [40].
Computer assisted screening of the Mauve output finds 733
problematic intervals inside LCBs in which base pairs do not
properly align because of gaps created by lineage specific
sequence and/or attempts to align non-homologous
sequence. Deleting these intervals from the alignment yields
130,008 high quality base pair differences. Common biparti-
tions, constituting 96.4% of all such differences, are listed in
Table 1.
http://genomebiology.com/2006/7/5/R44 Genome Biology 2006, Volume 7, Issue 5, Article R44 Mau et al. R44.3
comment reviews reports refereed researchdeposited research interactions information
Genome Biology 2006, 7:R44
We use the term 'single nucleotide difference' (SND) to
describe the partition structure at a variable site in the
alignment. A representative 100 base-pair (bp) segment of
the 3.4 Mb alignment is presented in Figure 2 for illustrative
purposes.
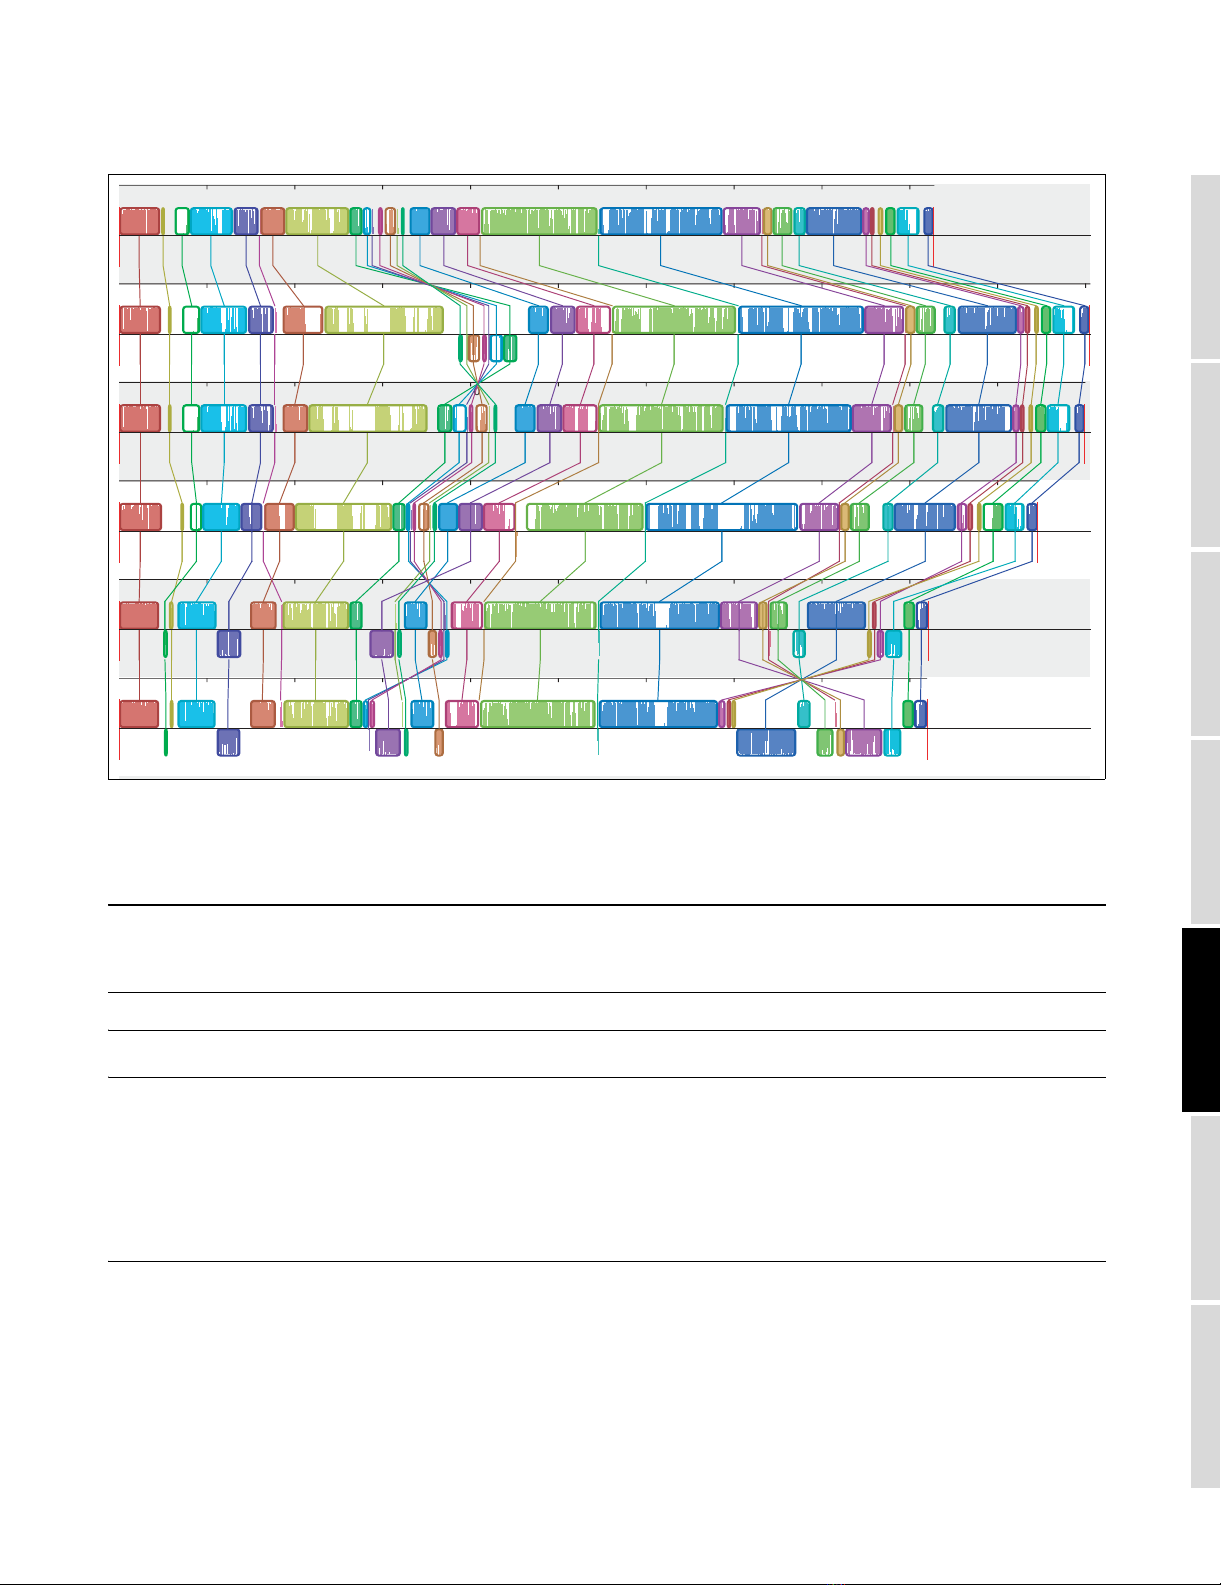
A multiple whole-genome alignment of six strains consists of 34 rearranged pieces larger than 1 kbFigure 1
A multiple whole-genome alignment of six strains consists of 34 rearranged pieces larger than 1 kb. Each genome is laid out horizontally with homologous
segments (LCBs) outlined as colored rectangles. Regions inverted relative to E. coli K-12 are set below those that match in the forward orientation. Lines
collate aligned segments between genomes. Average sequence similarities within an LCB, measured in sliding windows, are proportional to the heights of
interior colored bars. Large sections of white within blocks and gaps between blocks indicate lineage specific sequence.
Table 1
Frequency of common patterns of single nucleotide differences
Bipartition (Split) Pattern KOOCSS Number of SNDs Relative frequency
((KSSOO) C) 111211 50,354 38.73
((KSSC)(OO)) 122111 19,678 15.14
((KOOC)(SS)) 111122 18,490 14.22
(K(OOSSC)) 122222 14,115 10.86
((KSS)(OOC)) = KS 122211 9,882 7.60
((KOO)(SSC)) = KO 111222 6,890 5.30
((KC)(OOSS)) = KC 122122 5,874 4.52
Common single nucleotide differences have two alleles. Each such nucleotide difference separates the six genomes into two classes. Pattern codes
are represented as 6-tuples of ones and twos (for allele 1 and allele 2) in the following order: (K) E. coli K-12 MG1655, (O) E. coli O157:H7 EDL933,
(O) E. coli O157:H7 Sakai strain RIMD0509952, (C) E. coli CFT073, (S) Shigella flexneri 2A 301, and (S) Shigella flexneri 2A 2457T. By convention, K-12
is always allele one. For brevity, key groupings are denoted as KS, KO, or KC. The remaining 3.6% SNDs come in over 50 different patterns,
including one quadripartition. See appendix 1 in Additional data file 1 for additional frequencies.
500000 1000000 1500000 2000000 2500000 3000000 3500000 4000000 450000
0
500000 1000000 1500000 2000000 2500000 3000000 3500000 4000000 450000
0
500000 1000000 1500000 2000000 2500000 3000000 3500000 4000000 4500000 5000000
500000 1000000 1500000 2000000 2500000 3000000 3500000 4000000 4500000 5000000
500000 1000000 1500000 2000000 2500000 3000000 3500000 4000000 4500000 5000000 5500
0
500000 1000000 1500000 2000000 2500000 3000000 3500000 4000000 4500000
Shigella flexneri 2A 2457T
Shigella flexneri 2A 301
E. coli CFT073
E. coli O157:H7 RIMD 0509952
E. coli O157:H7 EDL933
E. coli K12 MG1655
R44.4 Genome Biology 2006, Volume 7, Issue 5, Article R44 Mau et al. http://genomebiology.com/2006/7/5/R44
Genome Biology 2006, 7:R44
All but 2% of variable sites are bi-allelic, meaning each site
splits six strains into two groups, called a bipartition. Nearly
80% of the bi-allelic SNDs have a minor allele unique to the
CFT, K-12, O157:H7, or S. flexneri lineage. The remaining bi-
allelic SNDs divide the lineages into three alternative pairings
of sister taxa, giving rise to three alternative unrooted tree
topologies denoted as: ψKS (K-12 with S. flexneri, CFT with
O157:H7); ψKO (K-12 with O157:H7, CFT with S. flexneri); and
ψKC (K-12 with CFT, O157:H7 with S. flexneri).
The four lineages serve as operational taxonomic units
(OTUs) in our study of allelic substitution in E. coli. When
nucleotides at a polymorphic site exhibit a partition structure
explainable by a single point mutation, the induced biparti-
tion is said to be compatible with the enabling topology.
Bipartitions labeled KS, KO, and KC in Table 1 are compatible
with the topologies ψKS, ψKO, and ψKC, respectively. Note that
frequency of the KS pattern exceeds that of each of its compet-
itors by 3,000 SNDs, thus certifying ψKS as the 'species' topol-
ogy. The elevated frequency of SNDs unique to CFT roots
topology ψKS as (((KS)O)C). The 102,000 topologically unin-
formative lineage-specific SNDs nevertheless provide infor-
mation that our method uses to assess recombination.
We define three complementary score functions that discrim-
inate between KS, KO, and KC patterns. Each of these score
functions assigns an integer value to each SND pattern. Mov-
ing across the chromosome of reference strain MG1655, we
keep a cumulative sum of the scores assigned by each function
to consecutive SNDs in the alignment. Graphical representa-
tions of cumulative scores, called random walk plots or excur-
sions, can reveal large-scale variations in feature
composition. Excursions for each of the three topologies are
plotted concurrently in Figure 3.
A large phylogenetic anomaly appears midway through the
alignment. Magnification of a 100 kb segment between 1.95
and 2.1 Mb reveals a core 40 kb region in which KO SNDs are
the dominant pattern of substitution, flanked by transitional
regions for which ψKO serves as the 'gene tree' as well.
Global random walk plots highlight grossly deviant regions.
In this alignment, a solitary segment stands out. All other
regions appear indistinguishable from one another in Figure
3. Unless stated to the contrary, DNA sequence and genes
from the large atypical region (from sdiA to gnd) are excluded
from further computations (a separate analysis of this region
is included in Appendix 2 of Additional data file 1).
Local variation in phylogenetic signal
In Figure 3, clusters of like patterns labeled KS, KC, or KO
generate tiny, imperceptible bumps in the corresponding ran-
dom walk plots. Examined at higher resolution (data not
shown), they can be seen to punctuate each excursion. How-
ever, manual scanning of high-resolution random walk plots
is tedious, time consuming, and error-prone. In Materials
and methods, we describe an alternative strategy that auto-
matically scans for clusters at the local level.
The score functions generating Figure 3 are designed to elicit
large positive local scores (differences in cumulative scores
Small sample segment of the alignment spanning the start of the mutS gene (denoted in blue)Figure 2
Small sample segment of the alignment spanning the start of the mutS gene (denoted in blue). Location of a mismatch is indicated by the integer '1' along
the bottom row. Five columns contain SNDs: TTTCTT, AAAGAA, AAATAA, GGGAGG, and GAAAAA. The first four share the same bipartition pattern
(111211) and are deemed equivalent, even though one of them results from a transversion. The other SND is considered distinct despite having the same
mutation (A to G) found in the second SND.
START CDS
mutS
AATATCAGGGAACCGGACATAACCCCATGAGTGCAATAGAAAATTTCGACGCCCATACGCCCATGATGCAGCAGTATCTCAGGCTGAAAGCCCAGCATCC
K-12 MG1655
AATATCAGGGAACCGGACATAACCCCATGAGTGCAATAGAAAATTTCGACGCCCATACGCCCATGATGCAGCAGTATCTCAAGCTGAAAGCCCAGCATCC
O157:H7 EDL933
AATATCAGGGAACCGGACATAACCCCATGAGTGCAATAGAAAATTTCGACGCCCATACGCCCATGATGCAGCAGTATCTCAAGCTGAAAGCCCAGCATCC
O157:H7 Sakai
AACATCAGGGAGCCGGACTTAACCCCATGAGTACAATAGAAAATTTCGACGCCCATACGCCCATGATGCAGCAGTATCTCAAGCTGAAAGCCCAGCATCC
CFT073
AATATCAGGGAACCGGACATAACCCCATGAGTGCAATAGAAAATTTCGACGCCCATACGCCCATGATGCAGCAGTATCTCAAGCTGAAAGCCCAGCATCC
S.flexneri 2A 301
AATATCAGGGAACCGGACATAACCCCATGAGTGCAATAGAAAATTTCGACGCCCATACGCCCATGATGCAGCAGTATCTCAAGCTGAAAGCCCAGCATCC
S.flexneri 2A 2457T
2855097^ 2855107^ 2855117^ 2855127^ 2855137^ 2855147^ 2855157^ 2855167^ 2855177^
Coordinates in K-12
1 1 1 1 1
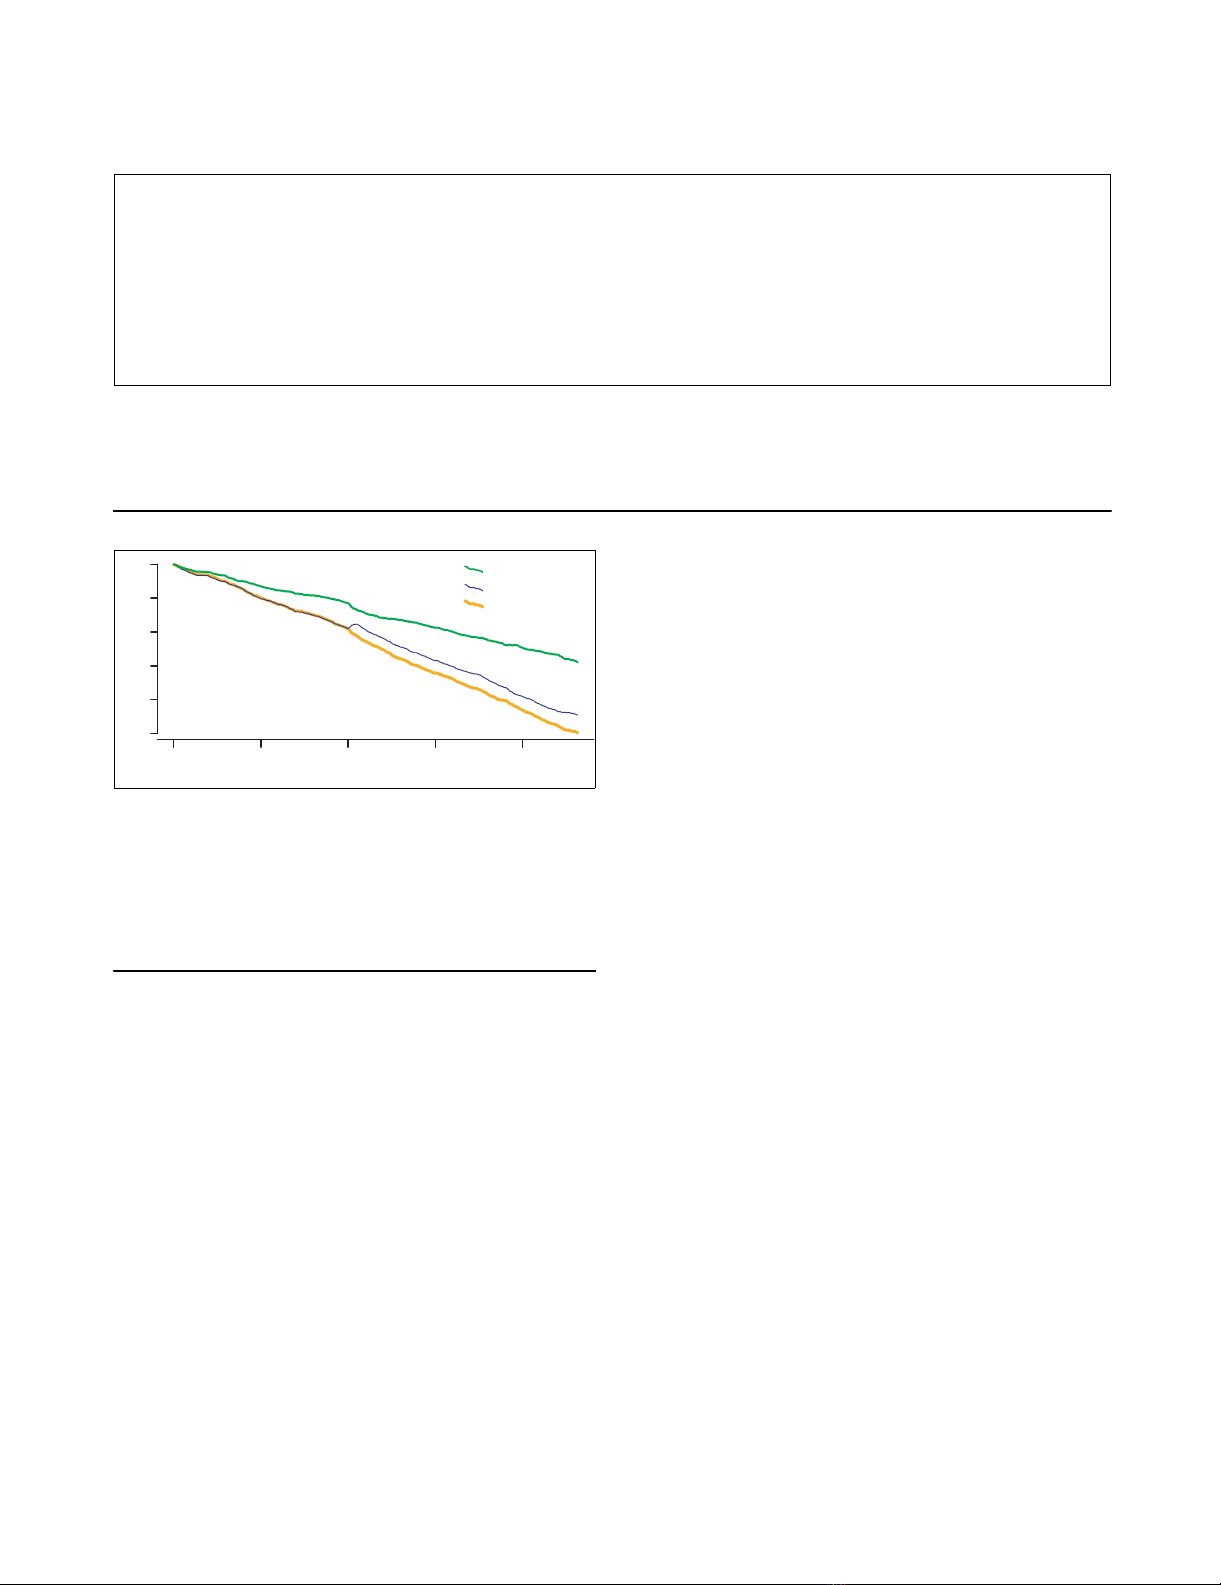
Three excursions (KS, KO, and KC) spanning the alignment with K-12 MG1655 as reference genomeFigure 3
Three excursions (KS, KO, and KC) spanning the alignment with K-12
MG1655 as reference genome. The KS random walk plot, representing the
dominant clonal topology, decreases more gradually than do the two
other plots. Excursions for the discordant topologies (patterns KO and
KC) run parallel to one another, except in a 100 kb region at 2 Mb where
KO abruptly increases. Parallel flat gaps common to all three plots reflect
K-12 lineage specific sequence.
0 Mbp 1 Mbp 2 Mbp 3 Mbp 4 Mbp
−250,000 −150,000 −50,000
E. coli K−12 genome coordinates
Cumulative scores
KS random walk
KO random walk
KC random walk

http://genomebiology.com/2006/7/5/R44 Genome Biology 2006, Volume 7, Issue 5, Article R44 Mau et al. R44.5
comment reviews reports refereed researchdeposited research interactions information
Genome Biology 2006, 7:R44
evaluated at nearby positions) whenever clusters of like, top-
ologically informative, patterns are encountered. When that
local score exceeds a predetermined threshold, the interval
between the delimiting SNDs is declared a high scoring seg-
ment (HSS). The strategy behind this scheme is exactly anal-
ogous to BLAST [38], in which high scoring segments denote
probable homology between the query and one or more refer-
ence sequences.
When two lineages share a nucleotide that is not the result of
a single mutation in a common ancestor, a homoplasy is said
to have occurred. Homoplasies arise either through multiple
mutations at a common site (convergent evolution) or recom-
bination. The former tend to be distributed randomly about
an alignment, whereas a recombination event typically pro-
duces a cluster of nucleotide differences at nearby sites exhib-
iting the same SND pattern. Our approach identifies such
clusters of nucleotide differences with a common phyloge-
netic partitioning pattern. Variability in mutation rates and
patterns in different chromosomal regions and bacterial line-
ages might also lead to physical clustering of similar substitu-
tions. Although the clustering of sites with similar patterns
strongly suggests homologous recombination between line-
ages, we cannot rule out the possibility that some clusters
arise by independent mutation-driven processes. Simple
score functions alone cannot distinguish between these two
possibilities, though the latter is believed to be relatively rare.
Our method relies on the relative intensity of particular SND
patterns (the one of interest versus all others) to measure
cluster formation, rather than the absolute number of SNDs
in any given fixed length segment of the alignment. As a
result, local mutational intensity is factored out of the analy-
sis. We assert this is legitimate provided the overall rate of
mutation is not too great, and local deviations from that aver-
age are not severe. We demonstrate in appendix 5 of Addi-
tional data file 1 that this is indeed the case for these six
genomes. Random SNDs can and do form clusters of identical
patterns simply by chance. Given the number of SNDs and
their relative frequencies within the alignment, we wish to
distinguish 'bumps' that are too large to have occurred by
chance.
Here again, BLAST statistics [39] serve as the model for
assessing significance. Random walk theory provides the
tools for assessing high scoring segments, and the corre-
sponding extreme value distributions (EVDs) guide selection
of appropriate thresholds. Random walks (as opposed to ran-
dom walk plots) are stochastic processes operating under a
fixed set of probabilities at each stage.
In the Materials and methods section, we apply the relevant
theory to derive thresholds. Using the appropriate extreme
value distribution as an arbiter, we chose a significance
threshold of 170 for clusters of KS SNDs and the same value
of 100 for both KO and KC, as their frequencies are nearly
identical outside the large atypical region (4.85% versus
4.57%). These thresholds define 186 high scoring segments
that span 7.5% of the sequence alignment. A breakdown by
pattern and range of scores is arrayed in Tables 2 and 3.
We deviate from BLAST protocols in one important respect: a
high scoring segment maximizes the local score, which is the
primary goal of sequence alignment. Here, we want to isolate
sub-regions within an HSS that individually exceed the signif-
icance threshold. Our rationale is that sequence between sub-
regions may not have participated in the recombination, and
we want to identify only those genomic intervals that possess
prima facie evidence of recombination.
Table 2
Distribution of scores of significant segments for discordant bipartitions
Bipartition pattern Number of segments exceeding a given HSS threshold of 100
101-110 111-125 126-200 >200 Total
KO (CS) 13 17 25 7 64
KC (OS) 14 16 18 5 53
Table 3
Distribution of scores for KS (OC) high scoring segments
Pattern Number of segments exceeding threshold of 170
170-200 201-220 221-250 251-400 >400 Total
KS (OC) 15 13 15 18 7 68


