
RESEARCH ARTICLE Open Access
High mobility group box 1 (HMGB1) and
anti-HMGB1 antibodies and their relation
to disease characteristics in systemic
lupus erythematosus
Deena A Abdulahad
*
, Johanna Westra, Johannes Bijzet, Pieter C Limburg, Cees GM Kallenberg and Marc Bijl
Abstract
Introduction: High Mobility Group Box 1 (HMGB1) is a nuclear non-histone protein. HMGB1, which is secreted by
inflammatory cells and passively released from apoptotic and necrotic cells, may act as a pro-inflammatory
mediator. As apoptotic cells accumulate in systemic lupus erythematosus (SLE), HMGB1 levels might be increased
in SLE. HMGB1 may also serve as an autoantigen, leading to the production of anti-HMGB1 antibodies. In this study
we determined levels of HMGB1 and anti-HMGB1 in SLE patients in comparison to healthy controls (HC) and
analysed their relation with disease activity.
Methods: The study population consisted of 70 SLE patients and 35 age- and sex-matched HC. Thirty-three SLE
patients had quiescent disease, the other 37 patients were selected for having active disease. Nineteen of these
had lupus nephritis. HMGB1 levels were measured with both Western blot and ELISA. Anti-HMGB1 levels were
measured by ELISA. Clinical and serological parameters were assessed according to routine procedures.
Results: HMGB1 levels in SLE patients could be measured reliably by Western blotting only, and were significantly
increased compared to HC. During active disease HMGB1 levels increased, in particular in patients with renal
involvement. Serum HMGB1 levels correlated with SLEDAI, proteinuria, and anti-dsDNA levels, and showed a
negative correlation with complement C3. Anti-HMGB1 levels were significantly increased in SLE patients compared
to HC, and positively correlated with HMGB1 levels.
Conclusions: Levels of HMGB1 in the sera of SLE patients, in particular in those with active renal disease, are
increased. Serum HMGB1 levels are related to SLEDAI scores and proteinuria, as well as to levels of anti-HMGB1
antibodies. These findings suggest that besides HMGB1, HMGB1-anti-HMGB1 immune complexes play a role in the
pathogenesis of SLE, in particular in patients with renal involvement.
Introduction
Systemic Lupus Erythematosus (SLE) is a systemic
autoimmune disease characterised by involvement of
multiple organ systems. Its aetiology is largely unknown;
however, genetic and environmental factors are pro-
posed to contribute to breaking tolerance, resulting in
the production of a variety of antibodies directed to
self-components [1]. These autoantibodies can form
immune complexes which can be deposited in many
tissues like skin and kidney [2-5]. Antinuclear autoanti-
bodies (ANA) and especially autoantibodies against
dsDNA (double stranded DNA) represent a serological
hallmark of SLE, and may serve as indicators for disease
activity and severity [6,7].
Pathophysiological mechanisms involved in breaking
tolerance against self components are not fully under-
stood. However, in the past few years disturbance in the
clearance of apoptotic cells has been reported, and it
has been suggested that apoptotic cells can serve as a
source of autoantigens [8-10].
* Correspondence: d.a.abdulahad@reuma.umcg.nl
Department of Rheumatology and Clinical Immunology, University Medical
Center Groningen, University of Groningen, PO Box 30.001, 9700 RB
Groningen, The Netherlands
Abdulahad et al.Arthritis Research & Therapy 2011, 13:R71
http://arthritis-research.com/content/13/3/R71
© 2011 Abdulahad et al.; licensee BioMed Central Ltd. This is an open access article distributed under the terms of the Creative
Commons Attribution License (http://creativecommons.org/licenses/by/2.0), which permits unrestricted use, distribution, and
reproduction in any medium, provided the original work is properly cited.
High mobility group box 1 (HMGB1), originally
recognised as a DNA binding protein, has recently been
identified as a damage associated molecular pattern
(DAMP) [11,12]. Inside the cell, it binds to DNA and
participates in many nuclear functions but once released
it is involved in inflammatory functions [13,14]. HMGB1
is actively released from LPS-, TNF a-andIL-1acti-
vated monocytes and macrophages and from other cell
types [13,15-17]. In addition, HMGB1 is released from
damaged dying cells during necrosis as well as during
the late phase of apoptosis [18,19]. Extracellular
HMGB1 exerts its biological actions through binding to
cell-surface receptors, such as RAGE (receptor of
advanced glycation end products), TLR2, TLR4, and the
intracellular receptor TLR9 [20-23].
Recent studies have shown an association between
HMGB1 and chronic inflammation and autoimmunity.
High levels of HMGB1 have been found in several
rheumatic diseases such as RA and Sjogren’ssyndrome
[24-26]. Little is known about the involvement of
HMGB1 in the pathogenesis of SLE. In SLE, HMGB1
was demonstrated to be associated with nucleosomes
released from apoptotic cells and to contribute to the
immunostimulatory effect of nucleosomes [27]. In
addition, HMGB1 has been found to be significantly
elevated in lupus sera and has been regarded as one of
the components in DNA-containing immune com-
plexes that enhance cytokine production through TLR9
or RAGE ligation [23,28,29]. Interestingly, in addition
to anti-dsDNA antibodies (anti-double stranded DNA
antibodies), antibodies against HMGB1 have been
detected in sera from SLE patients. As a result,
HMGB1 has been identified as new auto-antigen in
SLE [28]. The relation between levels of HMGB1,
levels of antibodies to HMGB1, disease activity and
disease manifestations of SLE has not been evaluated
extensively.
In this study we determined serum levels of HMGB1
and anti-HMGB1 antibodies in a large group of SLE
patients in relation to disease activity and disease
characteristics, with focus on renal involvement.
Materials and methods
Patients
The study population consisted of 70 SLE patients and 35
age- and sex-matched healthy controls (HC) following the
ethical consent approved by the human ethics committee.
All patients provided the informed consent and fulfilled
the criteria of the American College of Rheumatology for
SLE. Fifty-eight female (83%) and 12 (17%) male patients
were included; ages ranged from 18 to 73 years (mean
41.1 ± SD 13.5 yrs). Of the 70 SLE patients 33 were
patients with quiescent disease visiting the outpatient
clinic. The other 37 patients were selected for the presence
of active disease. Clinical data were obtained from all
patients and the study was approved by the human
ethics committee. Disease activity at the time of blood
sampling was assessed using SLE Disease Activity
Index (SLEDAI). Patients with SLEDAI ≥4were
considered active, and patients with a SLEDAI score
<4 were considered to have quiescent disease. Nineteen
of the 37 patients with active disease had renal invol-
vement and the remaining 18 patients had extra-renal
disease activity only. Levels of anti-dsDNA, C-reactive
protein (CRP), creatinine (Cr), glomerular filtration
rate (GFR), and complement factors (C3, C4) were
determined by routine techniques. The control group
comprised 35 healthy volunteers, 27 women (77%) and
8 men (23%), aged 21 to 64 (mean 38.4 ± SD 11.9 yrs).
Data are summarized in Tables 1 and 2.
ELISA for serum HMGB1
HMGB1 levels in the sera of patients and HC were quanti-
fied using a commercial enzyme-linked immunosorbent
Table 1 State of SLE patients included in the study
SLE patients
Quiescent disease (n= 33) Active disease (n= 37)
No. male/female 5/28 7/30
Age (years), median (range) 45 (19 to 73) 37 (18 to 73)
SLEDAI, median (range) 2 (0 to 4) 10 (5 to 16) ***
Anti-dsDNA (E/ml), median (range) 25 (3 to 408) 230 (3 to 6,683) ***
C3(g/l), median (range) 0.99 (0.54 to 1.46) 0.73 (0.21 to 1.68) ***
C4 (g/l), median (range) 0.15 (0.06 to 0.28) 0.12 (0.02 to 0.30) *
CRP (g/I), median (range) 5 (5 to 27) 6 (1 to 92)
No. with/without treatment 31/2 29/8
Users of Prednisone (%) Dose (mg/day), median (range) 19 (58%) 10 (2.5 to 50) 21 (57%) 7.50 (2.5 to 100)
Users of Azathioprine (%) Dose (mg/day), median (range) 8 (24%) 150 (50 to 150) 5 (14%) 100 (75 to 150)
Users of Hydroxychloroquine (%) Dose (mg/day), median (range) 19 (58%) 400 (150 to 600) 16 (43%) 400 (200 to 1,200)
* Difference between quiescent and active SLE patients (* P < 0.05,**P < 0.001,***P < 0.0001).
Abdulahad et al.Arthritis Research & Therapy 2011, 13:R71
http://arthritis-research.com/content/13/3/R71
Page 2 of 9

assay (ELISA) kit, according to manufacturer’s instructions
(Shino-test, Sagamihara, Kanagawa, Japan).
Western blot for serum HMGB1
Sera (3 μl) from SLE patients and HC were diluted in
72 μl SDS buffer (0.063 M Tris.HCl pH 6.8, 2% SDS,
10% glycerol, 0.015% BromePhenol Blue, and 5% ß-
mercaptoethanol) and heated at 98°C for five minutes.
Next, proteins were resolved on 12.5% SDS-PAGE gel
(Criterion gel BioRad, Veenendaal, The Netherlands)
and transferred to polyvinylidene fluoride membrane
(Millipore, Amsterdam, The Netherlands) followed by
blocking with Odyssey buffer (LI-COR Biotechnology,
Lincoln, NE, USA) at room temperature for one hour.
Membranes were then incubated with anti-HMGB1
mouse monoclonal antibody (1:250; R&D Systems,
Abingdon, UK) overnight in Odyssey buffer diluted
with PBS at 4°C. After washing with Tris buffered sal-
ine with Tween-20 (TBST), membranes were incubated
with polyclonal goat anti-mouse IgG labelled with
IRDye800 (1: 5000; LI-COR Biotechnology) for one
hour. Blots were scanned with Odyssey infrared Imaging
System (LI-COR Biotechnology) and then analysed with
the Odyssey software (version 2.1). A standard sample
was prepared by adding SDS buffer to human keratino-
cyte HaCaT cells and was included in each blot as an
internal control. In each blot, levels of HMGB1 were
expressed as values of fluorescence intensity and were
calculated against the standard sample.
Serum IgG depletion
Serum IgG was depleted using HiTrap Protein G HP
column, according to the manufacturer’s instructions
(GE Healthcare Europe, Diegem, Belgium).
ELISA for anti-HMGB1 antibodies
Autoantibodies against HMGB1 were measured by an
in-house developed ELISA. Briefly, Maxisorp polystyrene
96-wells plates were coated with 50 μLperwellof
rHMGB1 (R&D Systems, Abingdon, UK) at 1 μg/ml in
PBS and incubated overnight at 4°C. Plates were blocked
with 5% BSA in PBS for two hours. Serum samples,
diluted1:50inincubationbuffer,wereaddedindupli-
cate (100 μl/well) and incubated for two hours at room
temperature. After five washes, 100 μlHRP-conjugated
goat anti-human IgG (SouthernBiotech, Birmingham,
AL, USA), diluted 1:3,000, was added to each well and
incubated for one hour at room temperature. After
washing, bound antibodies were detected using 3,3’,5,
5’-tetramethylbenzidine dihydrochloride (TMB). The
reaction was stopped with 2 M sulphuric acid and the
absorbance was measured at 450 nm using a micro-
plate-spectrophotometer (Vmax, Molecular Devices,
Sunnyvale, CA, USA). Anti-HMGB1 antibody levels
were expressed in Optical Density values.
Statistical analysis
Data are presented as median (range) unless stated
otherwise. Statistical analysis was performed by using
the statistical package Graph Pad Prism, version 3.02
(Graph Pad Software Inc., San Diego, CA, USA).
A Student ttest or a Mann-Whitney test was used for
comparison of different groups as appropriate. Spear-
man rank correlation was used to assess correlations.
AP-value < 0.05 was considered significant.
Results
Serum HMGB1 levels by ELISA
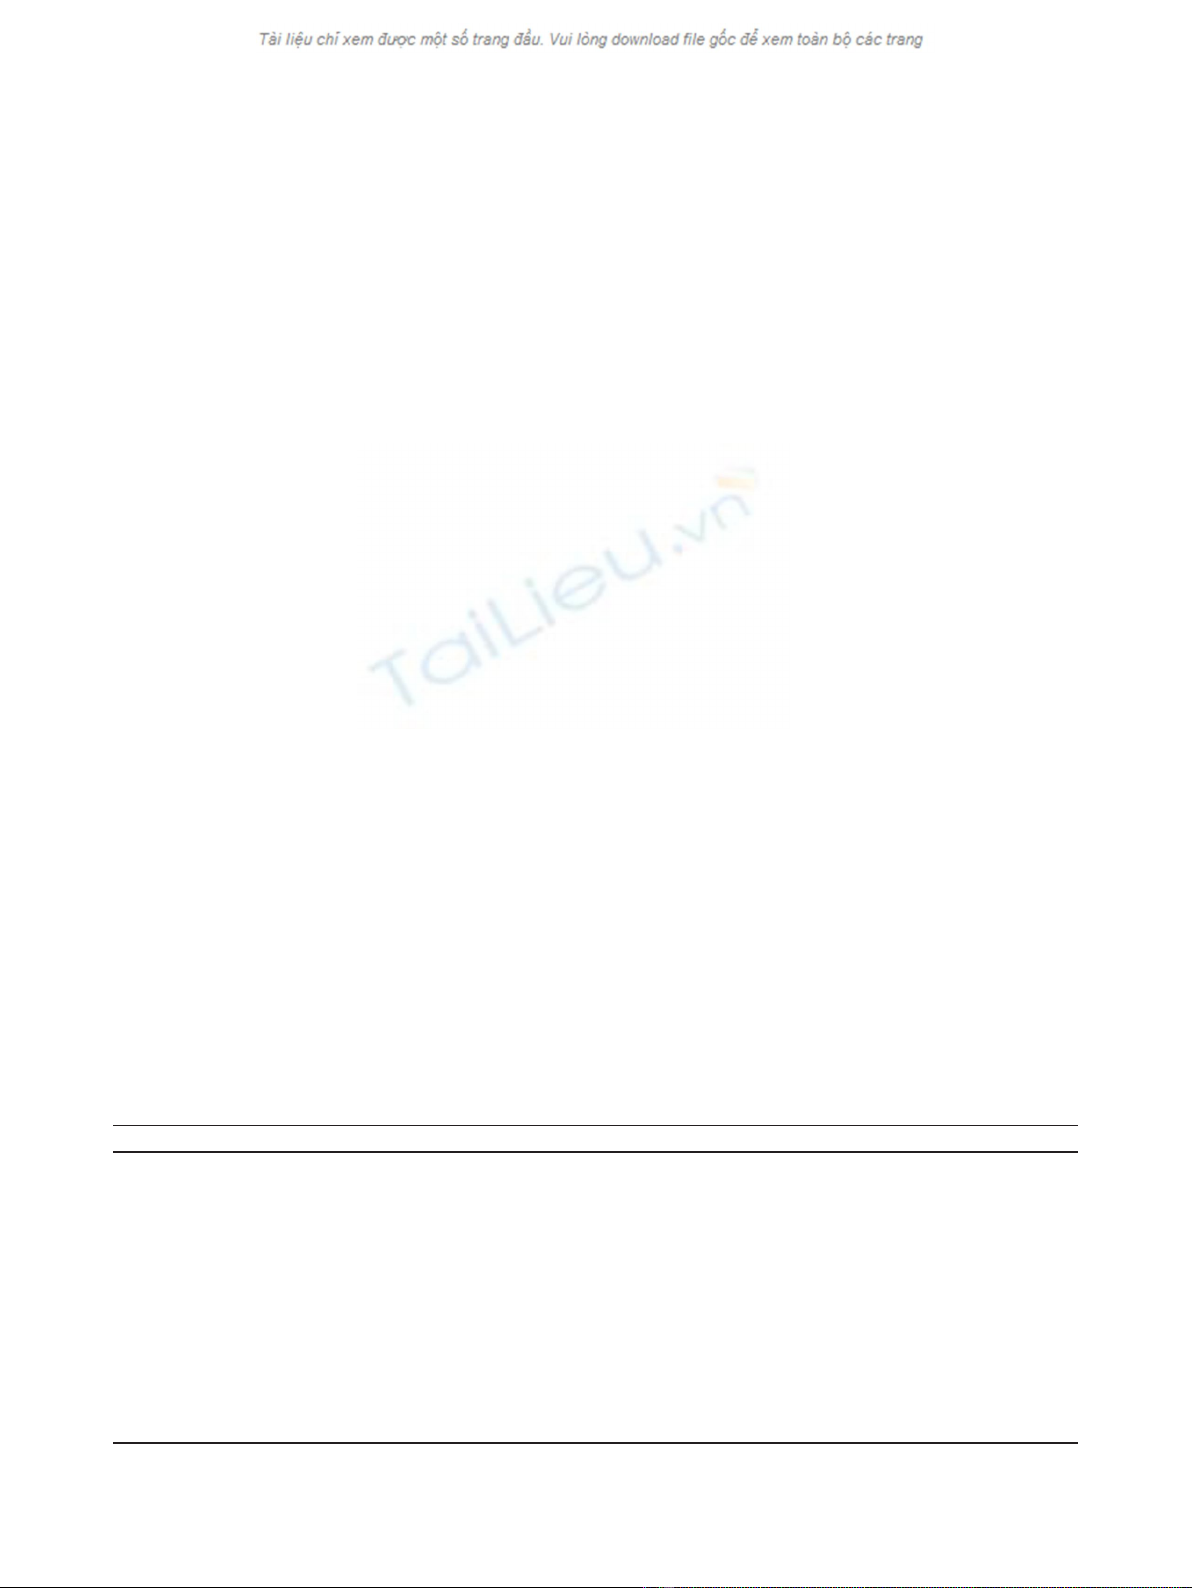
HMGB1 levels in serum samples from patients and HC
were assessed using a commercial ELISA kit. With this
kit we found increased HMGB1 levels in quiescent SLE
patients (6.2 ng/ml (1.3 to 32.3)) compared to HC (2.9
ng/ml (0 to 7.7)). However, in selected patients with
active disease, both those with renal and non-renal dis-
ease activity had decreased HMGB1 levels (1.2 ng/ml
(0 to 47.2)) and 2.3 ng/ml (0.95 to 12.5), respectively)
Table 2 Characteristics of active SLE patients with renal and non-renal involvement
Renal active (n = 19) Non-renal active (n = 18)
No. male/female 5/14 2/16
Age (yrs), median (range) 38 (18 to 73) 37 (19.60)
SLEDAI, median (range) 12 (6 to 16) *** 8 (5 to 10)
Anti-dsDNA (E/ml), median (range) 230 (7 to 6,683) 234 (3 to 1,000)
C3 (g/l), median (range) 0.58 (0.21 to 1.12) * 0.91 (0.37 to 1.68)
C4 (g/l), median (range) 0.10 (0.04 to 0.30) 0.13 (0.02 to 0.27)
CRP (g/l), median (range) 5 (1 to 81) 9.5 (3 to 92)
No. with/without treatment 17/2 12/6
Users of Prednisone (%) Dose (mg/day), median (range) 14 (78%) 6.25 (2.5 to 100) 7 (39%) 7.50 (5 to 20)
Users of Azathioprine (%) Dose (mg/day), median (range) 2 (11%) 87.5 (75 to 100) 3 (17%) 125 (100 to 150)
Users of Hydroxychloroquine (%) Dose (mg/day), median (range) 8 (42%) 400 (200 to 400) 8 (44%) 400 (200 to 1,200)
* Difference between renal active patients and non-renal active SLE patients. (*P < 0.05,***P < 0.0001).
Abdulahad et al.Arthritis Research & Therapy 2011, 13:R71
http://arthritis-research.com/content/13/3/R71
Page 3 of 9
compared to HC. Levels of HMGB1 in patients with
active disease were also significantly lower in compari-
son to quiescent patients. In addition, HMGB1 levels
were significantly decreased in patients with renal invol-
vement compared to those without (Figure 1A).
Considering the possibility that serum proteins and
antibodies interfere with HMGB1 in the ELISA system,
we measured serum HMGB1 levels as well by Western
blot.
Serum HMGB1 levels measured by Western blot
HMGB1 levels in serum samples from SLE patients and
HC were additionally assessed using a Western blot
assay. In quiescent SLE patients, HMGB1 levels were
significantly increased (51 (28 to 121)) compared to HC
(43 (7 to 85)), while in patients who had active disease
HMGB1 levels were even higher (135 (55 to 496)),
(Figure 1B). Within the group of active patients those
with renal manifestations had higher HMGB1 levels
(165 (81 to 496)) compared to active patients with non-
renal manifestations (107 (55 to 310)) (Figure 1C).
HMGB1 results obtained by Western blot were further
used for correlations and conclusion as we interpreted
the discordant results obtained by ELISA as a possible
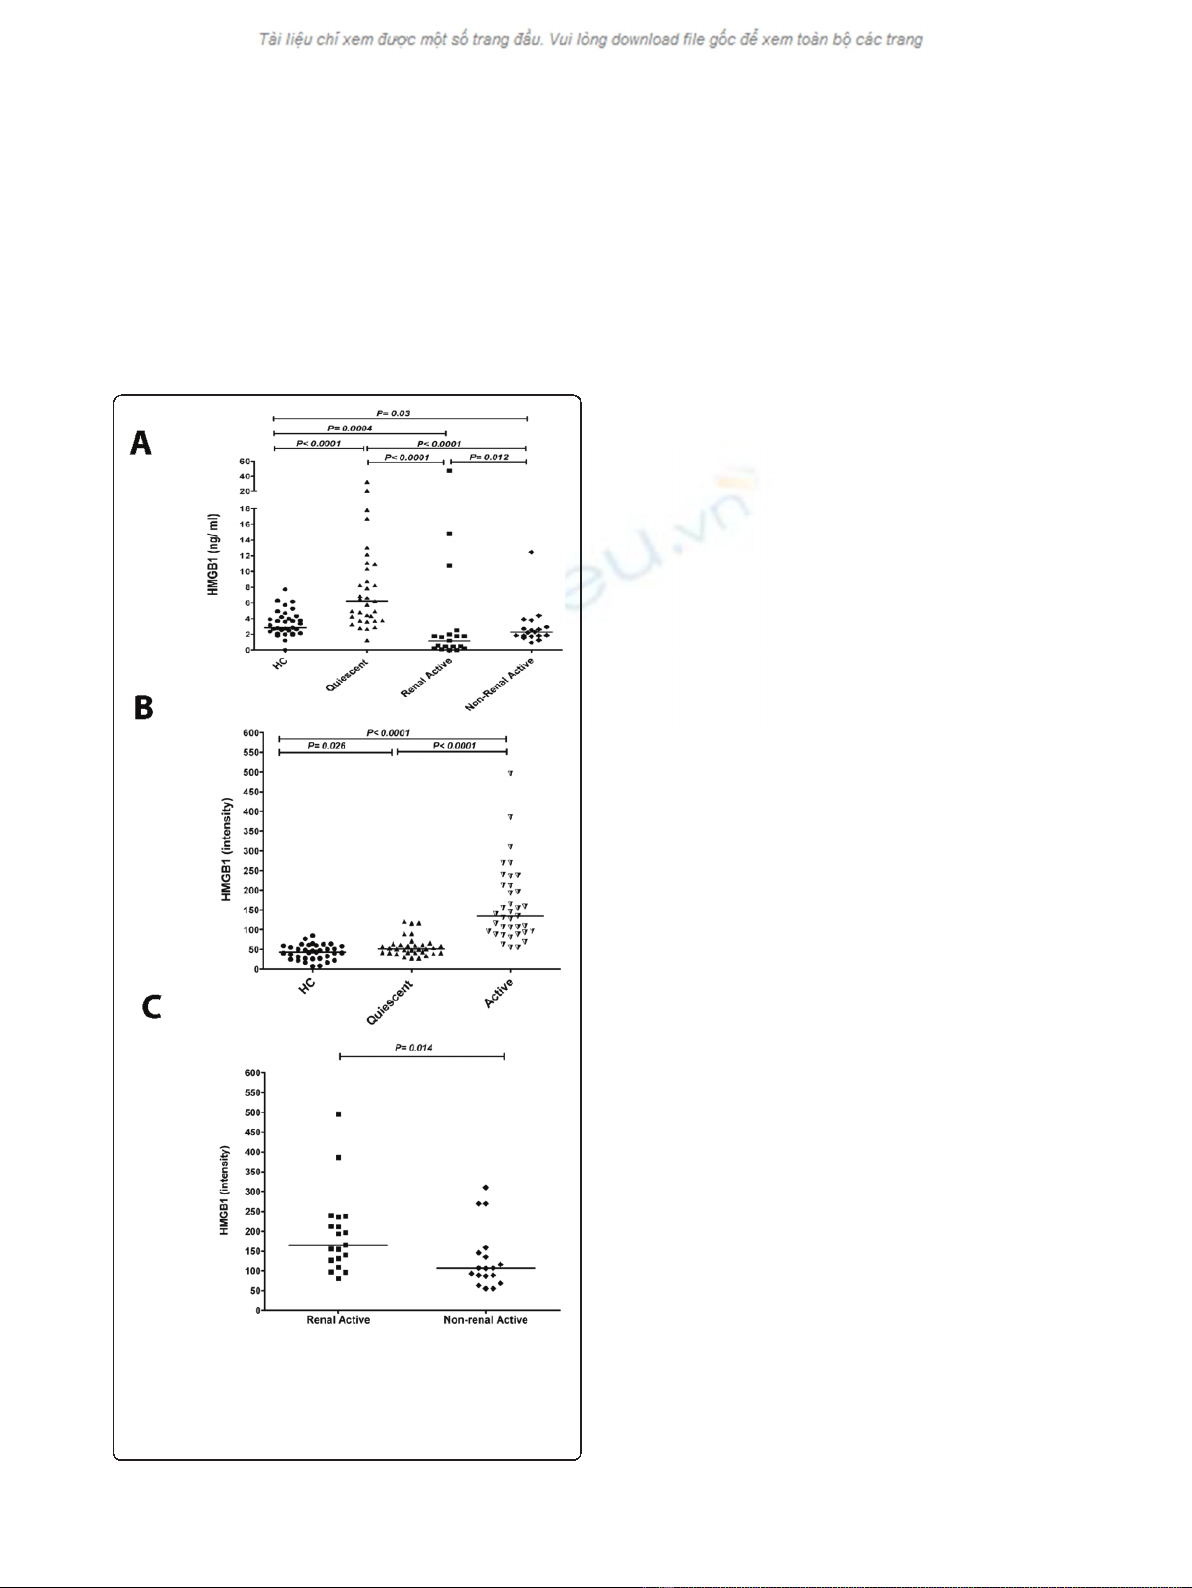
effect of immune complex formation. To confirm the
interference of immune complexes with the detection of
serum HMGB1 by ELISA, we depleted IgG from serum
of patients using a protein G column. HMGB1 levels
decreased when serum was depleted of IgG indicating
that serum HMGB1, at least in part, is present in
immune complexes which are not detected using ELISA
(Figure 2). However, due to denaturation and high
temperatures in Western blotting, immune complexes
are dissociated and the HMGB1 band exists of free and
previously complexed HMGB1.
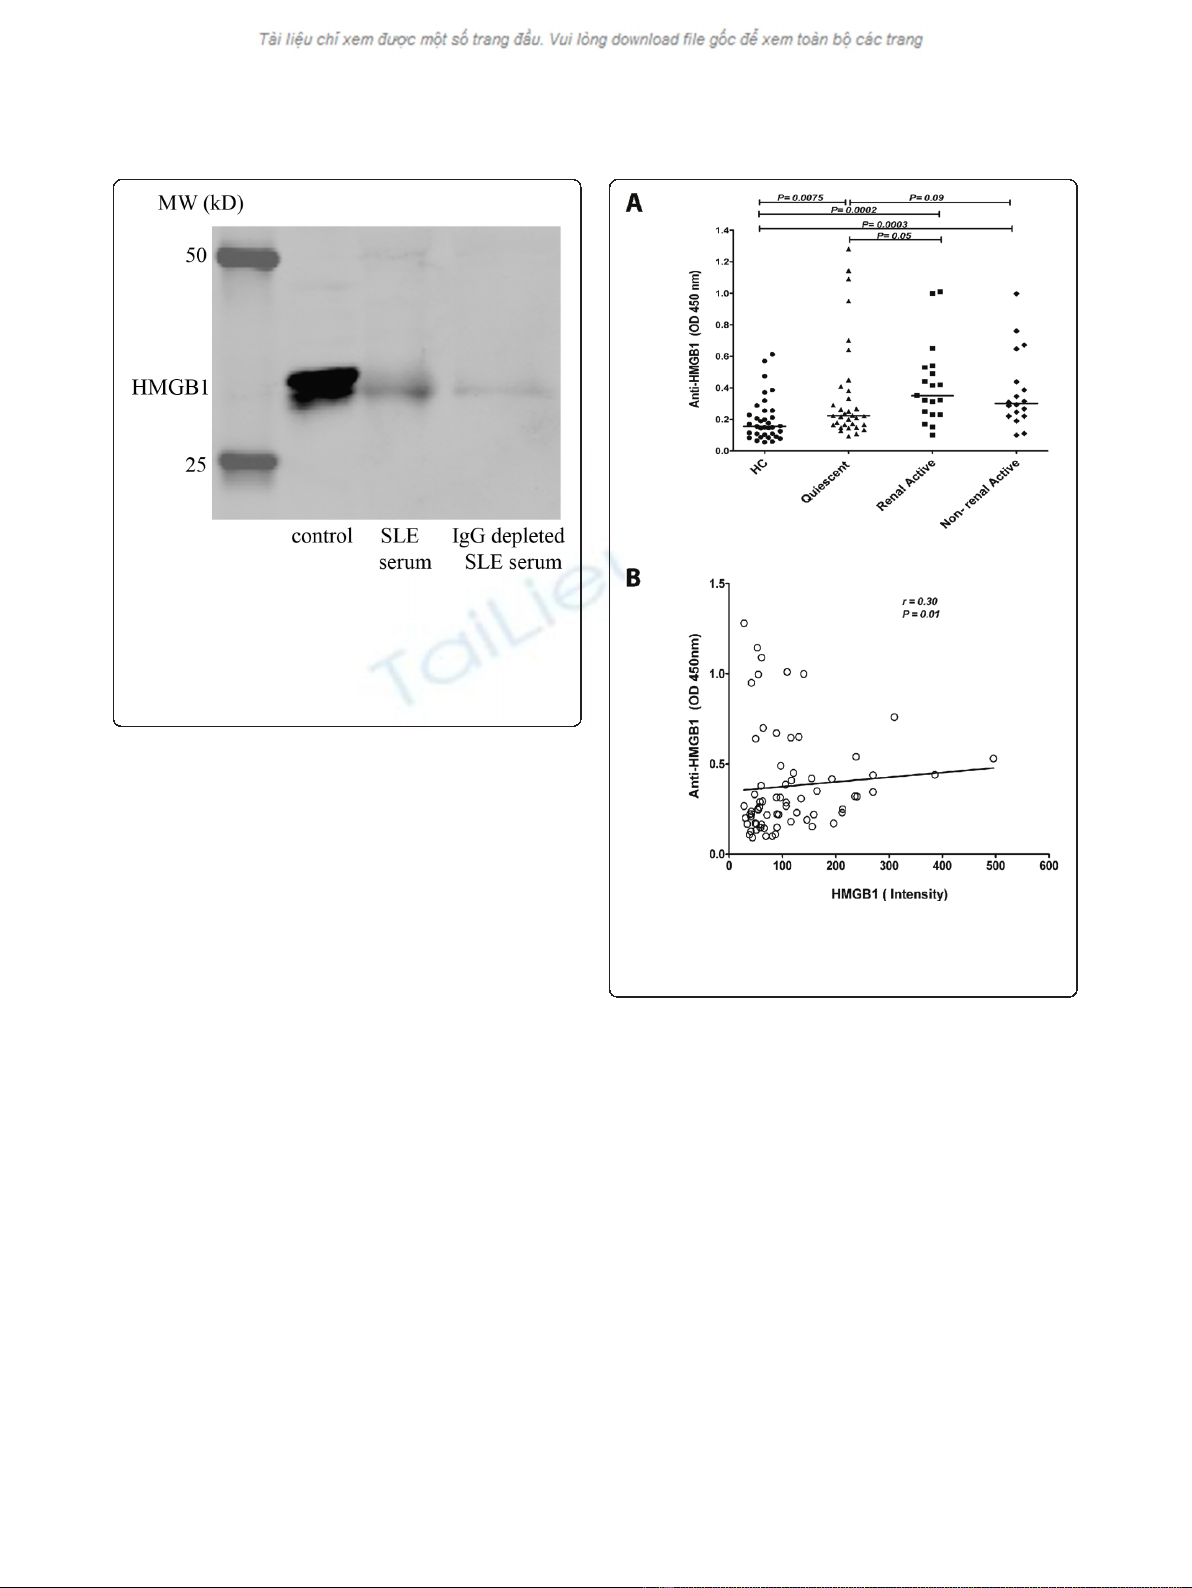
Antibodies against HMGB1
In-house developed ELISA levels of antibodies against
HMGB1 were measured in healthy controls and in SLE
patients. Anti-HMGB1 levels were significantly increased
in quiescent SLE patients (0.22, (0.09 to 1.30)) compared
to HC (0.16 (0.05 to 0.61). In patients with renal (0.35,
(0.10 to 1.01)) and non-renal 0.30, (0.10 to 0.99))
manifestations during active periods of the disease, anti-
HMGB1 levels were significantly increased in compari-
son to HC. Anti-HMGB1 levels were significantly higher
in active patients compared to quiescent patients
(Figure 3A). In addition, there was a positive correlation,
albeit weak, between levels of HMGB1 and anti-HMGB1
antibodies in the total patient group (P=0.018,r=0.28)
(Figure 3B).
Correlations of HMGB1 and anti-HMGB1 antibody levels
with clinical and serological findings
As HMGB1 might be a marker of certain disease activity
in SLE we evaluated whether levels of HMGB1 and anti-
bodies against HMGB1 were associated with clinical and
serological parameters in SLE patients. Analysing data of
the total group of patients we observed a correlation
between HMGB1 levels and SLEDAI (P< 0.0001, r = 0.57)
(Figure 4A). Also, anti-HMGB1 levels showed a significant
Figure 1 HMGB1 concentrations in sera from SLE patients and
healthy controls (HC).A) Serum HMGB1 levels in SLE patients and
HC using ELISA. Horizontal lines represent the median. B) Serum
HMGB1 levels of SLE patients and HC measured by Western blot.
C) HMGB1 levels measured by Western blot in active patients with
renal manifestations and with those without renal manifestations.
Abdulahad et al.Arthritis Research & Therapy 2011, 13:R71
http://arthritis-research.com/content/13/3/R71
Page 4 of 9
correlation with SLEDAI (P= 0.013, r = 0.30) (Figure 4B).
HMGB1 levels correlated with anti-dsDNA (P= 0.0006,
r = 0.40). Similarly, anti-HMGB1 antibodies showed a
correlation with anti-dsDNA levels (P= 0.003, r = 0.35)
(Figure 5A, B). Complement proteins are involved in the
pathogenesis of SLE and are considered biomarkers for
disease activity. Therefore, we investigated the correlation
of these factors with HMGB1 and anti-HMGB1 levels.
We observed a negative correlation in the total SLE
group between C3, C4 and HMGB1 (P =0.002,r=-0.36
and P< 0.05, r = -0.23 respectively) (Figure 5C, E). Also,
anti-HMGB1 antibodies showed a significant negative
correlation with C3 and C4 (P= 0.0035, r = -0.35and
P= 0.03, r = -0.26 respectively) (Figure 5D, F).
Finally, we assessed whether HMGB1 was related to
kidney involvement. No correlation was observed between
levels of HMGB1 and creatinine, nor with estimated
Glomerular Filtration Rate (eGFR) (data not shown). How-
ever, in the 33 patients with proteinuria, a correlation was
found between HMGB1 levels and the amount of protei-
nuria (P= 0.0001, r = 0.53) (Figure 6).
Discussion
In this study we showed that both HMGB1 levels and
anti-HMGB1 levels are increased in SLE patients, and
are related to SLE disease activity scores and serological
measures of disease activity [24-26,29]. Recent studies
showed increased levels of serum HMGB1 and anti-
HMGB1 in several autoimmune diseases including SLE.
However, the relation between levels of HMGB1 and
anti-HMGB1 antibodies has not been evaluated in a
large group of SLE patients. We measured serum
HMGB1 using two methods, ELISA and Western blot.
The ELISA kit used in this study has been used to
detect serum HMGB1 levels mainly in other chronic
inflammatory diseases [30,31]. Urbonaviciute et al.
showed that there was a discrepancy in serum/plasma
HMGB1 results obtained from their in-house developed
ELISA and Western blot in SLE patients due to possible
interference of HMGB1-binding antibodies and uniden-
tified serum proteins with HMGB1 [32]. Indeed, we
could show that IgG depletion decreased the amount of
HMGB1 in sera from lupus patients, suggesting that at
least part of HMGB1 is complexed with anti-HMGB1
antibodies. In this study prevalence of serum HMGB1 in
patients obtained by ELISA were low in accordance with
Ma et al., who also detected serum HMGB1 levels by
Figure 2 Serum HMGB1 after IgG depletion. HMGB1 levels are
decreased in serum depleted of IgG from an SLE patient. The first
lane represents the standard control consisting of human
keratinocyte HaCaT cells; the second lane represents the HMGB1
amount in the serum of a SLE patient before IgG depletion and in
the third lane the HMGB1 amount after IgG depletion in the serum
of same patient is shown.
Figure 3 Anti-HMGB1 levels in SLE patients and their relation
to HMGB1.A) Anti-HMGB1 levels in SLE patients compared to HC.
Horizontal lines represent the levels expressed as median. B) Positive
correlation between levels of HMGB1 and anti-HMGB1 antibodies.
Abdulahad et al.Arthritis Research & Therapy 2011, 13:R71
http://arthritis-research.com/content/13/3/R71
Page 5 of 9


