
RESEARC H Open Access
Increase in markers of airway inflammation after
ozone exposure can be observed also in stable
treated asthmatics with minimal functional
response to ozone
Barbara Vagaggini, Maria Laura E Bartoli, Silvana Cianchetti, Francesco Costa, Elena Bacci, Federico L Dente,
Antonella Di Franco, Laura Malagrinò, Pierluigi Paggiaro
*
Abstract
Background: The discrepancy between functional and inflammatory airway response to ozone has been reported
in normal subjects, but few data are available for stable asthmatics regularly treated with inhaled corticosteroids.
Methods: Twenty-three well controlled, regularly treated, mild-to-moderate asthmatic patients underwent two
sequential randomised exposures to either filtered air or ozone (0.3 ppm for 2 hours) in a challenge chamber.
Pulmonary function (PF) was monitored, and patients with FEV1 decrease greater than 10% from pre-challenge
value were considered as responders. Immediately after each exposure, exhaled breath condensate (EBC) was
collected to measure malondialdehyde (MDA). Six hours after each exposure, PF and EBC collection were repeated,
and sputum was induced to measure inflammatory cell counts and soluble mediators (IL-8 and neutrophil
elastase). The response to ozone was also evaluated according to the presence of polymorphism in oxidative stress
related NQO1 and GSTM1 genes.
Results: After ozone exposure, sputum neutrophils significantly increased in responders (n = 8), but not in
nonresponders (n = 15). Other markers of neutrophil activation in sputum supernatant and MDA in EBC
significantly increased in all patients, but only in nonresponders the increase was significant. In nonresponders,
sputum eosinophils also significantly increased after ozone. There was a positive correlation between ozone-
induced FEV1 fall and increase in sputum neutrophils. No difference in functional or inflammatory response to
ozone was observed between subjects with or without the combination of NQO1wt-GSTM1null genotypes.
Conclusions: Markers of neutrophilic inflammation and oxidative stress increase also in asthmatic subjects not
responding to ozone. A greater functional response to ozone is associated with greater neutrophil airway
recruitment in asthmatic subjects.
Background
Ozone is a potent oxidant known to induce a variety of
respiratory effects, including cough, increased airway
reactivity, decrease in lung function and neutrophilic
airway inflammation [1]. Recent evidence supports a
role for environmental chronic exposure to ozone in the
development of asthma and in triggering asthma attacks
[2,3]. Ozone exposure imposes an oxidative burden on
the lung both by directly oxidizing biomolecules, thereby
generating reactive oxygen species (ROS), and by indu-
cing inflammatory mediator production and release,
with activation of inflammatory cells and further release
of ROS [4]; this process causes acute and chronic airway
damage, which results in bronchoconstriction and bron-
chial hyperresponsiveness [5].
Many studies have reported an increase in markers of
neutrophilic activation in induced sputum or in bronch-
oalveolar lavage (BAL) after ozone exposure in healthy
ad asthmatic subjects [6,7], as well as an increase in
markers of oxidative stress in lung tissue and BAL fluid
* Correspondence: lpaggiaro@dcap.med.unipi.it
Cardio-Thoracic and Vascular Department, University of Pisa, Pisa, Italy
Vagaggini et al.Respiratory Research 2010, 11:5
http://respiratory-research.com/content/11/1/5
© 2010 Vagaggini et al; licensee BioMed Central Ltd. This is an Open Access article distributed under the terms of the Creative
Commons Attribution License (http://creativecommons.org/licenses/by/2.0), which permits unrestricted use, distribution, and
reproduction in any medium, provided the original work is properly cited.

of animals exposed to high ozone concentrations [8].
There is, however, considerable interindividual variabil-
ity in the magnitude of pulmonary response, both in
terms of functional and inflammatory reaction to ozone
exposure, with a large proportion of subjects showing
no significant change in airway calibre after controlled
experimental ozone exposure in laboratory [9]. No spe-
cific determinants of poor functional response to ozone
have been demonstrated, apart from age and levels of
exposure [10,11]. Most experimental studies in humans
have reported no correlation between functional
response and severity of inflammatory response mea-
sured in induced sputum or bronchoalveolar lavage fluid
[12-14]. In particular, very few data have been reported
in asthmatic subjects.
In humans, increased levels of malondialdehyde and 8-
isoprostane have been measured in breath condensate
after O3 exposure [15,16].
Polymorphism of two oxidative stress related enzymes,
Glutathione-S-Transferase M1 (GSTM1) and NAD(P)H:
quinone oxidoreductase (NQO1), has been associated
with an increased susceptibility to ozone exposure
injury. There are studies showing that the deleted form
of Glutathione-S-Transferase M1 enzyme (GSTM1 null),
resulting in a complete lack of its enzymatic function,
associated with the pro187 form of NAD(P)H:quinone
oxidoreductase (NQO1) enzyme, induces greater acute
airway and inflammatory responses to ozone [17,18].
The aim of our study was to evaluate the effects of
ozone exposure on functional and inflammatory airway
responses in 23 mild-to-moderate, stable asthmatic sub-
jects, regularly treated with inhaled corticosteroids. We
and other authors have demonstrated that inhaled or
oral corticosteroids can blunt neutrophilic airway
inflammatory response to ozone in asthmatics [19-21],
but have little effect on airway calibre. Therefore, we
would like to verify whether, in asthmatic subjects regu-
larly treated with inhaled corticosteroids, a dissociation
between functional and inflammatory airway response to
ozone can be observed.
Subjects and methods
Subjects
We selected 23 nonsmoking, mild-to-moderate stable
asthmatic subjects, regularly treated with inhaled corti-
costeroids (median daily dose: 500 μgofBDP-equiva-
lent, range: 200-1000), associated with long-acting
beta2-agonists in 19 out of 23 subjects, all aged under
50 years. Asthma severity and level of control were
assessed according to International Guidelines [22]. All
subjects were in stable phase of disease and had had no
upper respiratory tract infection or acute asthma exacer-
bation in the last 4 weeks. Asthma treatment was with-
drawn 24 hrs before each exposure. Main characteristics
of examined subjects are reported in Table 1.
Study design
On two different days, at least 2 weeks apart, all subjects
were randomly exposed to either ozone (0.3 ppm) or fil-
tered air for 2 hours in a challenge chamber, while
excercising on a cycloergometer. Before and after each
exposure, they underwent pulmonary function test
(PFT), collected exhaled breath condensate (EBC) and
measured nitric oxide levels in exhaled air (eNO). Six
hours after the end of the exposure, PFT, EBC collec-
tion, eNO measurements were repeated, and hypertonic
saline (HS)-induced sputum was collected.
The study protocol was approved by the local Univer-
sity Ethic Committe, and an informed consent was
obtained by each patient before entering in the study.
Subjects were divided in responders and nonrespon-
ders according to their responsiveness to ozone, cor-
rected by the changes in airway calibre after exposure to
air. Airway responsiveness to ozone was defined as the
difference between FEV
1
values (L) measured after O
3
and after air exposure (ΔFEV
1O3-Air
), according to the
following formula:
FEV FEV pre O L FEV post O L
FEV pre O L
OAir13
13 1 3
13
10
() ()
() 00 11
1
100
FEV pre air L FEV post air L
FEV pre air L
() ()
()
Subjects with ΔFEV
1O3-Air
greater than 10% were
considered as “responders”[12].
Table 1 Characteristics of the asthmatic subjects examined
All subjects Responders Nonresponders
Number 23 8 15
Age, yrs (M ± SD) 32.6 ± 10.8 31.1 ± 13.2 33.4 ± 9.8
Sex (Male/Female) 13/10 6/2 7/8
Atopy (yes/no) 17/6 5/3 12/3
Smoking habit (yes/ex/no) 0/5/18 0/2/6 0/3/12
FEV1, % predicted (M ± SD) 96.9 ± 12.0 93.4 ± 15.9 98.8 ± 9.4
PD20FEV1 meth, mg (GM) 0.263 0.366 0.218
ICS, μg/d (median, range) 500(200-1000) 500(250-1000) 500(200-1000)
FEV1:Forced expiratory volume in one second ; M ± SD: mean ± standard deviation; GM: geometric mean. PD20FEV1 meth: cumulative dose of methacoline
provoking a 20% decrease in FEV1 from baseline value; ICS: Inhaled corticosteroids.
Vagaggini et al.Respiratory Research 2010, 11:5
http://respiratory-research.com/content/11/1/5
Page 2 of 9

Venous blood was taken before the first exposure, to
evaluate the genotypic combination of NAD(P)H:qui-
none oxidoreductase (NQO1) and Glutathione-S-Trans-
ferase M1 (GSTM1) enzymes. Functional and
inflammatory airway responses of subjects bearing both
NQO1wt and GSTM1null genotypes were compared
with those of the other genotypic combinations.
Challenge chamber
All subjects were exposed to ozone for 120 min in a 9-
m
3
static challenge chamber made of glass and alumi-
nium [19], while exercising on a stationary cycloerg-
ometer at work load predetermined to produce a
ventilation rate of 25 L/min/m
2
of body surface area for
twenty min every hour. Ozone was generated by a cor-
ona discharge O
3
-generator (Rancon Instruments SpA,
Milano, Italy) connected to a cylinder of purified air.
Ozone output into the chamber was 0.5 L/min. An O
3
-
analyser (Photometric O
3
Analyser 400, Rancon Instru-
ments SpA, Milano, Italy) connected to the chamber by
a tubing circuit, continuously monitored gas concentra-
tion. Mean ozone concentration was maintained at
about 0.3 ppm throughout the exposure. A fan in the
chamber ensured adequate gas mixing and circulation.
Sputum induction and processing
Hypertonic saline solution (NaCl 4.5%) was nebulized
with an ultrasonic nebulizer (2.8 ml/min output; Sirius,
Technomed, Firenze, Italy) and inhaled for three 5-min-
ute periods, for up to 15 min. Every 5 min after the
start of nebulization, patients were asked to carefully
rinse their mouth and throat in order to discard saliva
and to try to cough sputum into a clean container;
FEV1 was then measured. Nebulization was stopped
after 15 min or when FEV1 fell by 20% or more from
baseline values.
Sputum samples were processed within 2 h from col-
lection, and more viscid and denser portions were
selected and processed as previously described [23].
Briefly, samples were homogenized by adding 0.1%
dithiothreitol in a shaking bath at 37° C for 15 min and
centrifuged to separate cells from supernatant. Superna-
tant was stored at -80°C for further analysis. The cell
pellet was resuspended in phosphate-buffered saline for
viability test and total cell count; aliquots were cytocen-
trifuged (Cytospin; Shandon Scientific, Sewickley, PA,
USA) to prepare slides for differential cell counts. At
least 300 inflammatory cells were counted. Macrophage,
lymphocyte, neutrophil, eosinophil values were
expressed as percent of total inflammatory cells.
Slides with cell viability < 50% or with an amount of
squamous cells such that 300 inflammatory cells could
not be counted were considered inadequate and dis-
carded. Our reproducibility for sputum inflammatory
cell counts was previously assessed and excluding lym-
phocytes (RI: 0.23), was considered as satisfactory: RI
was 0.90 for macrophages, 0.88 for neutrophils, 0.82 for
eosinophils [24].
Exhaled breath condensate (EBC) collection
EBC was collected by cooling exhaled air with a specifi-
cally designed condenser (Ecoscreen, Jaeger, Wurzburg,
Germany). Subjects breathed tidally for 15 min through
a two-way non-rebreathing valve in order to prevent
inspiratory and espiratory air mixing and saliva trapping
[25]. The condensate thus obtained was immediately
stored at -30°C for further analysis.
Exhaled Nitric Oxide (eNO) measurement
NO was measured in exhaled air using a Nitric Oxide
Analyzer (Sievers NOA 280, Boulder, CO, USA). Under
visual feedback, patients performed a single slow exhala-
tion (30-45 sec) from total lung capacity through a resis-
tance, keeping a constant expiratory flow of about 50 L/
min; eNO concentration at mouth level was recorded
throughout expiration. At least three acceptable man-
oeuvres with eNO variability lower than 10% were
obtained, and the mean value was considered.
Biochemical analysis
Cytokines and neutrophilic biomarkers
Sputum supernatant IL-8 levels were measured with a
commercially available enzyme immunoassay (Euro-
clone, Milano, Italy) according to manufacturer’s recom-
mended protocol. The detection limit of the assay was
0.0625 ng/ml. The percentage of recovery, evaluated in
10 different samples, was 89.4%. Intra- and inter-assay
coefficients of variation were 4.7% and 7.5%, respectively
[26].
Sputum Neutrophilic Elastase activity (NE) in induced
sputum supernatant was measured spectrophotometri-
cally using the synthetic substrate methoxysuccinyl-ala-
ala-pro-val-paranitroanilide (MeOSAAPVpNa) (Sigma
ALDRICH Company Ltd. Poole, Dorset, UK). Activity
was measured by assessing the change in absorbance at
410 nm on a microplate reader, and quantified by extra-
polation from a standard curve of pure NE. The detec-
tion limit of the method was 6 ng/ml. Intra- and inter-
assay coefficients of variation were 5.6% and 12% respec-
tively. NE recovery, measured in 28 samples, was greater
than 80% [26].
Oxidative stress biomarkers
Malondialdehyde (MDA) concentrations were measured
in sputum supernatant and EBC samples according to
the method described by Larstad et al [27]. Briefly, sam-
ples were derivatised with tiobarbituric acid and then
measured by means of High Performance Liquid Chro-
matography with fluorescence detector (HPLC; Binary
HPLC pump 1525 and 2475 multi lfluorescence detec-
tor, Waters, Milano, Italy), using excitation and emission
wavelenghts of 532 and 553nm respectively. Our detec-
tion limit was 0.006 μm/L, the intra- and inter-assay
Vagaggini et al.Respiratory Research 2010, 11:5
http://respiratory-research.com/content/11/1/5
Page 3 of 9

reproducibility were 0.9 and 10.4% respectively and the
recovery 96%.
Genotypic characterization
GSTM1 and NQO1 genotypes were characterized by
molecular biology techniques, using genomic DNA
extracted with Nucleon BACC2 (Amersham Interna-
tional plc, Little Chalfont, Buckinghamshire, UK) from
peripheral blood after buffy-coat enrichment, according
to the procedures described elsewhere [17].
Statistical analysis
Functional data are expressed as mean ± standard devia-
tion, and compared between groups using unpaired Stu-
dent’s t-test. Comparison between repeated
measurements in the same group was performed using
ANOVA test. Inflammatory markers are expressed as
median and range, and compared between groups using
Mann-Whitney U test. The correlation between FEV
1
response to ozone and O
3
-air changes in inflammatory
markers has been evaluated using Spearman’srankcor-
relation coefficient. A p value lower than 0.05 has been
considered as significant.
Results
Eight (34.7%) of the 23 subjects studied were defined as
responders to ozone. No difference was found between
responders and nonresponders for the main baseline
characteristics (Table 1). Six subjects (26%) had the
NQO1wteGSTM1null genotypic combination.
Functional response
Mean values of FEV
1
, FVC and VC at different time-
points during exposures to air or ozone, divided into
responders and nonresponders, are reported in Table 2.
No difference in baseline values (expressed either as
percentage or as absolute value) was found between
ozone and air challenges in both groups. As expected, in
addition to FEV
1
decrease, responders also showed sig-
nificant decrease in FVC and VC at the end of ozone
exposure in comparison with pre-ozone exposure values,
with complete recovery by 6 h after exposure. However,
nonresponders showed mild but significant reduction in
FEV
1
,FVCandVCattheendofozoneexposureonly
when compared with after air exposure.
There was no difference in functional response to
ozone challenge between subjects bearing NQO1wt and
GSTM1null genotypes and subjects bearing different
genotypic combinations (ΔFEV1%
O3-Air
: 3.75 ± 5.83 vs
1.54 ± 13.26 %, ns).
Inflammatory response
Inflammatory findings of the study subjects, grouped in
responders and nonresponders, are reported in Table 3.
Two subjects did not collect adequate sputum samples
or breath condensate in at least one occasion, and they
were thus excluded from analysis.
After ozone exposure, sputum neutrophils significantly
increased in responders, but not in nonresponders. Spu-
tum IL-8 and NE did not show any significant increase
in responders (p = 0.13 and p = 0.15 respectively), while
in nonresponders IL-8 and NE increased after ozone
exposure, although the increase in NE was only close to
the statistical significance.
When the difference between sputum neutrophil per-
centage after ozone and after air for each subject (ΔN
%) was considered, a significantly higher value was
observed in responders than in nonresponders (15.2
[-1.3, 64.5] vs 0.15 [-21,2, 52.5] %, p < 0.05).
Sputum eosinophils (both in absolute and percent
value) after ozone exposure were significantly higher
than after air exposure only in nonresponders.
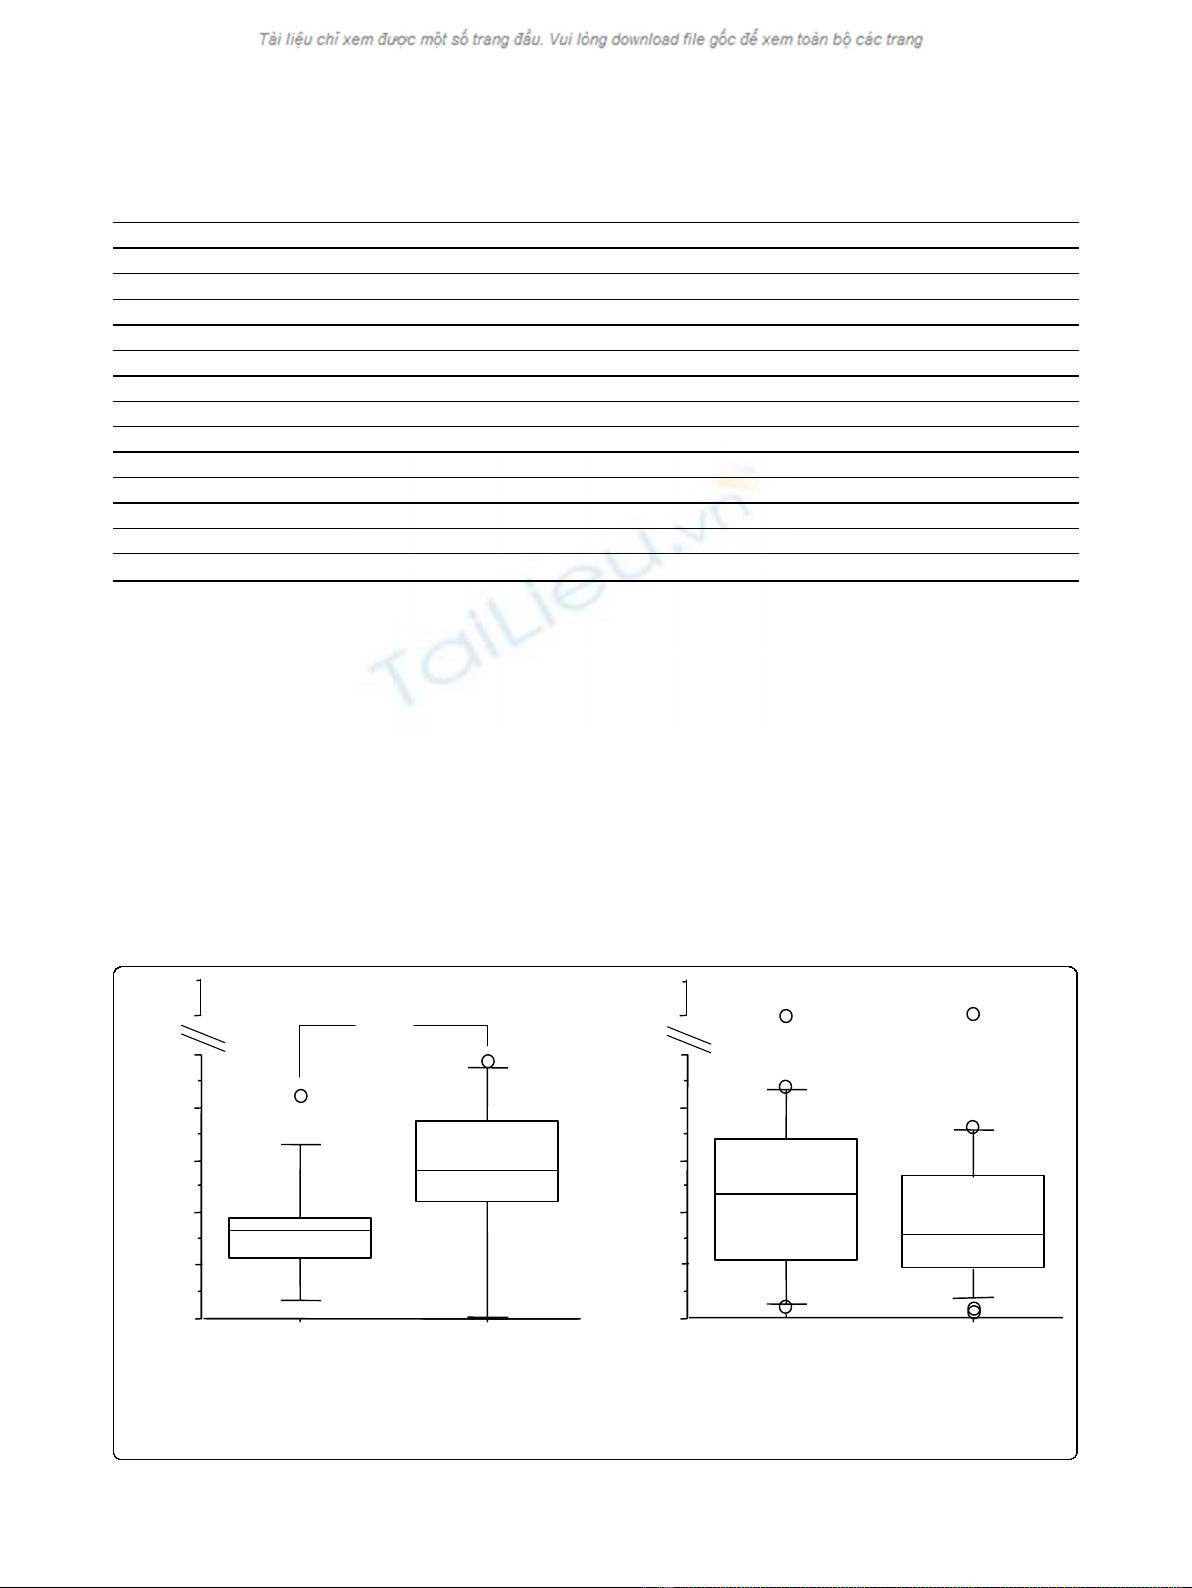
When all subjects were considered together, MDA
levels in EBC were significantly higher immediately after
ozone exposure, in comparison with air, but not 6 hours
later (Figure 1). When subjects were grouped according
to their functional response to ozone, MDA concentra-
tions in EBC increased from baseline in both groups,
but the difference was significant only in nonresponders
(Figure 2).
Nitric oxide (eNO) levels in exhaled air were above
normal value (20 ppb) in 13 out of 23 asthmatic subjects
(mean values: 33.7 ± 29.9 ppb and 34.1 ± 29.7 ppb
before air and ozone exposure respectively) and did not
significantly change immediately and 6 hours after either
air or ozone exposures.
No difference in the inflammatory response to ozone
exposure was found between subjects bearing NQO1wt
and GSTM1null genotypes and subjects bearing differ-
ent genotypic combinations.
Table 2 FVC, VC and FEV1 measured at different time-
points before and after exposure to air or ozone, in
responders and nonresponders
Responders (n = 8) Nonresponders (n = 15)
Air Ozone Air Ozone
FVC bas 4.65 ± 0.78 4.70 ± 0.63 4.69 ± 0,97 4.56 ± 1.00
FVC 2h 4.69 ± 0.75 4.38 ± 0.79§# 4.63 ± 0.93 4.52 ± 0.93§#
FVC 6h 4.69 ± 0.84 4.61 ± 0.79 4.67 ± 0.99 4.56 ± 1.00
VC bas 4.60 ± 0.79 4.69 ± 0.70 4.60 ± 0.99 4.55 ± 0.99
VC 2h 4.67 ± 0.75 4.43 ± 0.80§# 4.67 ± 0.96 4.49 ± 0.89
VC 6h 4.64 ± 0.83 4.56 ± 0.77 4.72 ± 0.99 4.54 ± 1.04§
FEV1 bas 3.59 ± 0.76 3.73 ± 0.62 3.55 ± 0.86 3.41 ± 0.88
FEV1 2h 3.79 ± 0.72 3.40 ± 0.57§# 3.60 ± 0.88 3.52 ± 0.81§
FEV1 6h 3.80 ± 0.75 3.59 ± 0.58 3.69 ± 0,96 3.50 ± 0.87§
FEV1:Forced expiratory volume in one second; FVC: Forced vital capacity; VC:
Vital capacity. # p < 0.05 from baseline values; §: p < 0.05 from air at the
same time point. Data are expressed as mean ± SD.
Vagaggini et al.Respiratory Research 2010, 11:5
http://respiratory-research.com/content/11/1/5
Page 4 of 9
Relationship between functional and biological data
Considering all the subjects together, a significant corre-
lation was found between ΔFEV1%
O3-Air
and ozone-air
difference sputum neutrophil percentages (ΔN%) (Fig-
ure 3). No significant correlation was observed between
changes in FEV1 and the ozone-air difference of the
other inflammatory markers studied.
No correlation was observed between O3-air changes
in MDA immediately after exposure and changes in spu-
tum neutrophils 6 hours after exposure.
After ozone exposure, a positive correlation was found
between neutrophil counts (cells/ml) and NE (p = 0.01,
rho = 0.6) and IL-8 levels (p = 0.03, rho = 0.6) in
induced sputum.
Discussion
The main result of this study was that some asthmatic
subjects defined as “nonresponders”showed however an
increase in airway markers of neutrophilic inflammation
and oxidative stress, thus suggesting that they are none-
theless sensitive to the effect of ozone. In nonrespon-
ders, eosinophils (but not neutrophils) and IL-8 in
sputum and MDA in exhaled breath condensate
increased after ozone exposure, despite clinically
0
20
40
60
80
100
0
20
40
60
80
100
AIR OZONE
MDA (nM)
Post exposure
AIR OZONE
6h post exposure
*
160
160
MDA (nM)
Figure 1 MDA in EBC immediately and 6 hours after ozone/air exposure in all subjects (responders plus nonresponders); *p < 0,05.
Table 3 Inflammatory cells and soluble mediators in induced sputum after either air or ozone exposure, in subjects
grouped according to functional response to ozone exposure
Responders (n = 8) Nonresponders (n = 13)
Air Ozone Air Ozone
Infamm. cells/ml (10
6
) 2.6(1.5-5.7) 3.6(1.2-10.8) 2.1(0.2-6.8) 3.1(0.7-14.0)
Macrophages/ml (10
6
) 0.9(0.3-2.2) 1.4(0.3-3.2) 0.8(0.1-2.5) 0.9(0.4-10)
Lymphocytes/ml (10
6
) 0.03(0-0.3) 0.09(0-0.4) 0.02(0-0.1) 0.02(0-0.1)
Neutrophils/ml (10
6
) 0.7(0.2-2.0) 1.7(0.5-9.2)§ 0.6(0-6.3) 0.8(0.1-7.0)
Eosinophils/ml (10
6
) 0.09(1-1.9) 0.02(0-0.6) 0.02(0-1.7) 0.4(0-1.6) #§
Macrophages (%) 40.4(8-89) 34.3(8-77) 51.1(6-85) 48.2(2-75)
Lymphocytes (%) 1.5(1-6) 1.4(0-14) 0.6(0-5) 0.8(0-5)
Neutrophils (%) 28.2(8-79) 55.4(23-90)§ 41.0(0-93) 30.9(6-98)
Eosinophils (%) 2.8(0-55) 0.2(0-11) 0.3(0-63) 11.6(0-45)#§
NE (ng/mL) 0.7(0-6) 2.1(0-9) 1.2(0-5) 1.5(0-6.5)
NE rec.(%) 42(1-61) 59(34-83) 41(9-62) 60(33-78) ^
IL-8 (ng/mL) 22.9(10-44) 36.3(3-62) 11.8(6-72) 26.3(3-94) §
Inflamm.: inflammatory; NE: neutrophil elastase; NE rec: NE recovery; IL-8: interleukin 8. Data are expressed as median (range). §:p < 0.05 from air exposure; ^ p =
0.056 from air exposure; #:p < 0.05 from responders.
Vagaggini et al.Respiratory Research 2010, 11:5
http://respiratory-research.com/content/11/1/5
Page 5 of 9


