
RESEARC H Open Access
Sequence and structure of Brassica rapa
chromosome A3
Jeong-Hwan Mun
1*†
, Soo-Jin Kwon
1†
, Young-Joo Seol
1
, Jin A Kim
1
, Mina Jin
1
, Jung Sun Kim
1
, Myung-Ho Lim
1
,
Soo-In Lee
1
, Joon Ki Hong
1
, Tae-Ho Park
1
, Sang-Choon Lee
1
, Beom-Jin Kim
1
, Mi-Suk Seo
1
, Seunghoon Baek
1
,
Min-Jee Lee
1
, Ja Young Shin
1
, Jang-Ho Hahn
1
, Yoon-Jung Hwang
2
, Ki-Byung Lim
2
, Jee Young Park
3
,
Jonghoon Lee
3
, Tae-Jin Yang
3
, Hee-Ju Yu
4
, Ik-Young Choi
5
, Beom-Soon Choi
5
, Su Ryun Choi
6
, Nirala Ramchiary
6
,
Yong Pyo Lim
6
, Fiona Fraser
7
, Nizar Drou
7
, Eleni Soumpourou
7
, Martin Trick
7
, Ian Bancroft
7
, Andrew G Sharpe
8
,
Isobel AP Parkin
9
, Jacqueline Batley
10
, Dave Edwards
11
, Beom-Seok Park
1*
Abstract
Background: The species Brassica rapa includes important vegetable and oil crops. It also serves as an excellent
model system to study polyploidy-related genome evolution because of its paleohexaploid ancestry and its close
evolutionary relationships with Arabidopsis thaliana and other Brassica species with larger genomes. Therefore, its
genome sequence will be used to accelerate both basic research on genome evolution and applied research
across the cultivated Brassica species.
Results: We have determined and analyzed the sequence of B. rapa chromosome A3. We obtained 31.9 Mb of
sequences, organized into nine contigs, which incorporated 348 overlapping BAC clones. Annotation revealed
7,058 protein-coding genes, with an average gene density of 4.6 kb per gene. Analysis of chromosome collinearity
with the A. thaliana genome identified conserved synteny blocks encompassing the whole of the B. rapa
chromosome A3 and sections of four A. thaliana chromosomes. The frequency of tandem duplication of genes
differed between the conserved genome segments in B. rapa and A. thaliana, indicating differential rates of
occurrence/retention of such duplicate copies of genes. Analysis of ‘ancestral karyotype’genome building blocks
enabled the development of a hypothetical model for the derivation of the B. rapa chromosome A3.
Conclusions: We report the near-complete chromosome sequence from a dicotyledonous crop species. This
provides an example of the complexity of genome evolution following polyploidy. The high degree of contiguity
afforded by the clone-by-clone approach provides a benchmark for the performance of whole genome shotgun
approaches presently being applied in B. rapa and other species with complex genomes.
Background
The Brassicaceae family includes approximately 3,700 spe-
cies in 338 genera. The species, which include the widely
studied Arabidopsis thaliana, have diverse characteristics
and many are of agronomic importance as vegetables, con-
diments, fodder, and oil crops [1]. Economically, Brassica
species contribute to approximately 10% of the world’s
vegetable crop produce and approximately 12% of the
worldwide edible oil supplies [2]. The tribe Brassiceae,
which is one of 25 tribes in the Brassicaceae, consists of
approximately 240 species and contains the genus Bras-
sica. The cultivated Brassica species are B. rapa (which
contains the Brassica A genome) and B. oleracea (C gen-
ome), which are grown mostly as vegetable cole crops,
B. nigra (B genome) as a source of mustard condiment,
and oil crops, mainly B. napus (a recently formed allotetra-
ploid containing both A and C genomes), B. juncea (A and
B genomes), and B. carinata (B and C genomes) as
sources of canola oil. These genome relationships between
the three diploid species and their pairwise allopolyploid
* Correspondence: munjh@rda.go.kr; pbeom@rda.go.kr
†Contributed equally
1
Department of Agricultural Biotechnology, National Academy of Agricultural
Science, Rural Development Administration, 150 Suin-ro, Gwonseon-gu,
Suwon 441-707, Korea
Full list of author information is available at the end of the article
Mun et al.Genome Biology 2010, 11:R94
http://genomebiology.com/2010/11/9/R94
© 2010 Mun et al.; licensee BioMed Central Ltd. This is an open access article distributed under the terms of the Creative Commons
Attribution License (http://creativecommons.org/licenses/by/2.0), which permits unrestricted use, distribution, and reproduction in
any medium, provided the original work is properly cited.

derivative species have long been known, and are
described by ‘U’s triangle’[3].
B. rapa is a major vegetable or oil crop in Asia and
Europe, and has recently become a widely used model for
the study of polyploid genome structure and evolution
because it has the smallest genome (529 Mb) of the Bras-
sica genus and, like all members of the tribe Brassiceae,
has evolved from a hexaploid ancestor [4-6]. Our previous
comparative genomic study revealed conserved linkage
arrangements and collinear chromosome segments
between B. rapa and A. thaliana, which diverged from a
common ancestor approximately 13 to 17 million years
ago. The B. rapa genome contains triplicated homoeolo-
gous counterparts of the corresponding segments of the
A. thaliana genome due to triplication of the entire gen-
ome (whole genome triplication), which occurred approxi-
mately 11 to 12 million years ago [6]. Furthermore, studies
in B. napus, which was generated in the last 10,000 years,
have demonstrated that overall genome structure is highly
conserved compared to its progenitor species, B. rapa and
B. oleracea, which diverged approximately 8 million years
ago, but significantly diverged relative to A. thaliana at the
sequence level [7,8]. Thus, investigation of the B. rapa
genome provides substantial opportunities to study the
divergence of gene function and genome evolution
associated with polyploidy, extensive duplication, and
hybridization. In addition, access to a complete and high-
resolution B. rapa genome will facilitate research on other
Brassica crops with partially sequenced or larger genomes.
Despite the importance of Brassica crops in plant biol-
ogy and world agriculture, none of the Brassica species
have had their genomes fully sequenced. Cytogenetic
analyses have showed that the B. rapa genome is orga-
nized into ten chromosomes, with genes concentrated in
the euchromatic space and centromeric repeat sequences
and rDNAs arranged as tandem arrays primarily in the
heterochromatin [9,10]. The individual mitotic meta-
phase chromosome size ranges from 2.1 to 5.6 μm, with
a total chromosome length of 32.5 μm [9]. An alternative
cytogenetic map based on a pachytene DAPI (4’,6-diami-
dino-2-phenylindole dihydrochloride) and fluorescent
in situ hybridization (FISH) karyogram showed that the
mean lengths of ten pachytene chromosomes ranged
from 23.7 to 51.3 μm, with a total chromosome length of
385.3 μm [11]. Thus, chromosomes in the meiotic pro-
phase stage are 12 times longer than those in the mitotic
metaphase, and display a well-differentiated pattern of
bright fluorescent heterochromatin segments. Sequen-
cing of selected BAC clones has confirmed that the gene
density in B. rapa is similar to that of A. thaliana in the
order of 1 gene per 3 to 4 kb [6]. Each of the gene-rich
BAC clones examined so far by FISH (> 100 BACs) was
found to be localized to the visible euchromatic region of
the genome. Concurrently, a whole-genome shotgun
pilot sequencing of B. oleracea with 0.44-fold genome
coverage generated sequences enriched in transposable
elements [12,13]. Taken together, these data strongly
point to a tractable genome organization where the
majority of the B. rapa euchromatic space (gene space)
can be sequenced in a highly efficient manner by a clone-
by-clone strategy. Based on these results, the multina-
tional Brassica rapa Genome Sequencing Project
(BrGSP) was launched, with the aim of sequencing the
euchromatic arms of all ten chromosomes [14]. The pro-
ject aimed to initially produce a ‘phase 2 (fully oriented
and ordered sequence with some small gaps and low
quality sequences)’sequence with accessible trace files by
shotgun sequencing of clones so that researchers who
require complete sequences from a specific region can
finish them.
To support genome sequencing, five large-insert BAC
libraries of B. rapa ssp. pekinensis cv. Chiifu were con-
structed, providing approximately 53-fold genome cov-
erage overall [15]. These libraries were constructed
using several different restriction endonucleases to
cleave genomic DNA (EcoRI, BamHI, HindIII, and
Sau3AI). Using these BAC libraries, a total of 260,637
BAC-end sequences (BESs) have been generated from
146,688 BAC clones (approximately 203 Mb) as a colla-
borative outcome of the multinational BrGSP commu-
nity. The strategy for clone-by-clone sequencing was to
start from defined and genetically/cytogenetically
mapped seed BACs and build outward. Initially, a com-
parative tiling method of mapping BES onto the A.
thaliana genome, combined with fingerprint-based phy-
sical mapping, along with existing genetic anchoring
data provided the basis for selecting seed BAC clones
and for creating a draft tiling path [6,16,17]. As a result,
589 BAC clones were sequenced and provided to the
BrGSP as ‘seed’BACs for chromosome sequencing. Inte-
gration of seed BACs with the physical map provided
‘gene-rich’contigs spanning approximately 160 Mb.
These ‘gene-rich’contigs enabled the selection of clones
to extend the initial sequence contigs. Here, as the first
report of the BrGSP, we describe a detailed analysis of
B. rapa chromosome A3, the largest of the ten B. rapa
chromosomes, as assessed by both cytogenetic analysis
and linkage mapping (length estimated as 140.7 cM).
The A3 linkage group also contains numerous collinear-
ity discontinuities (CDs) compared with A. thaliana,a
recent study into which [18] revealed greater complexity
than originally described for the segmental collinearity
of Brassica and Arabidopsis genomes [19,20]. In accor-
dance with the agreed standards of the BrGSP, we
aimed to generate phase 2 contiguous sequences for
B. rapa chromosome A3. We annotated these sequences
Mun et al.Genome Biology 2010, 11:R94
http://genomebiology.com/2010/11/9/R94
Page 2 of 12
for genes and other characteristics, and used the data to
analyze genome composition and examine consequential
features of polyploidy, such as genome rearrangement.
Results and discussion
General features of chromosome A3
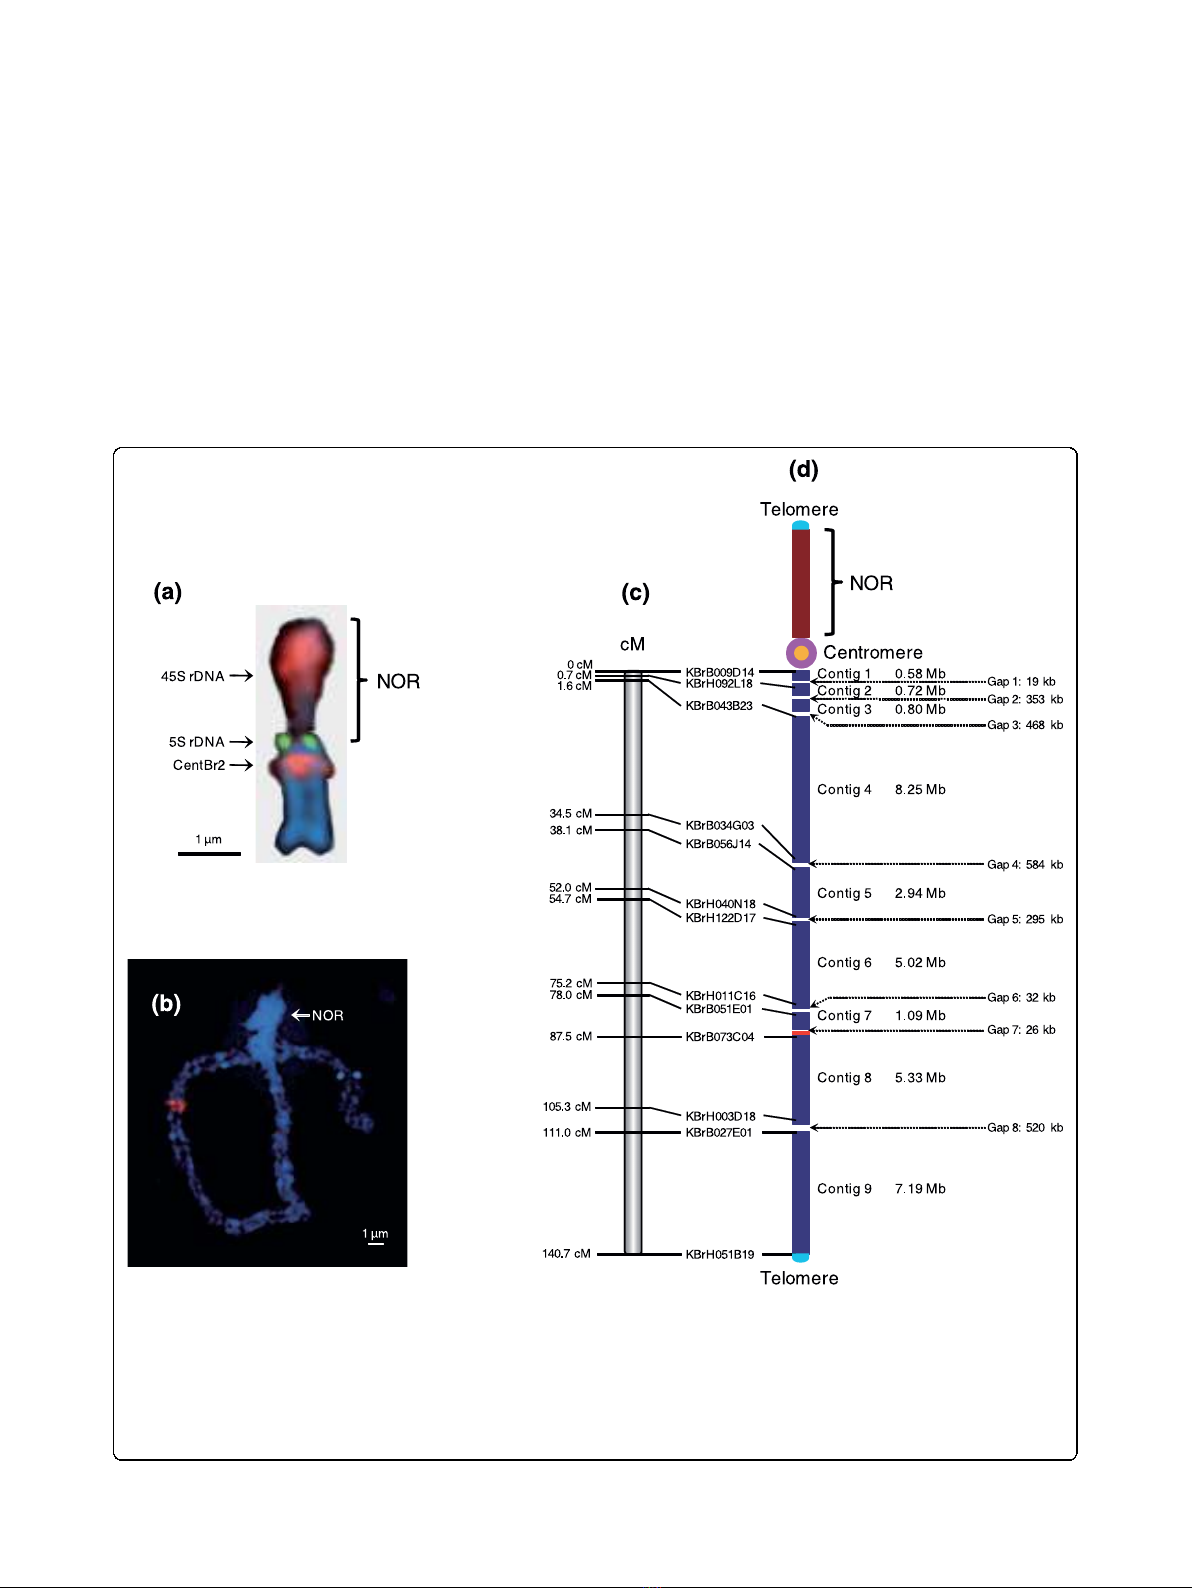
Chromosome A3 is acrocentric, with a heterochromatic
upper (short) arm bearing the nucleolar organizer region
(NOR) and a euchromatic lower (long) arm (Figure 1a).
The NOR comprises a large domain of 45S rDNA
repeats and a small fraction of 5S rDNA repeats extend-
ing to the centromere. The centromere of chromosome
A3 is typically characterized by hybridization of the 176-
bp centromeric tandem repeat CentBr2, which resides
on only chromosomes A3 and A5 [10]. The euchromatic
region of chromosome A3, the lower arm, has been
measured as 45.5 μm in pachytene FISH (Figure 1b).
The sequence length of the lower arm from centromere
to telomere was estimated to be approximately 34 to 35
Mb based on measurement of the average physical
Figure 1 Features of B. rapa chromosome A3. (a) Mitotic metaphase structure of chromosome A3 with FISH signals of 45S (red), 5S (green)
rDNAs, and CentBr2 (magenta). (b) Image of DAPI-stained pachytene spread of chromosome A3 showing the heterochromatic NORs of the
short arm (bright blue) and euchromatic long arm (blue). (c) VCS (cv. VC1 ⅹcv. SR5) genetic map showing the positions of the BAC clones found
nearest the end of each contig. (d) Physical map showing the location of nine sequence contigs (blue). The chromosome is roughly 34.2 Mb
long, spans a genetic map distance of 140.7 cM with 243 kb/cM, and contains 6.4% of the unique sequence of the B. rapa genome. The
centromere is shown as a pink circle, the NOR of the rDNA repeat region in the short arm is represented as a brown bar, and telomeres are
light blue. The telomere, centromere, and NOR are not drown to scale. The sizes of eight unsequenced gaps measured by pachytene FISH are
given in kilobases. Red areas in (b, d) point to the position of the hybridization signal of KBrH34P23 in sequence contig 8.
Mun et al.Genome Biology 2010, 11:R94
http://genomebiology.com/2010/11/9/R94
Page 3 of 12

length of sequenced contigs (1 μm/755 kb). Chromo-
some sequencing was initiated using BAC clones that
had been anchored onto the lower arm of chromosome
A3 by genetic markers. Subsequently, BES and physical
mapping of chromosome A3 allowed extension from
these initial seed points and completion of the entire
lower arm. However, no BAC clones were identified
from the upper arm, possibly owing to the lack of
appropriate restriction enzyme sites in these regions, the
instability of the sequences in Escherichia coli or a com-
plete lack of euchromatic sequences on that arm.
A total of 348 BAC clones were sequenced from the
lower arm of chromosome A3 to produce 31.9 Mb of
sequences of phase 2 or phase 3 (finished sequences)
standard. These were assembled into nine contigs that
span 140.7 cM of the genetic map (Figures 1c, d; Figure
S1 in Additional file 1). The lower arm sequence starts
at the proximal clone KBrH044B01 and terminates at
the distal clone KBrF203I22 (Table S1 in Additional file
2). Excluding the gaps at the centromere and telomere,
the pachytene spread FISH indicated that eight physical
gaps, totaling approximately 2.3 Mb, remain on the
pseudochromosome sequence. Despite extensive efforts,
no BACs could be identified in those regions. The total
length of the lower arm, from centromere to telomere,
was therefore calculated to be 34.2 Mb. Thus, the 31.9
Mb of sequences we obtained represents 93% of the
lower arm of the chromosome. The sequence and anno-
tation of B. rapa chromosome A3 can be found in Gen-
Bank (see Materials and methods).
Characterization of the sequences
The distribution of genes and various repetitive DNA
elements along chromosome A3 are depicted in Figure
2, with details of the content of repetitive sequences
provided in Table S2 in Additional file 2. Overall, 11%
of the sequenced region in chromosome A3 is com-
posed of repetitive sequences, which are dispersed over
the lower arm. The distribution of repetitive sequences
along the chromosome was not even, with fewer retro-
transposons (long terminal repeats) and DNA transpo-
sons towards the distal end. In addition, low complexity
repetitive sequences are relatively abundant in the lower
arm, indicating B. rapa-specific expansion of repetitive
sequences. These are the most frequently occurring
class of repetitive elements, accounting for 41% of the
total amount of repetitive sequence elements. Other
types of repeat do not show obvious clustering except
satellite sequences around 22 Mb from the centromere.
These sequences have high sequence similarity to a 350-
bp AT-rich tandem repeat of B. nigra [21].
Gene structure and density statistics are shown
in Table 1. The overall G+C content of chromosome
A3 is 33.8%, which is less than was reported for the
euchromatic seed BAC sequences (35.2%) [6] and
the entire A. thaliana genome (35.9%) [22]. Gene anno-
tation was carried out using our specialized B. rapa
annotation pipeline. This modeled a total of 7,058 pro-
tein-coding genes, of which 1,550 have just a single
exon. On average, each gene model contains 4.7 exons
and is 1,755 bp in length. Consistent with the results of
more restricted studies [6], the average length of gene
models annotated on chromosome A3 is shorter than
those of A. thaliana genesduetoreductioninboth
exon number per gene and exon length. The average
gene density is 4,633 bp per gene, which is also lower
than in A. thaliana (4,351 bp per gene), indicating a
slightly less compact genome organization. The longest
gene model, which is predicted to encode a potassium
ion transmembrane transporter, consists of 8 exons
across 31,311 bp.
Potential alternative splicing variants, based upon a
minimum requirement for three EST matches, was iden-
tified for only 2.3% of the gene models. This finding
suggests that alternative splicing may be rarer in B. rapa
than it is in A. thaliana, where it occurs at a frequency
of 16.9% [23]. Additional EST data will enable more pre-
cise identification of alternative spliced variants on the
B. rapa genome.
We identified 5,825 genes as ‘known’based upon EST
matches, protein matches, or any detectable domain sig-
natures. The remaining 1,417 predicted genes were
assigned as ‘unknown’or ‘hypothetical’. The functions of
‘known’genes were classified according to Gene Ontol-
ogy (GO) analysis (Figure 3). We compared the results
of GO-based classification of gene models from chromo-
some A3 with a similar analysis of gene models from
the 65.8 Mb of genome-wide seed BAC sequences [6].
This revealed several categories for which the functional
complement of genes on chromosome A3 is atypical of
the genome as a whole. For example, it has higher pro-
portions of genes classified as related to ‘stress’or
‘developmental process’under the GO biological process
category compared to the collection of seed BAC
sequences (P< 0.0001). In addition, there are differences
in terms pertaining to membrane related genes and
chloroplast of the GO cellular component category
between the two data sets (P< 0.2).
The predicted proteins found on chromosome A3
were categorized into gene families by BLASTP (using a
minimum threshold of 50% alignment coverage at a cut-
off of E
-10
). The chromosome contains 384 families of
tandemly duplicated genes with 1,262 members, com-
prising 17.9% of all genes (Figure S2 in Additional file
1).ThisislowerthanfoundinA. thaliana, which has
27% of genes existing as tandem duplicates in the gen-
ome.Themostabundantgenefamilywastheprotein
kinase family, with 249 members, followed by F-box
Mun et al.Genome Biology 2010, 11:R94
http://genomebiology.com/2010/11/9/R94
Page 4 of 12
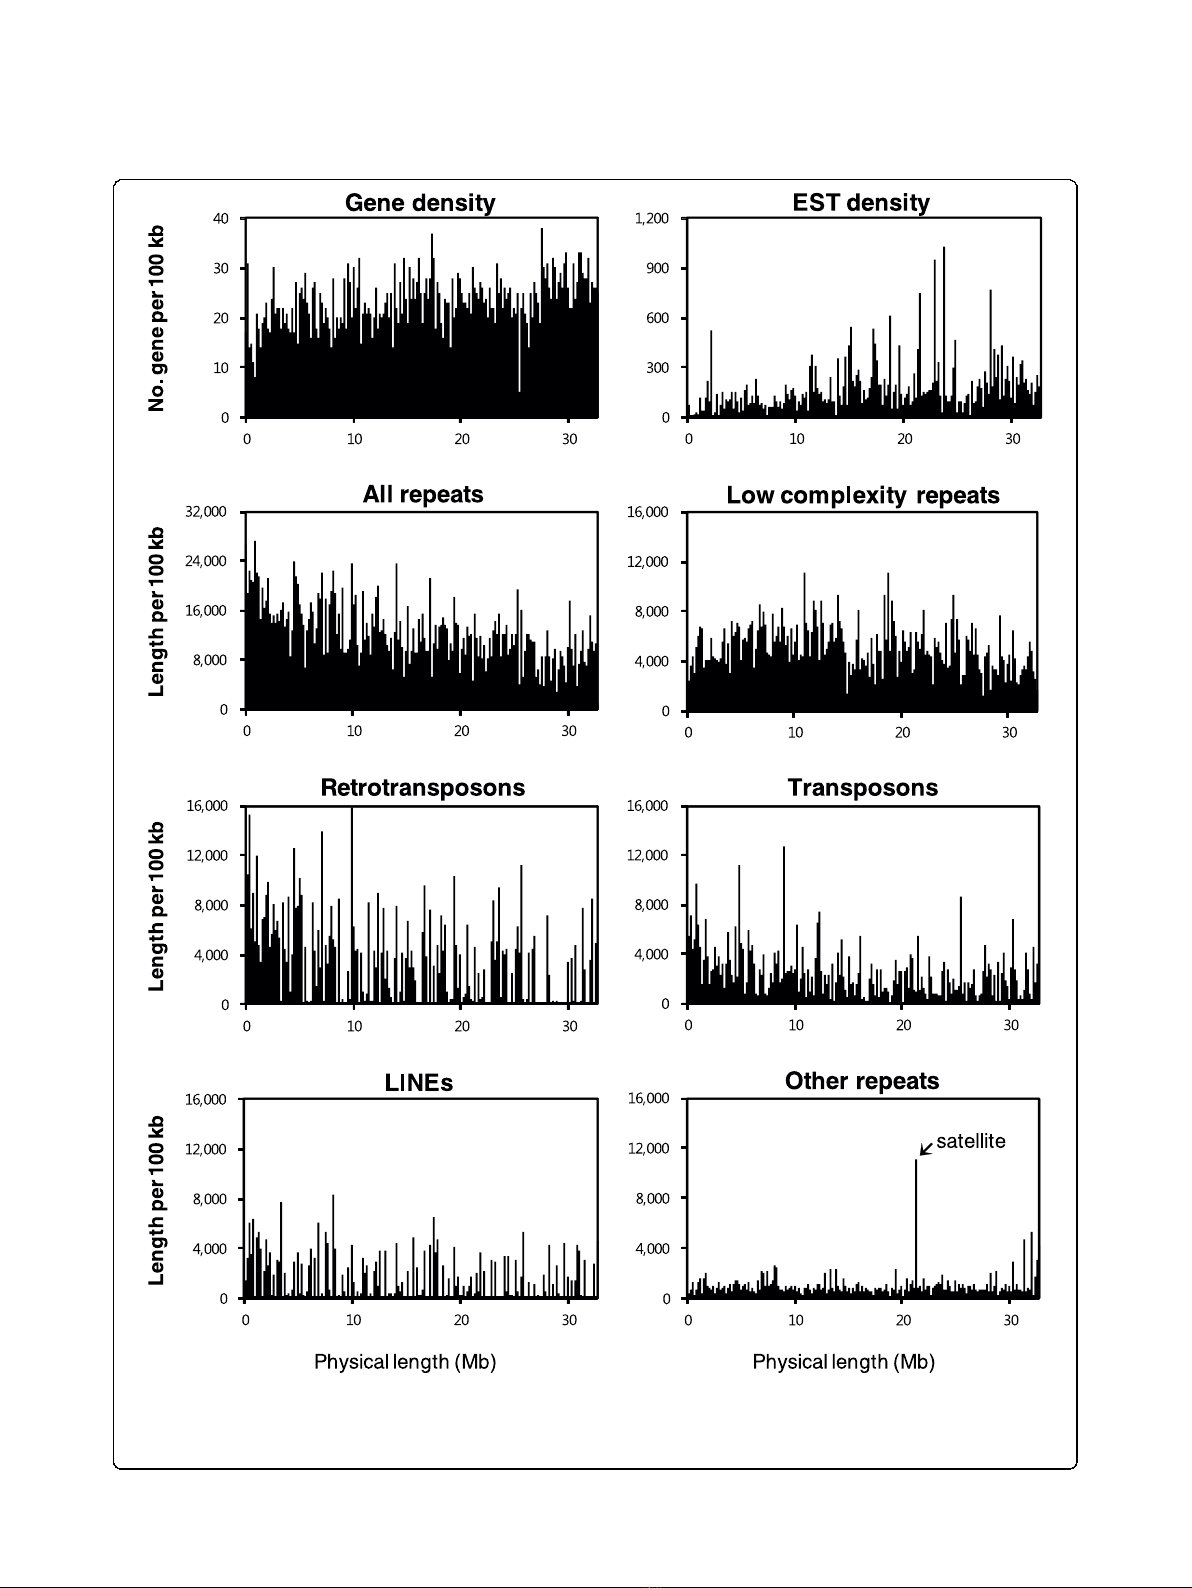
Figure 2 Distribution of various repeats and features on chromosome A3. The long arm of chromosome A3 is shown on the x-axis and is
numbered from the beginning of contig 1 to the end of contig 9 by joining up the physical gaps. The y-axis represents genes, ESTs, and the
various repeats plotted relative to the nucleotide position on the chromosome. The densities of genes, ESTs, and the repeats were obtained by
analyzing the sequence every 100 kb using a 10-kb sliding window. LINE, long interspersed nuclear element.
Mun et al.Genome Biology 2010, 11:R94
http://genomebiology.com/2010/11/9/R94
Page 5 of 12


![PET/CT trong ung thư phổi: Báo cáo [Năm]](https://cdn.tailieu.vn/images/document/thumbnail/2024/20240705/sanhobien01/135x160/8121720150427.jpg)


%20--%3e%3cdefs%3e%3cstyle%3e%20.st0%20{%20fill:%20%23fff;%20}%20.st1%20{%20fill:%20%237800fa;%20}%20%3c/style%3e%3c/defs%3e%3cpath%20class='st1'%20d='M117.78,12.18H43.11c2.9,3.47,4.65,7.94,4.65,12.82,0,5.6-2.3,10.66-6.01,14.29h76.02l7.22-13.56-7.22-13.56Z'/%3e%3cg%3e%3cpath%20class='st0'%20d='M53.58,26.17h-.59v-1.46h.59v-4.96h2.83c1.78,0,2.67.94,2.67,2.82v5.76c0,1.87-.89,2.81-2.67,2.81h-2.83v-4.96ZM55.36,21.37v3.34h1.1v1.46h-1.1v3.34h1.01c.61,0,.91-.37.91-1.1v-5.93c0-.74-.3-1.1-.91-1.1h-1.01Z'/%3e%3cpath%20class='st0'%20d='M65.99,31.14h-1.8l-.31-2.07h-2.19l-.31,2.07h-1.64l1.82-11.39h2.62l1.82,11.39ZM65.28,18.04c-.25.46-.51.77-.75.94-.21.15-.47.22-.79.22-.26,0-.57-.07-.92-.22l-.38-.15c-.14-.05-.26-.07-.37-.07-.3,0-.53.18-.71.54l-.91-.68c.25-.46.51-.77.75-.94.21-.14.48-.21.79-.21.26,0,.57.07.92.21l.38.15c.14.05.26.07.37.07.3,0,.53-.18.71-.54l.91.68ZM61.91,27.52h1.73l-.87-5.76-.87,5.76Z'/%3e%3cpath%20class='st0'%20d='M74.53,26.89v1.52c0,1.91-.89,2.86-2.67,2.86s-2.67-.95-2.67-2.86v-5.93c0-1.91.89-2.86,2.67-2.86s2.67.95,2.67,2.86v1.11h-1.69v-1.22c0-.75-.31-1.12-.93-1.12s-.93.37-.93,1.12v6.15c0,.74.31,1.11.93,1.11s.93-.37.93-1.11v-1.63h1.69Z'/%3e%3cpath%20class='st0'%20d='M81.4,31.14h-1.8l-.31-2.07h-2.19l-.31,2.07h-1.64l1.82-11.39h2.62l1.82,11.39ZM75.9,19.2l1.52-1.91h1.71l1.51,1.91h-1.61l-.76-.95-.75.95h-1.61ZM77.32,27.52h1.73l-.87-5.76-.87,5.76ZM83.1,15.99l-1.76,1.91h-1.26l1.17-1.91h1.86Z'/%3e%3cpath%20class='st0'%20d='M84.86,19.75c1.78,0,2.67.94,2.67,2.82v1.48c0,1.87-.89,2.81-2.67,2.81h-.85v4.28h-1.79v-11.39h2.64ZM84.01,21.37v3.86h.85c.58,0,.87-.36.87-1.08v-1.71c0-.71-.29-1.07-.87-1.07h-.85Z'/%3e%3cpath%20class='st0'%20d='M93.51,19.75c1.78,0,2.67.94,2.67,2.82v1.48c0,1.87-.89,2.81-2.67,2.81h-.85v4.28h-1.79v-11.39h2.64ZM92.66,21.37v3.86h.85c.58,0,.87-.36.87-1.08v-1.71c0-.71-.29-1.07-.87-1.07h-.85Z'/%3e%3cpath%20class='st0'%20d='M98.8,31.14h-1.79v-11.39h1.79v4.88h2.03v-4.88h1.83v11.39h-1.83v-4.88h-2.03v4.88Z'/%3e%3cpath%20class='st0'%20d='M105.36,24.55h2.46v1.62h-2.46v3.34h3.09v1.63h-4.88v-11.39h4.88v1.63h-3.09v3.18ZM108.17,17.29l-1.76,1.91h-1.26l1.17-1.91h1.86Z'/%3e%3cpath%20class='st0'%20d='M112.2,19.75c1.78,0,2.67.94,2.67,2.82v1.48c0,1.87-.89,2.81-2.67,2.81h-.85v4.28h-1.79v-11.39h2.64ZM111.35,21.37v3.86h.85c.58,0,.87-.36.87-1.08v-1.71c0-.71-.29-1.07-.87-1.07h-.85Z'/%3e%3c/g%3e%3ccircle%20class='st1'%20cx='25'%20cy='25'%20r='20'/%3e%3cpath%20class='st0'%20d='M32.78,19.27c2.92,0,4.43,2.55,5.28,5.33l.71,2.17c.14.38-.33.75-.71.75h-5.61c.19-.33.24-.71.09-1.08l-.75-2.45c-.43-1.32-.99-2.64-1.79-3.77.75-.57,1.65-.94,2.78-.94h0ZM25,18.38c3.25,0,4.9,2.78,5.89,5.89l.76,2.45c.14.42-.33.8-.8.8h-11.69c-.42,0-.94-.38-.8-.8l.75-2.45c.99-3.11,2.64-5.89,5.89-5.89h0ZM25,11.35c1.74,0,3.11,1.37,3.11,3.11s-1.37,3.11-3.11,3.11-3.11-1.41-3.11-3.11,1.41-3.11,3.11-3.11h0ZM17.27,19.27c1.08,0,1.98.38,2.73.94-.8,1.13-1.37,2.45-1.74,3.77l-.8,2.45c-.14.38-.05.75.09,1.08h-5.56c-.42,0-.9-.38-.75-.75l.71-2.17c.9-2.78,2.41-5.33,5.33-5.33h0ZM17.27,12.91c1.51,0,2.78,1.27,2.78,2.83s-1.27,2.83-2.78,2.83-2.83-1.27-2.83-2.83,1.27-2.83,2.83-2.83h0ZM32.78,12.91c1.56,0,2.78,1.27,2.78,2.83s-1.23,2.83-2.78,2.83-2.83-1.27-2.83-2.83,1.27-2.83,2.83-2.83h0ZM27.07,28.56v.09c0,.57-.24,1.08-.61,1.46h0v.05c-.38.33-.9.57-1.46.57s-1.08-.24-1.46-.61h0c-.38-.38-.61-.9-.61-1.46v-.09h1.41v.09c0,.19.05.38.19.47v.05c.09.09.28.19.47.19s.38-.09.47-.19v-.05c.14-.09.24-.28.24-.47t-.05-.09h1.41ZM30.99,28.56v.09c0,1.65-.66,3.16-1.74,4.24-1.08,1.08-2.59,1.79-4.24,1.79s-3.16-.71-4.24-1.79l-.05-.05c-1.04-1.08-1.7-2.55-1.7-4.2v-.09h1.41v.09c0,1.27.47,2.4,1.27,3.25h.05c.85.85,1.98,1.37,3.25,1.37s2.4-.52,3.25-1.37c.85-.8,1.37-1.98,1.37-3.25v-.09h1.37ZM34.99,28.56v.09c0,2.78-1.13,5.28-2.92,7.07-1.79,1.79-4.29,2.92-7.07,2.92s-5.23-1.13-7.07-2.92c-1.79-1.79-2.92-4.29-2.92-7.07v-.09h1.41v.09c0,2.4.94,4.53,2.5,6.08,1.56,1.56,3.72,2.5,6.08,2.5s4.52-.94,6.08-2.5c1.56-1.56,2.5-3.68,2.5-6.08v-.09h1.41Z'/%3e%3c/svg%3e)