
BioMed Central
Page 1 of 9
(page number not for citation purposes)
Respiratory Research
Open Access
Research
The effect of IL-13 and IL-13R130Q, a naturally occurring IL-13
polymorphism, on the gene expression of human airway smooth
muscle cells
Farhat Syed*1, Reynold A Panettieri Jr2, Omar Tliba2, Chris Huang1,
Katherine Li1, Michelle Bracht1, Bernard Amegadzie1, Don Griswold1, Li Li1
and Yassine Amrani*2
Address: 1Centocor Inc., 200 Great Valley Parkway, Malvern PA 19355. USA and 2Pulmonary Allergy and Critical Care Division, Department of
Medicine, University of Pennsylvania, Room 848 BRBII/III, 421 Curie Boulevard, Philadelphia PA 19104. USA
Email: Farhat Syed* - fsyed@cntus.jnj.com; Reynold A Panettieri - rap@mail.med.upenn.edu; Omar Tliba - omartlib@mail.med.upenn.edu;
Chris Huang - CHuang4@cntus.jnj.com; Katherine Li - Kli@cntus.jnj.com; Michelle Bracht - Mbracht@cntus.jnj.com;
Bernard Amegadzie - BAmegadz@cntus.jnj.com; Don Griswold - DGriswol@cntus.jnj.com; Li Li - Lli14@cntus.jnj.com;
Yassine Amrani* - amrani@mail.med.upenn.edu
* Corresponding authors
Abstract
Background: Growing evidence shows that interleukin 13 (IL-13) may play an essential role in the
development of airway inflammation and bronchial hyper-responsiveness (BHR), two defining
features of asthma. Although the underlying mechanisms remain unknown, a number of reports
have shown that IL-13 may exert its deleterious effects in asthma by directly acting on airway
resident cells, including epithelial cells and airway smooth muscle cells. In this report, we
hypothesize that IL-13 may participate in the pathogenesis of asthma by activating a set of "pro-
asthmatic" genes in airway smooth muscle (ASM) cells.
Methods: Microarray technology was used to study the modulation of gene expression of airway
smooth muscle by IL-13 and IL-13R130Q. TaqMan™ Real Time PCR and flow cytometry was used
to validate the gene array data.
Results: IL-13 and the IL-13 polymorphism IL-13R130Q (Arg130Gln), recently associated with
allergic asthma, seem to modulate the same set of genes, which encode many potentially interesting
proteins including vascular cellular adhesion molecule (VCAM)-1, IL-13Rα2, Tenascin C and
Histamine Receptor H1, that may be relevant for the pathogenesis of asthma.
Conclusions: The data supports the hypothesis that gene modulation by IL-13 in ASM may be
essential for the events leading to the development of allergic asthma.
Background
Recent reports using murine models of allergic asthma
have shown that the Th2 type cytokine IL-13 may play a
critical role in the pathogenesis of asthma, either by regu-
lating airway inflammation, mucus hyper-secretion or air-
way hyper-responsiveness [1-5]. Evidence suggests that
Published: 20 January 2005
Respiratory Research 2005, 6:9 doi:10.1186/1465-9921-6-9
Received: 08 December 2004
Accepted: 20 January 2005
This article is available from: http://respiratory-research.com/content/6/1/9
© 2005 Syed et al; licensee BioMed Central Ltd.
This is an Open Access article distributed under the terms of the Creative Commons Attribution License (http://creativecommons.org/licenses/by/2.0),
which permits unrestricted use, distribution, and reproduction in any medium, provided the original work is properly cited.

Respiratory Research 2005, 6:9 http://respiratory-research.com/content/6/1/9
Page 2 of 9
(page number not for citation purposes)
the potential role of IL-13 in asthma may come from its
aptitude to directly interact with airway resident cells,
such as epithelial cells or airway smooth muscle (ASM)
cells, as shown by the ability of IL-13 to stimulate a set of
different pro-asthmatic genes including inflammatory
cytokines such as thymus and activation-regulated chem-
okine (TARC), eotaxin, monocyte chemotactic protein-1
(MCP-1) as well as growth factors such as vascular
endothelial growth factor (VEGF) and basic fibroblast
growth factor (bFGF) [6-10]. The ability of IL-13 to mod-
ulate ASM responsiveness to G-protein coupled receptor
(GPCR) agonists, either by increasing contractile agonist-
evoked calcium responses [11], and/or by impairing ASM
responsiveness to β2-adrenoceptor stimulation [6], may
also explain, at least in part, the putative role of IL-13 in
allergen-associated BHR reported in animal models [1-4].
Previous reports have shown that other cytokines such as
tumor necrosis factor alpha (TNFα) or interleukin (IL)-1β,
may also participate in airway hyper-responsiveness by
modulating ASM responsiveness to contractile GPCR ago-
nists [12-14]. These data strongly support the current con-
cept that cytokine modulation of ASM, an effector cell
thought to solely regulate bronchomotor tone [12], may
play an important role in the development of airway
inflammation and bronchial hyper-responsiveness, the
two main features of asthma. The molecular mechanisms
by which IL-13 induces "pro-asthmatic responses" in ASM
have not been clearly established. Identifying the expres-
sion profile of "pro-asthmatic" genes activated by IL-13 in
ASM cells may therefore provide new insight into the
design of novel therapeutic approaches for asthma.
Using complementary molecular approaches, we investi-
gated the effect of IL-13 on the transcription of "pro-asth-
matic" genes in human airway smooth muscle cells
(HASMC). The effect of IL-13 was compared to that of IL-
13R130Q, a naturally occurring isoform resulting in a
change from glutamine to arginine residues in the coding
region that is associated with high serum IgE levels [15].
Interestingly, no report has yet investigated whether both
IL-13 and IL-13R130Q share the same or have different
biological activities. We found that both IL-13 and IL-
13R130Q stimulate the same set of important genes that
encode for proteins which may be clinically relevant for
regulating airway hyper-responsiveness, airway inflam-
mation and airway remodeling, key characteristics of
asthma.
Methods
Cell Culture
Human tracheas were obtained from lung transplant
donors, in accordance with procedures approved by the
University of Pennsylvania Committee on Studies Involv-
ing Human Beings. A segment of trachea just proximal to
the carina was removed under sterile conditions and the
tracheal muscle was isolated. The muscle was then centri-
fuged and resuspended in 10 ml of buffer containing 0.2
mM CaCl2, 640 U/ml collagenase, 1 mg/ml soybean
trypsin inhibitor and 10 U/ml elastase. Enzymatic dissoci-
ation of the tissue was performed for 90 min in a shaking
water bath at 37°C. The cell suspension was filtered
through 105 µm Nytex mesh, and the filtrate was washed
with equal volumes of cold Ham's F12 medium (Gibco
BRL Life Technologies, Grand Island, NY) supplemented
with 10% FBS (HyClone, Logan, UT) 100 U/ml penicillin
(Gibco), 0.1 mg/ml streptomycin (Gibco), and 2.5 µg/ml
fungizone (Gibco). Aliquots of the cell suspension were
plated at a density of 1.0 × 10⁴ cells/cm2. The cells were
cultured in Ham's F12 media supplemented with 10%
FBS, 100 U/ml penicillin, 0.1 mg/ml streptomycin and
this was replaced every 72 h. Human ASM cells in subcul-
ture during the second through to fifth cell passages were
used because, during these cell passages, the cells retain
native contractile protein expression, as demonstrated by
immunocytochemical staining for smooth muscle actin
and myosin [16]. Unless otherwise specified, all chemi-
cals used in this study were purchased from Sigma/Aldrich
(St. Louis, MO).
RNA isolation
Total cellular RNA was isolated from IL-13 (50 ng/ml), IL-
13R130Q (50 ng/ml) or control treated HASMC using the
RNeasy mini kit (Qiagen, Inc. Valencia, CA) as per manu-
facturer's instructions. The IL-13 was purchased from
R&D Systems (Minneapolis, MN) and the IL-13R130Q
was generated in house at Centocor Inc. The quality and
quantity of RNA was assessed using the Agilent 2100 Bio-
analyzer (South Plainfield, New Jersey). Samples that
demonstrated high quality (ratio of 28S rRNA and 18S
rRNA is greater than 1.7) were submitted for microarray
analysis.
Microarray Processing
A complimentary DNA (cDNA) microarray, or DNA chip
(Target B), containing a total of 8159 human gene cDNA
clones from Research Genetics (IMAGE consortium,
Huntsville, AL), Incyte Genomics (Santa Clara, CA) and
internal sources was used in this study. All clones have
been verified by DNA sequencing and are printed as 2
independent spots on a given chip. Duplicate chips were
used for each RNA sample. Non-linear normalization
between duplicate chips allowed each clone to be aver-
aged to a single intensity value for each RNA sample.
RNA amplification, probe synthesis and labeling, cDNA
chip hybridization and washing were performed as
described previously [17]. Agilent Image Scanner was
used to scan the cDNA chips (Agilent Technologies, Palo
Alto, CA). Fluorescence intensity for each feature of the

Respiratory Research 2005, 6:9 http://respiratory-research.com/content/6/1/9
Page 3 of 9
(page number not for citation purposes)
array was obtained by using ImaGene software (BioDis-
covery, Los Angeles, CA).
Microarray data analysis
In this study, fifty one-color cDNA microarrays were used
to profile gene expression in human airway smooth mus-
cle cells from 3 donors stimulated with IL-13, or its variant
IL-13R130Q at 2 time points (6 hr and 18 hr). Untreated
samples from the same group of donors were used as con-
trol. The samples being analyzed are listed in Table 1.
Purified cDNA probes were hybridized to two microar-
rays, each containing two spots for each cDNA. Raw inten-
sity data from the cDNA arrays were first normalized
within each sample. Linear normalization and then non-
linear normalization was performed within each sample.
Outlier intensity data points (greater than 1.4 fold away
from the median of replicate measurements) were identi-
fied and removed from the data sets. The average intensity
was generated by calculating the arithmetic mean of non-
outlier intensity values. The averaged intensity for each
clone was further normalized across all samples. Chip-to-
chip normalization was performed by dividing the aver-
aged intensity of each clone by the 50.0th percentile of all
measurements in that sample. The intensity of each clone
was then normalized to the median intensity of that clone
in the untreated control group. The normalized intensity
was then log transformed.
Using Partek Pro™ 5.1, sources of variance, such as batch
effects, were identified by Principle Component Analysis
(PCA) and appropriate factors were taken into account in
the Analysis of Variance (ANOVA). ANOVA was per-
formed to identify the genes that were differentially
expressed by cytokine stimulation. Treatment (IL-13 and
IL-13R130Q), time (6 hour and 18 hour), and donor (1,
2, and 3) were the three main effects considered in
ANOVA. P-value cutoff was 0.05.
Benjamini and Hochberg false discovery rate (FDR) was
performed for multiple testing correction. After compar-
ing the gene lists from IL-13 and IL-13R130Q treatments,
it was clear that these two treatments resulted in the regu-
lation of the same set of genes. Subsequently, samples
from these two treatments were combined and regarded
as replicates in ANOVA. Furthermore, outliner samples in
the data set were detected by PCA and removed to
improve the detection power.
As an alternative approach, fold change comparisons (cut-
off = 1.5 fold) between a treated condition and the control
were carried out within each donor by using GeneSpring™
6.2 [18]. A gene was considered as reliably detected in a
given condition if more than half of the replicates repre-
senting the same condition had a raw expression intensity
of more than 50, CV smaller than 25%, and raw intensity
being generated from 2 or more of the duplicate spots rep-
resenting the clone. A pair-wise comparison between a
treatment and its untreated control was performed only
on the genes that were reliably detected in at least one
condition of the pair. The genes that showed at least 1.5
fold differential expression in two or more donors were
identified for each cytokine treatment at a time.
Reverse Transcription and Real Time PCR
1 µg of total RNA from each of the IL-13 (50 ng/ml) or IL-
13R130Q (50 ng/ml) or control treated HASMC were
used for the reverse transcription (RT) reaction. The RT
reaction was performed as per protocol using TaqMan® RT
reagents (Applied Biosystems) at 37°C for 120 min fol-
lowed by 25°C for 10 min. Forty ng of cDNA per reaction
were used in the Real Time PCR using the ABI Prism® 7900
sequence detection system (Foster City, California). In the
presence of AmpliTaq Gold DNA plolymerase (ABI bio-
system, Foster City, California), the reaction was incu-
bated for 2 min at 50°C followed by 10 min at 95°C.
Then the reaction was run for 40 cycles at 15 sec, 95°C
and 1 min, 60°C per cycle. Assays-on-Demand™ primers
and probes (Applied Biosystems) were used in the PCR.
The Real Time PCR data was analyzed using the standard
curve method.
Flow Cytometry
Flow cytometry was performed as described previously
with slight modifications [19]. Briefly, adherent cells
treated with IL-13 for 24 hr were washed with PBS,
detached by trypsinization (2 min, 37°C) and then
washed with Ham's-F12 (10% FCS) media, centrifuged,
and transferred to microfuge tubes (1.5 ml). Cells were
incubated with anti-IL-13Rα2 (5 µg/ml, Santa Cruz Bio-
tech) antibody followed by 1 hr incubation with a fluores-
cein isothiocyanate-conjugated secondary antibody
(Jackson ImmunoResearch Laboratories; West Grove,
PA). In parallel experiements, cells were incubated with
Table 1: Summary of number of samples from each donor and
treatments
Time Donor Untreated IL-13 IL-13R130Q
6 hr Donor 1* - - -
Donor 2 1 2 2
Donor 3 1 2 2
18 hr Donor 1 1 2 2
Donor 2 1 2 2
Donor 3 1 2 2
*The samples from Donor 1 at the 6 hr time point were not included
due to poor quality of RNA.

Respiratory Research 2005, 6:9 http://respiratory-research.com/content/6/1/9
Page 4 of 9
(page number not for citation purposes)
the FITC-conjugated mouse anti-VCAM-1 antibody (2 µg/
ml, Santa Cruz Biotech) for 1 h at 4°C. The cells were then
centrifuged and resuspended in cold PBS in microfuge
tubes. Samples were then analyzed using an EPICS XL
flow cytometer (Coulter, Hialeah, FL). VCAM-1 and IL-
13Rα2 levels were expressed as the increase in mean fluo-
rescence intensity over un-stimulated cells.
Results
IL-13 regulates gene expression of HASMCs
IL-13 may exert its deleterious effects in asthma by directly
altering gene expression in airway resident cells such as
epithelial cells or ASM cells [5-7,20]. In order to deter-
mine which genes are regulated by IL-13 in airway smooth
muscle cells, we employed the cDNA microarray technol-
ogy. We also wanted to ascertain if the effect of IL-
13R130Q, a naturally occurring isoform of IL-13 and
associated with high serum IgE levels [15], was any differ-
ent than IL-13 in terms of modulating gene expression.
The concentrations of IL-13 (10–100 ng/ml) used in our
study were shown previously to stimulate gene expression
in human ASM cells [7,8,10], although the in vivo rele-
vance of these particular concentrations remains
unknown.
Three donors were used and two types of analyses were
carried out (Fold change analysis; Statistical Analysis).
Both IL-13 and IL-13R130Q generated a similar expres-
sion profile i.e., genes regulated by IL-13 were the same as
those regulated by IL-13R130Q at the 1.5 fold cutoff.
Table 2 lists genes of interest that were identified from
analyzing the data and divides them into one of three cat-
egories. Genes involved in all three characteristics of
asthma (airway inflammation, remodeling and bronchial
hyper-responsiveness) were identified. Of particular inter-
est are vascular cellular adhesion molecule (VCAM)-1,
Tenascin C, IL-13Rα2 and Histamine Receptor H1.
Real Time PCR validation
TaqMan™ Real Time PCR was used to validate VCAM1, IL-
13Rα2, Tenascin C and Histamine Receptor H1. As shown
in Figure 1A, VCAM1 was upregulated between 2 and 2.5
fold upon IL-13 or IL-13R130Q treatment at the 6 and 18
hour time points in both donors. This is comparable to
the microarray data (Table 2). In Figure 1B, IL-13Rα2
mRNA is upregulated with IL-13 or IL-13R130Q. How-
ever, the upregulation is more pronounced at the 18 hour
time point compared to 6 hour. In Figure 2A Tenascin C is
upregulated with IL-13 and IL-13R130Q and in Figure 2B,
Histamine Receptor H1 shows an upregulation of about
1.5 fold in both donors at both time points and with both
treatments. Again, this is comparable to the microarray
data (Table 2).
Validation of VCAM-1 and IL-13R
α
2 at the protein level
In order to validate the modulatory effect of IL-13 on
VCAM-1 and IL-13Rα2 genes at their protein level, flow
cytometry was performed to confirm the up regulation of
VCAM-1 and IL-13Rα2 in HASMC by IL-13. As shown in
Figure 3 and 4, IL-13 (10–100 ng/ml, 24 hr) differentially
stimulates the expression of VCAM-1, with levels increas-
ing in a dose-dependent manner, while IL-13Rα2 levels
were identical at 10, 30 and 50 ng/ml. At 100 ng/ml IL-13,
VCAM-1 and IL-13Rα2 levels were significantly increased
by 20% and 35% over basal, respectively (n = 3, p < 0.05).
Table 2: Summary of genes up regulated by IL-13 and IL-
13R130Q.
Category Gene(s) Fold change
Airway Inflammation
Adhesion Molecules VCAM-1 ↑ 2 fold
ALCAM
Selectin P ligand
Laminin B1
Chemokines Chemokine Ligand 2
Chemokine Ligand 11
Chemokine Ligand 26
Chemokine Ligand 27
Cytokine receptors IL-13 Rα2↑ 1.6 fold
Interleukin 1 receptor
Airway Remodeling
Extracellular matrix Tenascin C ↑ 2 fold
Tenascin R
Collagen Type I
Collagen Type VI
Collagen Type III
Fibulin 1
CD44
Cell proliferation Pim-1
eEF1A
Cytokines PDGFC
Retinoic acid Receptor
Interferon beta 1
Bronchial Hyper-
responsiveness
Cytoskeletal constituants Vimentin
Tropomyosin 1
Tropomyosin 2
Actin
Calcium regulators Phospholipase D
Calreticulin
hGIRK1
TRPC4
TRPC6
Sphingosine kinase 1
Rho GDP dissociation
inhibitor
FKBP1A
Receptor Histamine H1
receptor
↑ 1.3 fold
The fold changes correspond to the genes in bold.
Respiratory Research 2005, 6:9 http://respiratory-research.com/content/6/1/9
Page 5 of 9
(page number not for citation purposes)
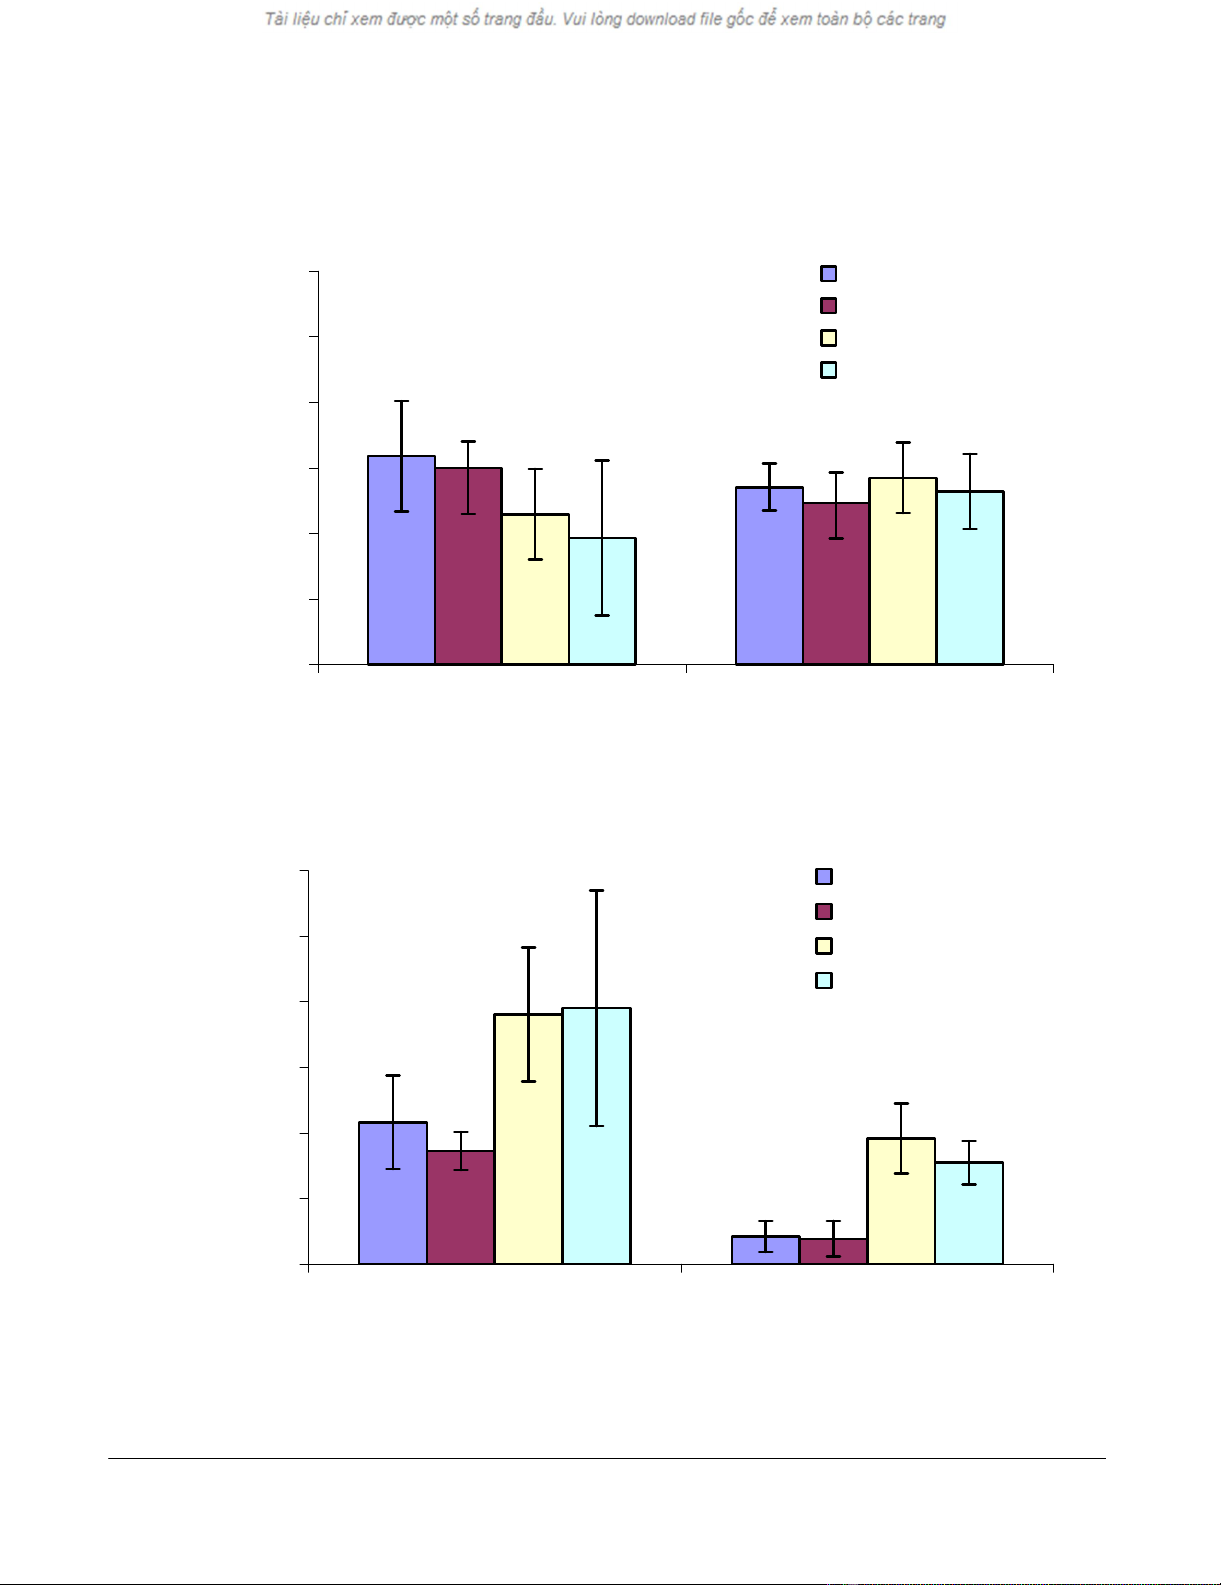
Real Time PCR (Taqman®) analysis showing the level of A) VCAM1 B) IL-13Rα2 upon treatment of ASM from two donors with IL-13 or IL-13R13Q for 6 or 18 hrsFigure 1
Real Time PCR (Taqman®) analysis showing the level of A) VCAM1 B) IL-13Rα2 upon treatment of ASM from two donors
with IL-13 or IL-13R13Q for 6 or 18 hrs. The quantity of each gene is normalized to 18S and relative to the untreated sample.
Values shown are mean ± standard deviation from an n = 6.
A)
1
1.5
2
2.5
3
3.5
4
Donor 2 Donor 3
Quantity of VCAM1/18S relative to
control
IL-13 6hr
IL-13R130Q 6hr
IL-13 18hr
IL-13R130Q 18hr
B)
1
1.5
2
2.5
3
3.5
4
Donor 2 Donor 3
Quantity of IL-13RD2/18S relative
to control
IL-13 6hr
IL-13R130Q 6hr
IL-13 18hr
IL-13R130Q 18hr


