
Open Access
Available online http://arthritis-research.com/content/7/1/R127
R127
Vol 7 No 1
Research article
Tumor necrosis factor alpha and epidermal growth factor act
additively to inhibit matrix gene expression by chondrocyte
Aaron R Klooster and Suzanne M Bernier
CIHR Group in Skeletal Development and Remodeling, Department of Anatomy and Cell Biology, The University of Western Ontario, London, Ontario,
Canada
Corresponding author: Suzanne M Bernier, smbernie@uwo.ca
Received: 26 Jul 2004 Revisions requested: 23 Sep 2004 Revisions received: 8 Oct 2004 Accepted: 22 Oct 2004 Published: 29 Nov 2004
Arthritis Res Ther 2005, 7:R127-R138 (DOI 10.1186/ar1464)http://arthri tis-research.co m/content/7/1 /R127
© 2004 Klooster and Bernier., licensee BioMed Central Ltd.
This is an Open Access article distributed under the terms of the Creative Commons Attribution License (http://creativecommons.org/licenses/by/
2.0), which permits unrestricted use, distribution, and reproduction in any medium, provided the original work is cited.
Abstract
The failure of chondrocytes to replace the lost extracellular
matrix contributes to the progression of degenerative disorders
of cartilage. Inflammatory mediators present in the joint regulate
the breakdown of the established matrix and the synthesis of
new extracellular matrix molecules. In the present study, we
investigated the effects of tumor necrosis factor alpha (TNF-α)
and epidermal growth factor (EGF) on chondrocyte morphology
and matrix gene expression. Chondrocytes were isolated from
distal femoral condyles of neonatal rats. Cells in primary culture
displayed a cobblestone appearance. EGF, but not TNF-α,
increased the number of cells exhibiting an elongated
morphology. TNF-α potentiated the effect of EGF on
chondrocyte morphology. Individually, TNF-α and EGF
diminished levels of aggrecan and type II collagen mRNA. In
combination, the effects of TNF-α and EGF were additive,
indicating the involvement of discrete signaling pathways. Cell
viability was not compromised by TNF-α or by EGF, alone or in
combination. EGF alone did not activate NF-κB or alter NF-κB
activation by TNF-α. Pharmacologic studies indicated that the
effects of TNF-α and EGF alone or in combination were
independent of protein kinase C signaling, but were dependent
on MEK1/2 activity. Finally, we analyzed the involvement of Sox-
9 using a reporter construct of the 48 base pair minimal
enhancer of type II collagen. TNF-α attenuated enhancer activity
as expected; in contrast, EGF did not alter either the effect of
TNF-α or basal activity. TNF-α and EGF, acting through distinct
signaling pathways, thus have additive adverse effects on
chondrocyte function. These findings provide critical insights
into the control of chondrocytes through the integration of
multiple extracellular signals.
Keywords: chondrocyte, epidermal growth factor, extracellular matrix, signaling, tumor necrosis factor alpha
Introduction
The role of epidermal growth factor (EGF) in the develop-
ment of articular cartilage and the pathogenesis of arthritis
is poorly understood. During development, EGF produced
by the apical ectodermal ridge promotes the outgrowth of
the limb bud mesoderm; however, migration away from the
apical ectodermal ridge and downregulation of EGF
expression in the mesodermal cells is necessary for differ-
entiation of this cell population into chondrocytes [1]. We
previously found that EGF encourages expansion of early
committed chondrocytes but prevents the expression of
link protein and aggrecan [2], two extracellular matrix com-
ponents that are necessary for proper cartilage organiza-
tion [3]. Proteoglycan accumulation is inhibited following
treatment of mature articular chondrocytes with EGF in a
monolayer or an organ culture [4,5]. We recently demon-
strated an increase in proton efflux from chondrocytes
treated with EGF resulting in localized acidification of the
microenvironment that may contribute to altering both
responsiveness of chondrocytes to extracellular stimuli and
the activity of matrix metalloproteinases [6]. EGF is detect-
able in the synovial fluid of rheumatoid arthritis patients and
influences the growth of synovial cells [7]. However, the
effects on cartilage of EGF, alone or in conjunction with
other mediators associated with inflammation, are poorly
characterized.
BIS = bisindolylmaleimide; EGF = epidermal growth factor; ERK = extracellular signal-regulated kinase; IL = interleukin; MAPK = mitogen-activated
protein kinase; MEK1/2 = mitogen-activated protein kinase kinase 1 and 2; NF = nuclear factor; PARP = poly(ADP ribose) polymerase; PKC = protein
kinase C; TNF-α = tumor necrosis factor alpha; TUNEL = terminal deoxynucleotidyl transferase-mediated dUTP nick end-labeling; U0124 = 1,4-
diamino-2,3-dicyano-1,4-bis(methylthio) butadiene; U0126 = 1,4-diamino-2,3-dicyano-1,4-bis[2-aminophenylthio] butadiene.

Arthritis Research & Therapy Vol 7 No 1 Klooster and Bernier
R128
Among the inflammatory mediators associated with joint
diseases, tumor necrosis factor alpha (TNF-α) is well estab-
lished as a key mediator in the progression of cartilage
degeneration. High levels of TNF-α are detected in the syn-
ovial lining of rheumatic joints and in chondrocytes of oste-
oarthritic joints [8]. TNF-α promotes further expression of
cytokines and chemokines by synovial cells and chondro-
cytes, thereby sustaining a renewal of local inflammatory
mediators (reviewed in [9,10]). The presence of TNF-α cor-
relates with a general loss of cartilage matrix molecules,
such as type II collagen and aggrecan, due to increased
production of matrix metalloproteinases and a reduction in
synthesis of matrix molecules [11]. We recently demon-
strated that activation of the NF-κB and mitogen-activated
protein kinase (MAPK)/extracellular signal-regulated kinase
(ERK) signaling pathways contributes to the TNF-α-medi-
ated reduction of transcription of the type II collagen and
link protein genes, as well as to a reduction in the steady-
state mRNA levels of these key extracellular matrix compo-
nents [12]. In rheumatic joints, elevated levels of EGF in the
synovial fluid contribute to hyperplasia of the synovial lining,
where synovial cells display increased expression of the
EGF receptor ErbB-2 (also known as c-neu or HER2)
[7,13,14] and amplify IL-1-mediated release of prostaglan-
din E2 from synovial cells [15]. However, the combined
effects of EGF and TNF-α have not been investigated
previously.
The objective of the present study was to determine
whether EGF potentiates the response of chondrocytes to
TNF-α. We investigated changes in chondrocyte morphol-
ogy and function. The expression of type II collagen that is
responsible for the structural integrity of articular cartilage
and aggrecan that imparts resilience to the tissue were
used as measures of chondrocyte function. Co-administra-
tion of TNF-α and EGF in the present study resulted in a
marked increase in the proportion of elongated cells and an
additive decrease in matrix gene expression. These
changes in morphology and gene expression were found to
be controlled in part by the MAPK pathway. Furthermore,
EGF exerts its effects on matrix gene expression through a
pathway independent of Sox-9.
Materials and methods
Primary cell culture
Articular chondrocytes were isolated from the distal femo-
ral condyles of 1-day-old Sprague–Dawley rats (Charles
River, St Hyacinthe, QC, Canada) as previously described
[12]. The Animal Use Subcommittee of the University of
Western Ontario Council on Animal Care approved the use
of rats for these studies. Cells were plated at a density of
4.25 × 10⁴ cells/cm2 on tissue culture-treated plates (Fal-
con; BD Biosciences, Mississauga, ON, Canada) and cul-
tured in RPMI 1640 media supplemented with 5% fetal
bovine serum, 100 U/ml penicillin, 100 U/ml streptomycin
and 10 mM HEPES (Invitrogen Life Technologies Inc., Bur-
lington, ON, Canada). Culture media was replaced every 3
days. Culture medium was replaced with serum-free
medium 16–20 hours prior to experiments.
Primary chondrocyte cultures were treated with TNF-α (30
ng/ml; Sigma Aldrich, Oakville, ON, Canada), with EGF (10
ng/ml; Sigma Aldrich) or with vehicle (phosphate-buffered
saline + 0.01% bovine albumin; Roche Diagnostics, Laval,
QC, Canada) in serum-free medium. These concentrations
were previously found to elicit maximal responses from
these cells [6,12]. For analysis of signaling pathways, cells
were treated prior to addition of TNF-α or EGF with phar-
macologic inhibitors including 2-[1-(3-dimethylaminopro-
pyl)-1H-indol-3-yl]-3-(1H-indol-3-yl)-maleimide (10 µM
bisindolylmaleimide [BIS] I, protein kinase C [PKC] inhibi-
tor), or 2,3-bis(1H-indol-3-yl)-N-methylmaleimide (10 µM
BIS V, inactive analog of BIS I), 1,4-diamino-2,3-dicyano-
1,4-bis(2-aminophenylthio)-butadiene (10 µM U0126,
mitogen-activated protein kinase kinase 1 and 2 [MEK1/2]
inhibitor; Promega, Madison, WI, USA), and 1,4-diamino-
2,3-dicyano-1,4-bis(methylthio)-butadiene (10 µM U0124,
inactive analog of U0126). BIS I was used at a concentra-
tion that was greater than 500 times the inhibitory concen-
tration 50% for conventional PKCs and twice the inhibitory
concentration 50% for PKCζ. U0126 was used at a con-
centration previously found to be effective for inhibiting the
phosphorylation of ERK1/2 [12]. The pharmacologic
agents were obtained from EMD Biosciences (Calbio-
chem, La Jolla, CA, USA) unless otherwise stated.
Imaging
Digital images of confluent monolayers were obtained
using a Sony Power HAD 3CCD mounted onto a Nikon
TMS inverted phase-contrast microscope (20 × objective
magnification) (Nikon Canada Inc., Mississauga, ON, Can-
ada). Images were acquired with NorthernEclipse V.5 soft-
ware (Empix, Mississauga, ON, Canada). For the present
study, an elongated cell was defined as having a predomi-
nant axis length exceeding three times the maximum width
of the cell. The number of elongated cells per field of view
(1.376 mm2) was counted and averaged.
RNA extraction and northern blot analysis
Total RNA was collected from cells using the acid–guanid-
ium–phenol–chloroform extraction method (Trizol; Invitro-
gen Life Technologies Inc.), according to the
manufacturer's instructions. RNA was quantified by ultravi-
olet spectrophotometry. Total RNA (10 µg) was resolved
on a 1.1% agarose gel containing formaldehyde. Equiva-
lent loading of samples was verified by ethidium bromide
staining before RNA was transferred to Nytran membranes
(Schleicher & Schuell, Keene, NH, USA). RNA was fixed to
the Nytran membrane by incubation at 80°C for 2.5 hours
under vacuum. cDNA probes corresponding to the mouse

Available online http://arthritis-research.com/content/7/1/R127
R129
C-propeptide of type II collagen (pKN225) [16], to 18S
rRNA (DECAtemplate 18S mouse; Ambion, Austin, TX,
USA), and to the C-terminus of rat aggrecan [17,18] were
labeled with [α32P]dCTP (3000 Ci/mmol; Perkin Elmer,
Woodbridge, ON, Canada) by a random-primed oligonu-
cleotide method (Prime-a-gene labeling kit; Promega).
Membranes were hybridized with cDNA probes and proc-
essed as described previously [19].
Preparation of cell extracts and immunoblotting
Cell extracts were prepared as described previously [12].
Equivalent amounts of protein (15–30 µg) were resolved
by electrophoresis on 7.5% polyacrylamide-SDS gels. Pro-
tein was transferred to nitrocellulose membrane (Sch-
leicher & Schuell) by electroblotting. Transfer and
equivalent loading was verified by subsequent staining with
Ponceau Red (3-hydroxy-4-(2-sulfo-4-[4-sulfophenylazo]-
phenylazo)-2,7-napthalenedisulfonic acid) [20]. Immunob-
lotting was performed by blocking the membrane for 1 hour
with 5% non-fat milk (Carnation, North York, ON, Canada)/
TBS 0.5% Tween. Membranes were incubated with anti-
bodies for poly(ADP ribose) polymerase (PARP) (Santa
Cruz Biotechnology, Santa Cruz, CA, USA), phospho-spe-
cific ERK1/2 (Anti-active MAPK; Promega) or ERK1 and
ERK2 (Santa Cruz Biotechnology) according to the manu-
facturer's instructions. Target signals were detected with
SuperSignal West Pico Chemiluminescent Substrate
(Pierce Biotechnology Inc., Rockford, IL, USA) and expo-
sure to Hyperfilm ECL (Amersham Biosciences, Baie
d'Urfé, QC, Canada).
Apoptosis analysis
Cells were seeded on Permanox chamber slides (Nalge
Nunc, Naperville, IL, USA) at a density of 550 cells/mm2.
Following treatment with factors, slides were fixed with 4%
formalin solution. Apoptosis was assessed by the terminal
deoxynucleotidyltransferase end-labeling with fluorescein-
dUTP (TUNEL) method (Roche Diagnostics) as described
in the manufacturer's instructions. Positive controls were
treated for 10 min with DNAse I (Roche Diagnostics) to
induce DNA breaks. Fluorescein activity was imaged by
laser scanning confocal microscopy (LSM 510 Meta; Carl
Zeiss Microscopy, Jena, Germany).
MTT assay for cell viability
Cell viability was analyzed using the Cell Proliferation Kit I
(MTT; Roche Diagnostics) following the manufacturer's
instructions. Cells were seeded on 96-well plates at 400
cells/mm2, were cultured for 5 days and were then treated
with TNF-α, or with EGF, or with TNF-α + EGF for an addi-
tional 24 hours. The colorimetric reaction was read on a
µQuant spectrophotometer (Bio-Tek Instruments,
Winooski, VT, USA) at 550 nm and 690 nm. The reading at
690 nm was used as a reference wavelength to calculate a
corrected absorbance (A550 – A690).
Transfections and luciferase reporter analysis
Chondrocytes were transfected with reporter constructs
for NF-κB (Clontech, Palo Alto, CA, USA) or the type II col-
lagen enhancer region (pGl3 4 × 48; a kind gift from Dr TM
Underhill, The University of British Columbia, Vancouver,
BC, Canada) [21]. Briefly, per transfection reaction, 0.1 µg
reporter DNA and 2 ng PRL-SV40, a constitutively
expressed renilla luciferase plasmid for monitoring trans-
fection efficiency, were incubated with Fugene 6 transfec-
tion reagent (Roche Diagnostics). The mixture was added
to a well of a 48-well plate and overlayed with 3.5 × 10⁴
cells in serum-free culture medium. After 5 hours, medium
containing serum was added to the wells. The following
day, cells were treated with TNF-α (30 ng/ml), with EGF
(10 ng/ml), with a combination of both or with vehicle in
serum-free medium for 24 hours. The cells were lysed with
1 × Reporter Lysis Buffer (Promega) and luciferase activity
quantified using the Dual Luciferase Assay System
(Promega).
Nuclear extract preparation and electrophoretic mobility
shift assays
Isolation of nuclear extracts and the electrophoretic mobil-
ity shift assay were performed as previously described
[12,22]. The double-stranded oligonucleotide containing
the κB recognition sequence was purchased from Santa
Cruz Biotechnology.
Densitometry and statistical analysis
All data are representative of at least three independent
experiments. Bands appearing on exposed film were ana-
lyzed using Kodak Digital Science software (Eastman
Kodak, Rochester, NY, USA). Relative expression levels of
type II collagen mRNA and aggrecan mRNA were stand-
ardized to the expression levels of 18S rRNA. One-way
analysis of variance or repeated-measures analysis of vari-
ance followed by Tukey–Kramer post-test comparisons
was performed to determine the statistical significance of
differences among means (GraphPad Prism version 3.00;
GraphPad Software, San Diego, CA, USA).
Results
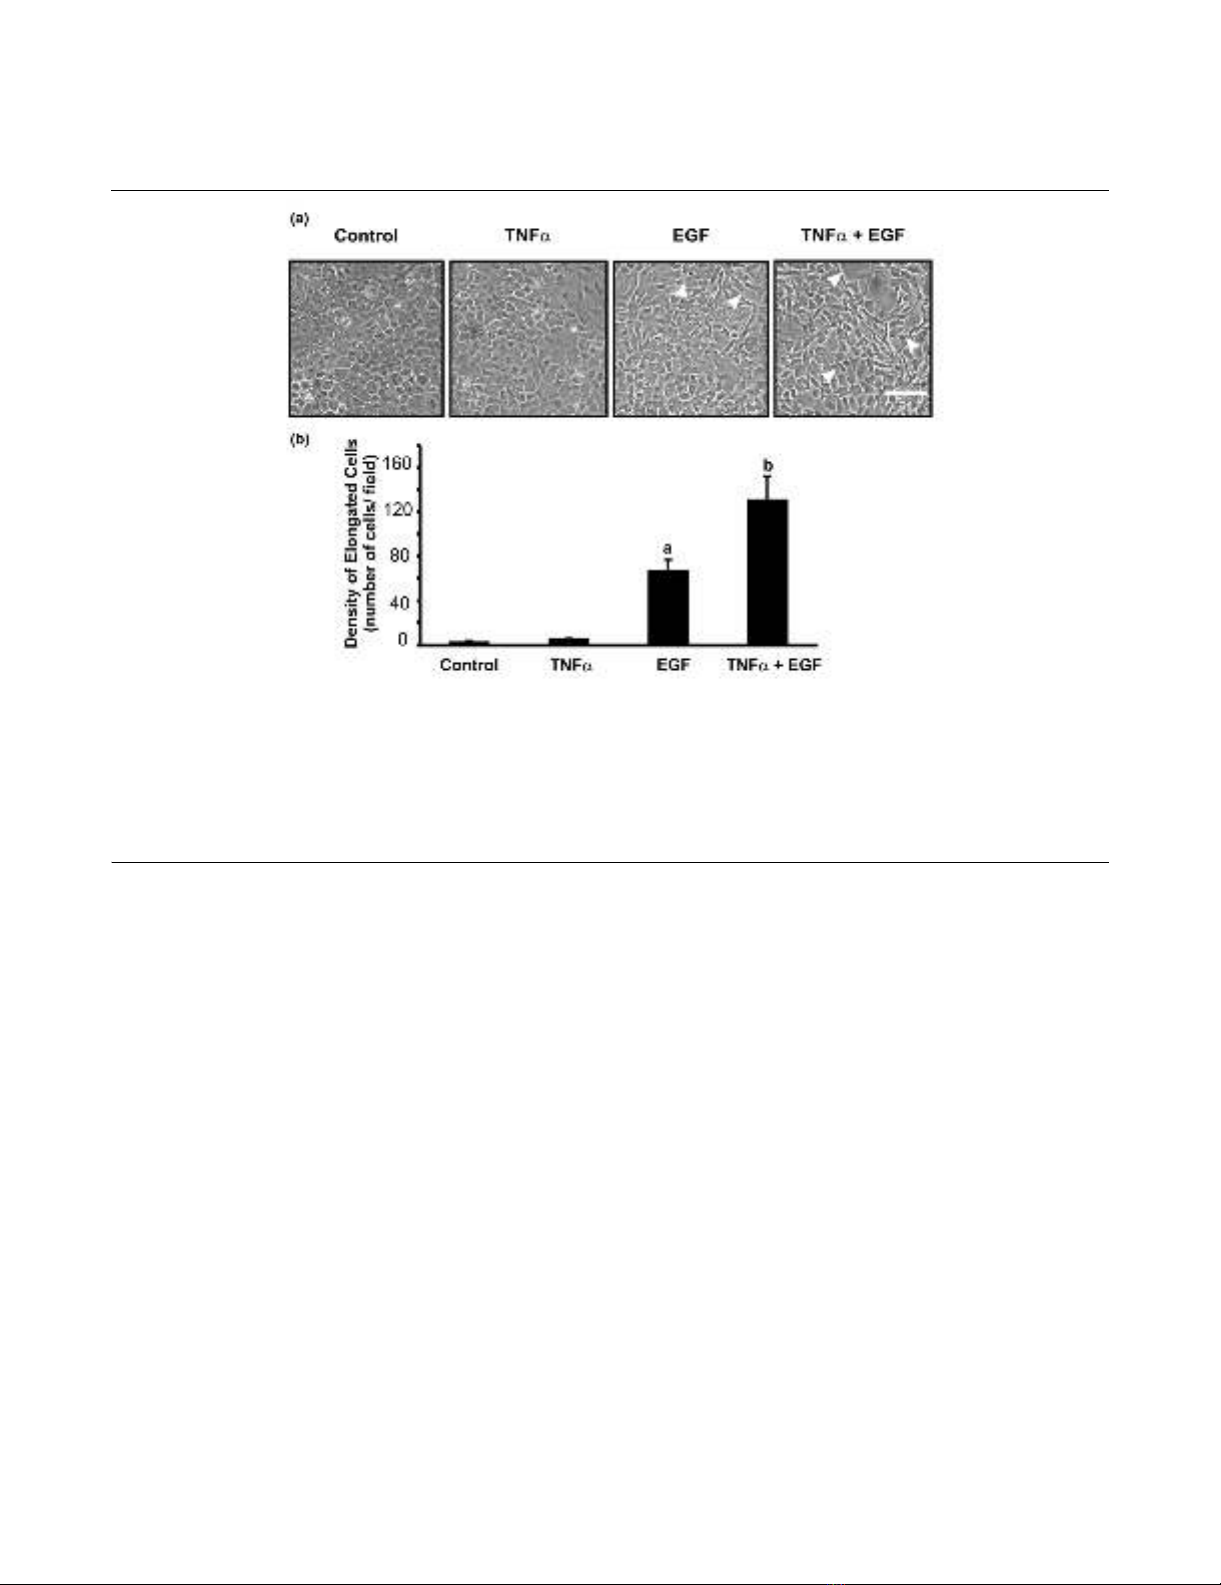
Effects of TNF-α and EGF on chondrocyte morphology
The cellular morphology reflects the differentiation status of
cells such as chondrocytes. For example, a change from a
rounded to a more elongated morphology in response to
EGF by CFK2 chondrocytic cells is associated with a
diminished onset of expression of aggrecan and link protein
gene [2]. To determine whether the morphology of primary
chondrocytes expressing the matrix was affected by TNF-α
or EGF, live cultures were examined by phase-contrast
microscopy (Fig. 1a) and the number of elongated cells per
field was quantified (Fig. 1b).
Arthritis Research & Therapy Vol 7 No 1 Klooster and Bernier
R130
Previous studies established concentrations for TNF-α (30
ng/ml) [12] and EGF (10 ng/ml) [6] for maximal activation
of signaling pathways in primary chondrocytes. Following a
24-hour treatment with vehicle (control) or TNF-α, the mon-
olayers exhibited a 'cobblestone' appearance. In contrast,
treatment with EGF promoted cell elongation, a change
that was significantly potentiated by the presence of TNF-
α. The distribution and arrangement of actin filaments were
analyzed by phalloidin labeling. An increase in stress fibers
was observed in elongated cells; however, the density of
cells and prevalence of filamentous actin throughout the
monolayer precluded any further quantitative analysis (data
not shown).
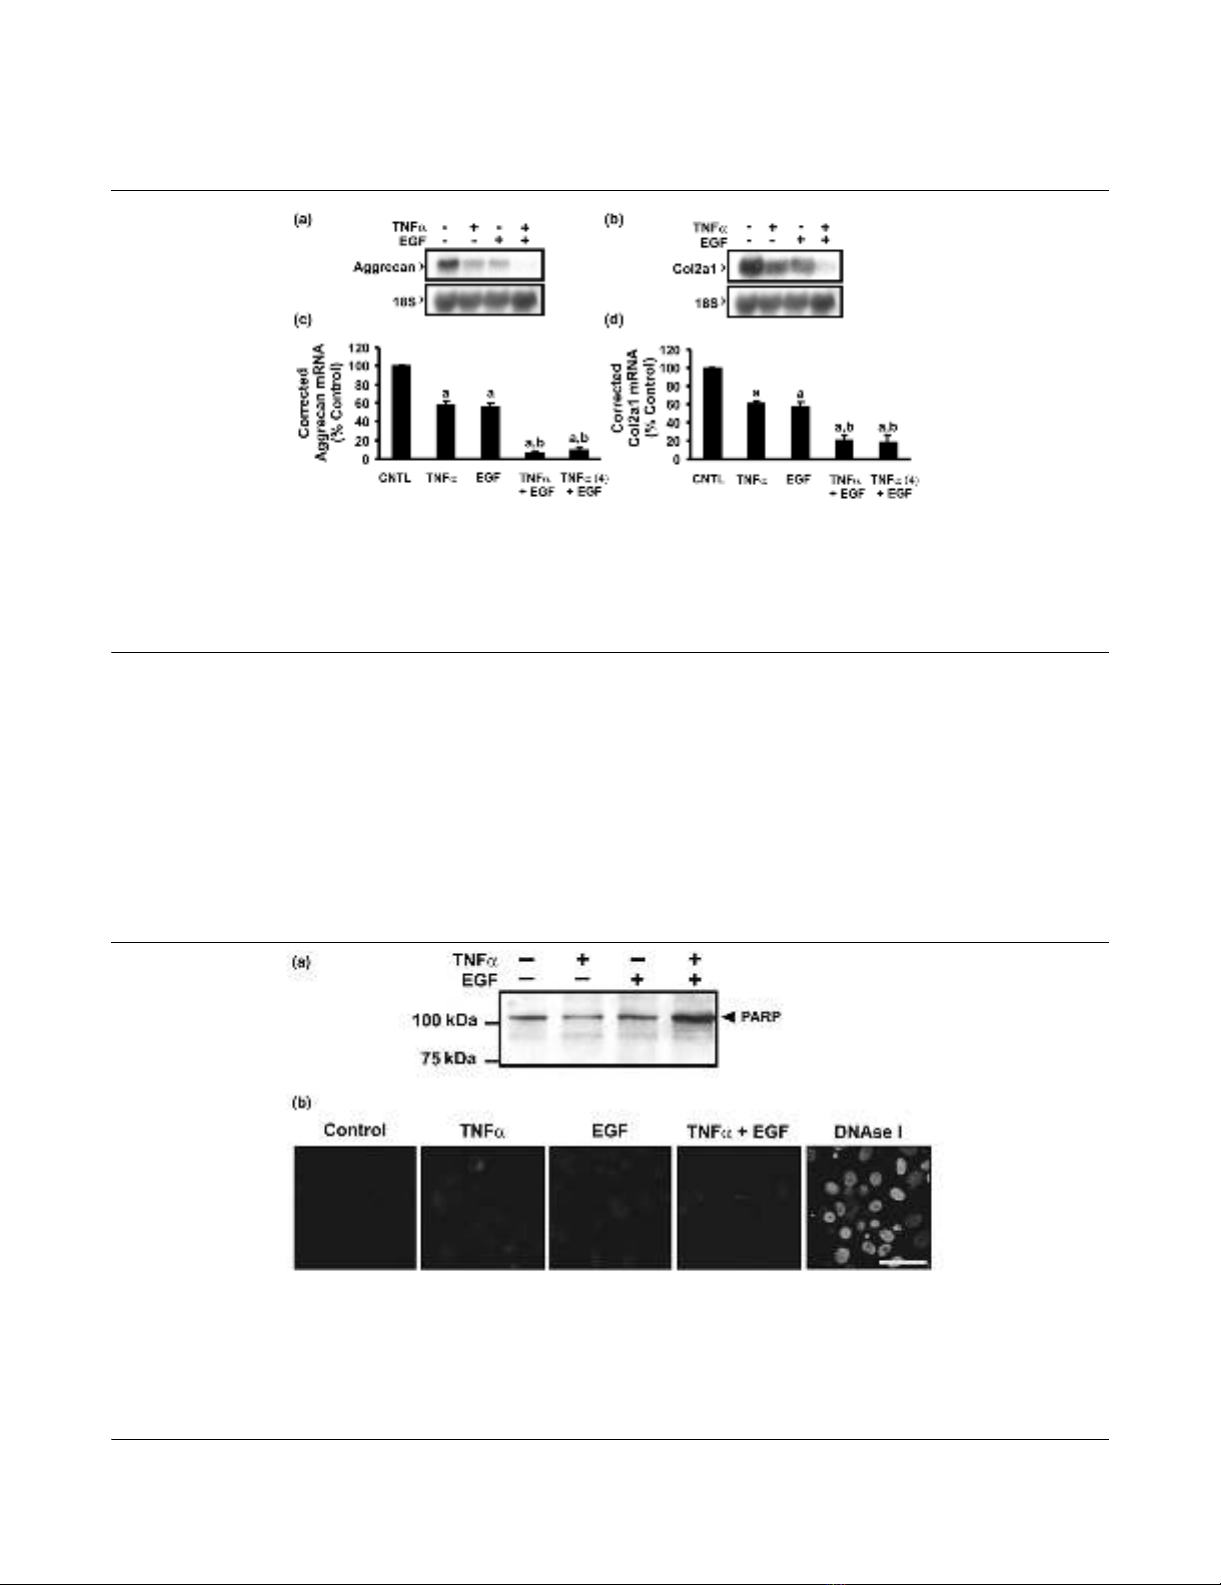
Effects of TNF-α and EGF on levels of aggrecan and type
II collagen mRNA
We previously demonstrated that TNF-α reduces transcrip-
tional expression of type II collagen and link protein genes
[12]. In the present study, we characterized the effect of
TNF-α on aggrecan mRNA levels and determined whether
EGF altered type II collagen and aggrecan mRNA levels in
the presence or absence of TNF-α. Cultures were treated
with TNF-α or EGF individually or in combination (TNF-α +
EGF) and the levels of aggrecan and type II collagen mRNA
were analyzed (Fig. 2). Following 24 hours of treatment
with TNF-α, levels of aggrecan and type II collagen mRNA
were decreased by 42 ± 4% and 39 ± 2%, respectively.
EGF alone decreased levels of aggrecan and type II colla-
gen mRNA by 44 ± 5% and 42 ± 4%, respectively. Treat-
ment of chondrocytes with TNF-α + EGF resulted in
additive losses of aggrecan and type II collagen mRNA (93
± 2% and 79 ± 4%, respectively). Treatment with TNF-α
for 4 hours prior to the addition of EGF for the remainder of
the 24 hours resulted in comparable decreases in levels of
aggrecan and type II collagen mRNA (89 ± 2% and 81 ±
7%, respectively; data not shown). The combination of
TNF-α and EGF therefore produces an additive decrease
in both aggrecan and type II collagen mRNA levels, sug-
gestive of discrete signals regulating mRNA expression by
each factor.
TNF-α and EGF do not alter the extent of apoptosis in the
chondrocyte culture
Cultures treated with TNF-α, with EGF or with TNF-α +
EGF were assessed for evidence of apoptosis using an
early marker, PARP (Fig. 3a). PARP is a 116 kDa protein
involved in DNA repair [23] that is cleaved as part of the
caspase cascade initiated in cells undergoing apoptosis.
Cell extracts were immunoblotted for the presence of intact
and cleaved forms of PARP. Neither loss of intact PARP
Figure 1
Tumor necrosis factor alpha (TNF-α) enhances elongated cell morphology induced by epidermal growth factor (EGF)Tumor necrosis factor alpha (TNF-α) enhances elongated cell morphology induced by epidermal growth factor (EGF). Confluent monolayers of
chondrocytes were treated with vehicle, TNF-α (30 ng/ml), EGF (10 ng/ml) or TNF-α + EGF for 24 hours. (a) Cell morphology was observed by
phase contrast microscopy. Arrowheads indicate spinous processes that appear following incubation with EGF or TNF-α + EGF. An elongated cell
is defined as having a predominant axis with a length exceeding three times the maximum width of the cell. Digital images of live cultures were cap-
tured at 20 × objective magnification. Bar = 100 µm. Images shown are representative of three independent experiments. (b) The total number of
elongated cells per field (1.376 mm2) were counted, averaged for at least three independent experiments (n = 3–5), and analyzed by analysis of var-
iance. a Significant difference from control (P < 0.01), b significant difference from control (P < 0.001) and significant difference from EGF-treated
cells (P < 0.01).
Available online http://arthritis-research.com/content/7/1/R127
R131
nor the appearance of cleaved moieties (85 kDa) was
detected following 24 hours of treatment with TNF-α, with
EGF or with TNF-α + EGF. Interestingly, TNF-α + EGF
increased the amount of PARP present in the chondro-
cytes. To confirm the lack of apoptosis in factor-treated cul-
tures, the presence of DNA strand breaks was evaluated by
in situ labeling (TUNEL) (Fig. 3b). TUNEL labeling was not
detected following any of the treatments.
Cell viability was also assessed using the MTT assay (Fig.
4). TNF-α did not significantly alter cell viability after 24
hours. EGF caused an increase in metabolism of the tetra-
zolium salt at 24 hours that was not, however, changed sig-
nificantly by co-addition of TNF-α, probably reflecting an
increase in chondrocyte number. These results suggest
that reduction in aggrecan and type II collagen mRNA lev-
els induced by TNF-α and EGF are not correlated with
initiation of programmed cell death (Fig. 3) or a decrease in
cell number (Fig. 4).
Figure 2
Tumor necrosis factor alpha (TNF-α) + epidermal growth factor (EGF) results in additive reduction in levels of aggrecan and type II collagen mRNATumor necrosis factor alpha (TNF-α) + epidermal growth factor (EGF) results in additive reduction in levels of aggrecan and type II collagen mRNA.
Confluent monolayers of chondrocytes were treated for 24 hours with vehicle (CNTL), TNF-α (30 ng/ml), EGF (10 ng/ml) or TNF-α + EGF (n = 12).
Levels of (a) aggrecan and (b) type II collagen mRNA were analyzed by northern blot of total RNA (10 µg). Changes in levels of (c) aggrecan and
(d) type II collagen mRNA were quantified by densitometry. Levels were normalized to levels of 18S rRNA and data are expressed as the percentage
of control ± standard error of the mean. a Significant difference from control (P < 0.001), b significant difference from TNF-α-treated and EGF-treated
populations (P < 0.001).
Figure 3
Apoptosis is not observed following tumor necrosis factor alpha (TNF-α) and/or epidermal growth factor (EGF) treatmentApoptosis is not observed following tumor necrosis factor alpha (TNF-α) and/or epidermal growth factor (EGF) treatment. Confluent monolayers of
chondrocytes were treated with vehicle, TNF-α (30 ng/ml), EGF (10 ng/ml) or TNF-α + EGF for 24 hours. (a) Early stages of apoptosis were
assayed by immunoblot with an antibody specific for intact and cleaved forms of poly(ADP ribose) polymerase (PARP). No cleavage of PARP (i.e.
appearance of a band at 89 kDa) was detected following any of the treatments. Blot shown is representative of three independent experiments. (b)
Apoptosis-induced DNA strand breaks were examined by in situ labeling (terminal deoxynucleotidyl transferase-mediated dUTP nick end-labeling
[TUNEL]) and imaged using confocal microscopy. No TUNEL labeling was detected with any of the treatments. Cells treated with DNAse I to induce
DNA breaks served as a positive control. Bar = 50 µm. Images are representative of three independent experiments.


