
REGULAR ARTICLE
Eddy current testing system for bottom mounted
instrumentation welds
Noriyasu Kobayashi
1*
, Souichi Ueno
1
, Naotaka Suganuma
1
, Tatsuya Oodake
2
, Takeshi Maehara
3
, Takashi Kasuya
3
,
and Hiroya Ichikawa
4
1
Power and Industrial Systems Research and Development Center, Toshiba Corporation, 8, Shinsugita-cho, Isogo-ku, Yokohama
235-8523, Japan
2
Power and Industrial Systems Research and Development Center, Toshiba Corporation, 1, Komukaitoshiba-cho, Saiwai-ku,
Kawasaki 212-8581, Japan
3
Keihin Product Operations, Toshiba Corporation, 2-4, Suehiro-cho, Tsurumi-ku, Yokohama 230-0045, Japan
4
Isogo Nuclear Engineering Center, Toshiba Corporation, 8, Shinsugita-cho, Isogo-ku, Yokohama 235-8523, Japan
Received: 19 June 2015 / Received in final form: 18 August 2015 / Accepted: 27 August 2015
Published online: 05 December 2015
Abstract. The capability of eddy current testing (ECT) for the bottom mounted instrumentation (BMI) weld
area of reactor vessel in a pressurized water reactor was demonstrated by the developed ECT system and
procedure. It is difficult to position and move the probe on the BMI weld area because the area has complexly
curved surfaces. The space coordinates and the normal vectors at the scanning points were calculated as the
scanning trajectory of probe based on the measured results of surface shape on the BMI mock-up. The multi-axis
robot was used to move the probe on the mock-up. Each motion-axis position of the robot corresponding to each
scanning point was calculated by the inverse kinematic algorithm. In the mock-up test, the probe was properly
contacted with most of the weld surfaces. The artificial stress corrosion cracking of approximately 6 mm in length
and the electrical-discharge machining slit of 0.5 mm in length, 1 mm in depth and 0.2 mm in width given on the
weld surface were detected. From the probe output voltage, it was estimated that the average probe tilt angle on
the surface under scanning was 2.6°.
1 Introduction
Eddy current testing (ECT) techniques to detect a defect,
especially a stress corrosion cracking (SCC), on a reactor
vessel (RV) and reactor internals have been developed as one
of the surface inspection methods for nuclear power plants
[1–7]. As a part of maintenance methods for the RV and
reactor internals, laser peening and underwater laser beam
welding techniques to prevent and repair from the SCC have
been developed [8–11]. These inspection and maintenance
techniques can contribute to shorten their work period,
including the initial set-up because it is possible to work
underwater without draining the reactor coolant. In order to
provide faster services, the defect detection capability of the
ECT probe using the cross coil has been estimated for the
inspection before and/or after the underwater laser beam
welding for the dissimilar metal welding area at the RV nozzle
in pressurized water reactors (PWRs) [12–14]. The ECT
system, including thesmall ECT probe and the probe moving
equipment based on the portable laser peening system, has
been developed for the bottom mounted instrumentation
(BMI) weld area in PWRs [15]. In this development, the SCC
detection capability of the system was demonstrated by
moving the probe on the area of 10 mm 6 mm of the BMI
mock-up [15].
More precise probe action control is required to move
the probe on the whole BMI weld area because the area has
complexly curved surface and the narrow spaces. We
measured the surface shape of weld area using the laser
displacement meter and made the scanning trajectory of
the probe based on the shape measurement data of the
complex surface. As a BMI mock-up test, the ECT probe
was automatically moved on the whole BMI weld area by
the multi-axis robot. From the test results, we evaluated
the defect detection capability of the ECT system and the
probe tilt angle on the weld surface under scanning. In this
paper, we describe the procedure of BMI mock-up test; the
results of measuring weld surface shape and defect
detection tests.
*e-mail: noriyasu.kobayashi@toshiba.co.jp
EPJ Nuclear Sci. Technol. 1, 4 (2015)
©N. Kobayashi et al., published by EDP Sciences, 2015
DOI: 10.1051/epjn/e2015-50043-1
Nuclear
Sciences
& Technologies
Available online at:
http://www.epj-n.org
This is an Open Access article distributed under the terms of the Creative Commons Attribution License (http://creativecommons.org/licenses/by/4.0),
which permits unrestricted use, distribution, and reproduction in any medium, provided the original work is properly cited.
2 Weld surface shape measurement
2.1 Procedure of BMI mock-up test
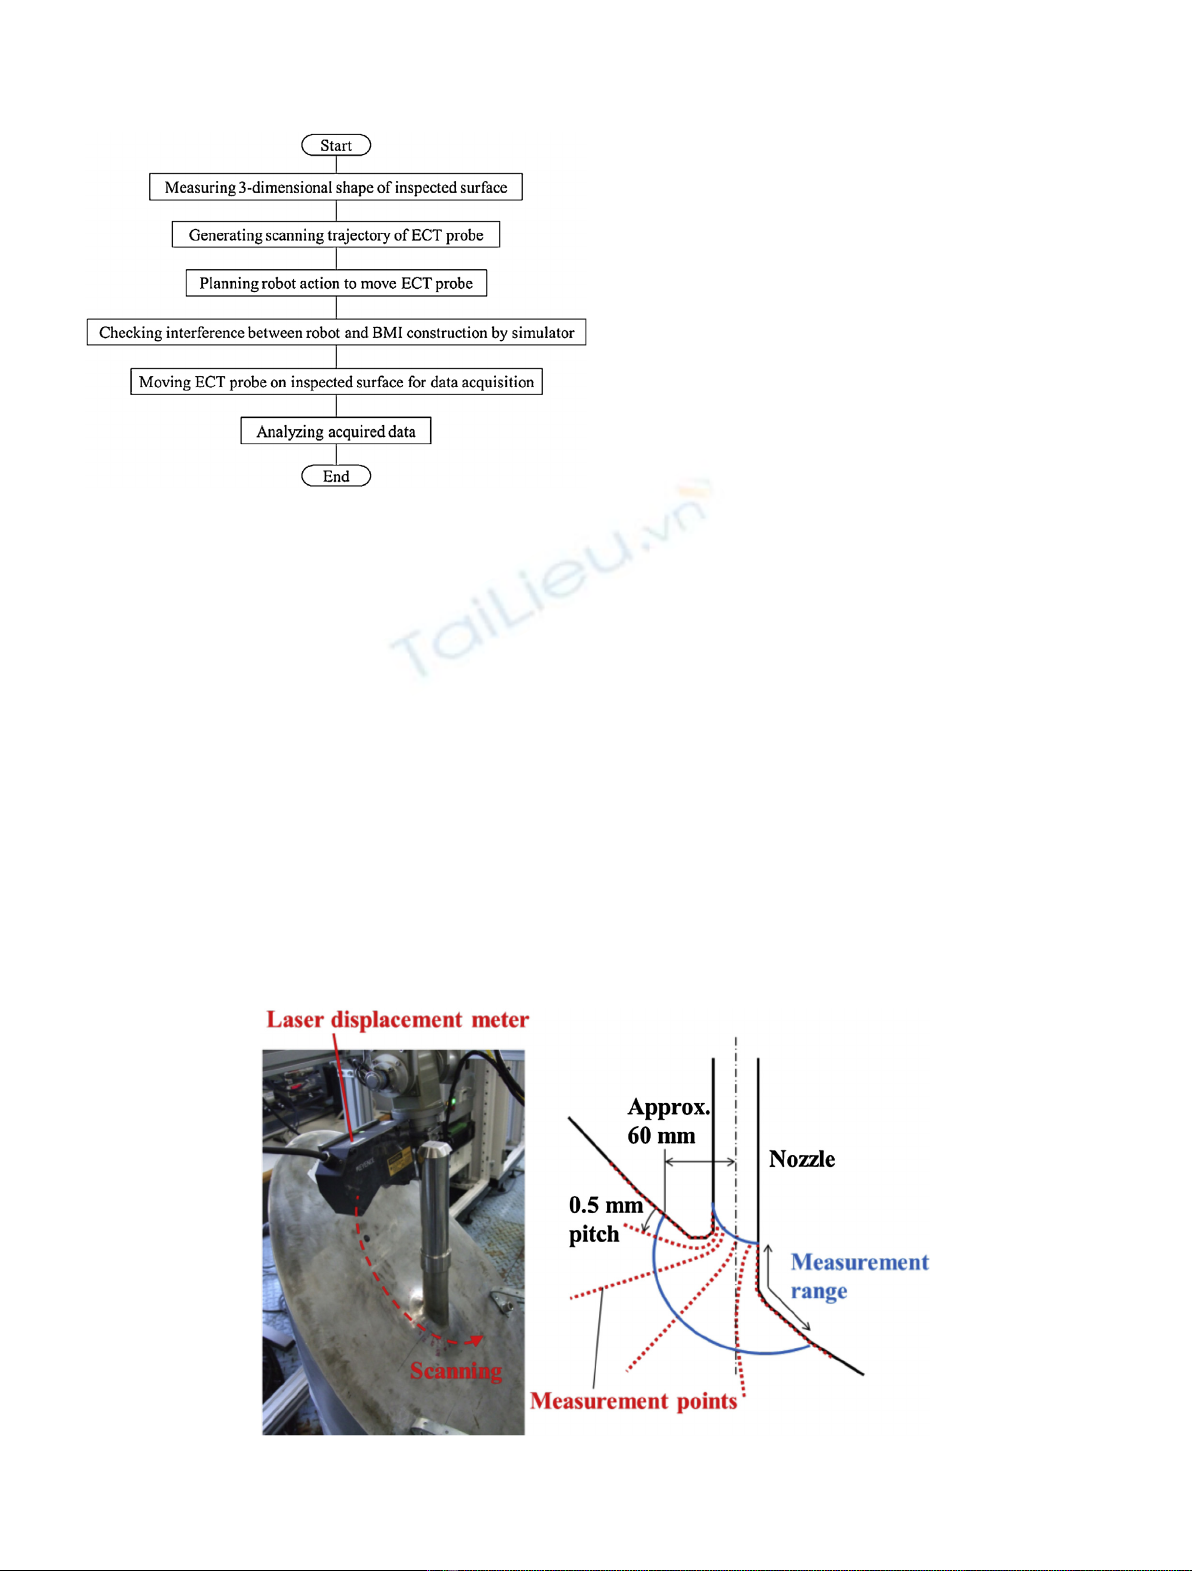
A process flow diagram of an ECT for BMI welds is shown
in Figure 1. The three-dimensional shape of inspected weld
surface was measured in order to generate the precise
scanning trajectory of ECT probe. After generating the
trajectory, the action of multi-axis robot, which moves the
probe along the scanning trajectory on the weld surface,
was planned and checked for the interference between the
robot and the BMI mock-up. The probe was moved on the
whole BMI weld area by the robot to acquire the ECT
defect detection data. Finally, we analyzed the acquired
data, including the signal processing for noise rejection and
signal identification.
2.2 Measurement of surface shape
We measured the surface shape of the weld area on the
BMI mock-up for generating the scanning trajectory of
ECT probe. A half of weld area was the target for scanning
by the ECT probe because the mock-up is axisymmetric.
The measurement range of surface shape is the half side of
weld area and within approximately 60 mm in radius
centering on the BMI nozzle as shown in Figure 2.The
sensor head of laser displacement meter (KEYENCE,
LJ-G200) mounted on the multi-axis robot measured the
three-dimensional surface shape in an approximately
0.5 mm interval at the points of approximately 60 mm
from the center of nozzle within the measurement range.
The sensor head rotated round trip half side around the
nozzle. The laser spot size is 180 mm70 mm. The base
work distance is 200 ±48 mm.
2.3 Scanning trajectory of probe
The space coordinates and the normal vectors at the scanning
points as the scanning trajectory of ECT probe on welds were
generatedbased on the measured results of weld surface shape
on the BMI mock-up. The calculated results of the trajectory
were shown in Figure 3. The blue range in Figure 3 is the
measured surface shape. The red arrows indicate the
calculated results of normal vector for determining the probe
angles at the scanning points. The probe is set on the
inspected surface, as the probe central axis is adjusted to
coincide with the normal vector at each scanning point.
2.4 Multi-axis robot
The multi-axis robot, which moves the ECT probe, is
shown in Figure 4. The robot has three translation axes and
Fig. 1. Process flow diagram of ECT for BMI welds.
Fig. 2. Measurement of weld surface shape on BMI mock-up.
2 N. Kobayashi et al.: EPJ Nuclear Sci. Technol. 1, 4 (2015)
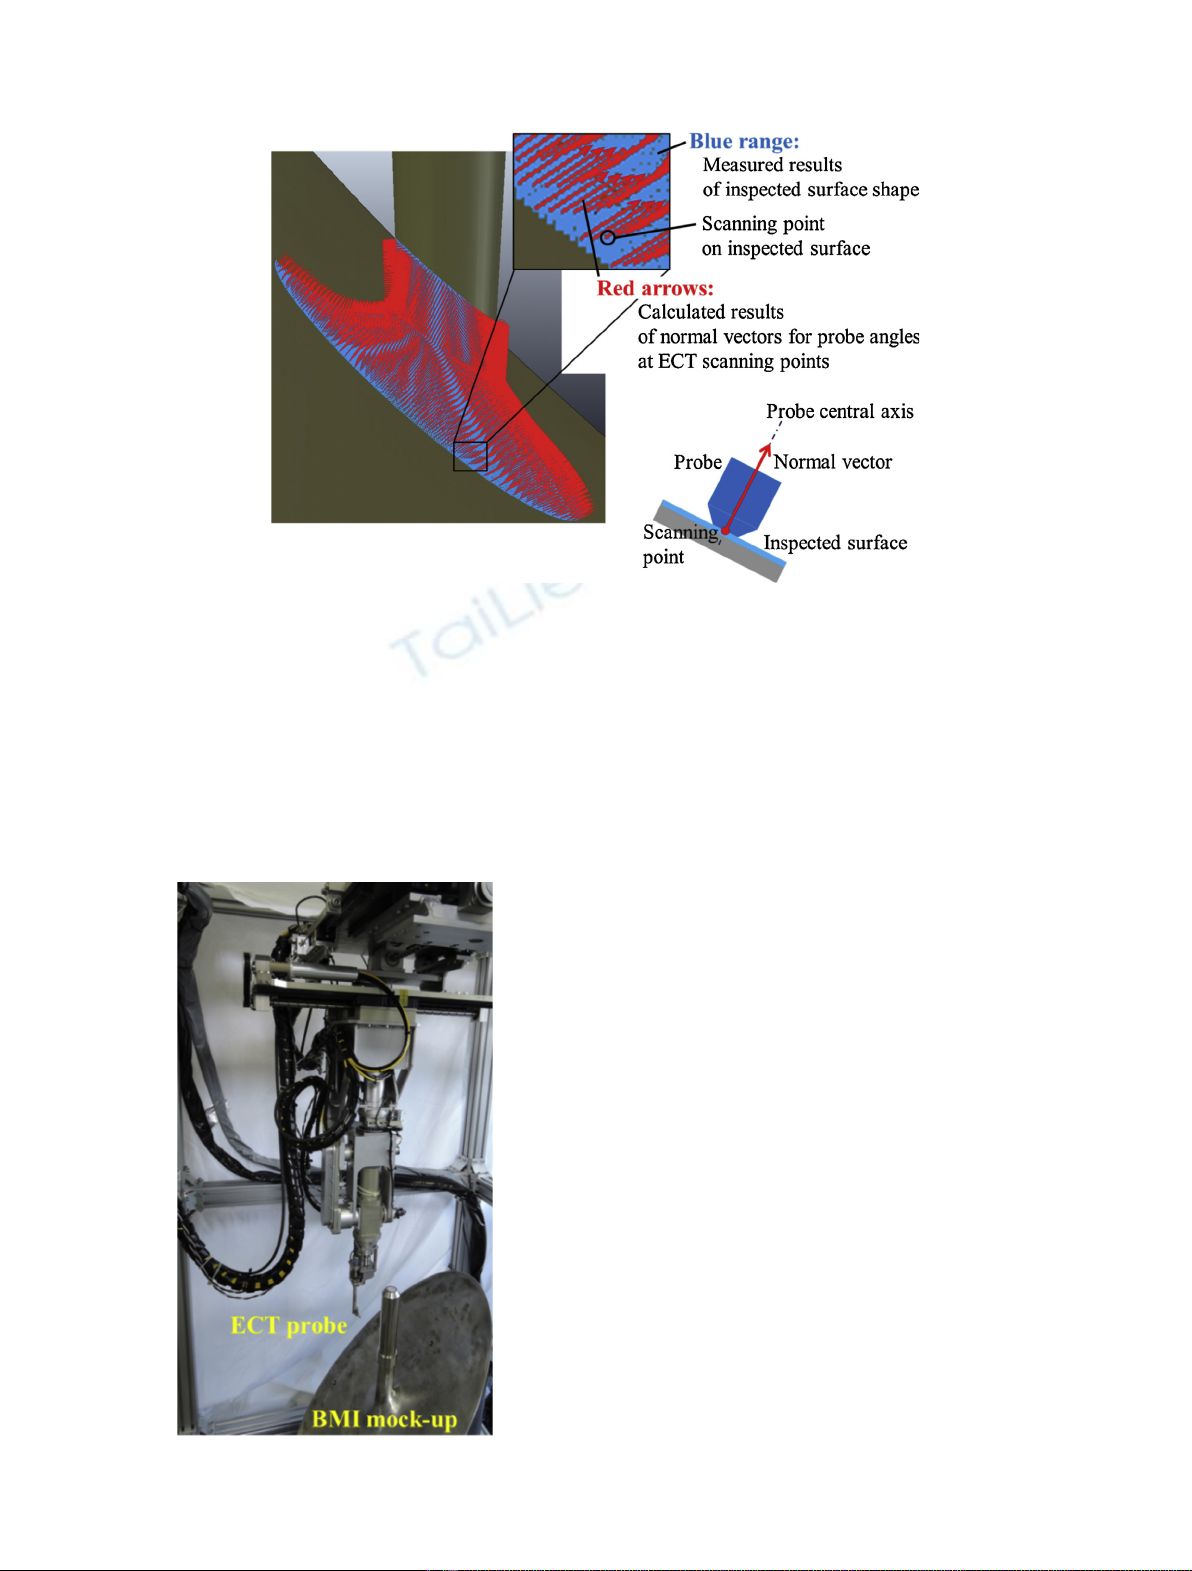
four rotation axes. The probe was mounted on the end of
the robot arm. Each motion axis position as a robot action
corresponding to each scanning point was calculated by the
inverse kinematic algorithm. After the two rotating motion
axis positions were provided as the constant values, the
other motion axis positions were led in the calculation. The
probe-scanning trajectory shown in Figure 3 was divided
into the three ranges (nozzle, J-welds and build-up welds)
as shown in Figure 5. The three different algorithms for the
three ranges were used to prevent from the interference
between the robot and the BMI mock-up. It was confirmed
not to interfere between the robot and the mock-up using
the three-dimensional simulator before the mock-up test.
3 Experimental apparatus and methods
3.1 ECT system
A block diagram of the ECT system is shown in Figure 6.
This system consists of the ECT probe, the multi-axis
robot, the robot controller, the ECT data acquisition
system and the ECT data analysis system. The probe was
moved to a start point of scanning manually. As soon as a
scanning was started under the order from the robot
controller, the ECT data acquisition system received the
coordinate data of the start point from the controller and
voltage signals from the probe. After the acquisition system
paired the coordinate data with the voltage signals and
saved them into a memory, the acquisition system sent an
acquisition end signal at the start point to the controller.
The controller automatically moved the probe to the next
scanning point using the multi-axis robot based on the
probe-scanning trajectory. These movements were repeated
until the entire scanning is completed. The ECT data
analysis system read the scanning coordinate data and the
probe output signals, and conducted the signal processing
and displayed the inspected results.
3.2 BMI mock-up and scanning range
A schematic of the BMI mock-up simulating the outermost
nozzle at the bottom of RV is shown in Figure 7 [15]. The
nozzle was fixed to the bottom of RV by a tungsten inert gas
Fig. 3. Scanning trajectory of ECT probe.
Fig. 4. Multi-axis robot.
N. Kobayashi et al.: EPJ Nuclear Sci. Technol. 1, 4 (2015) 3
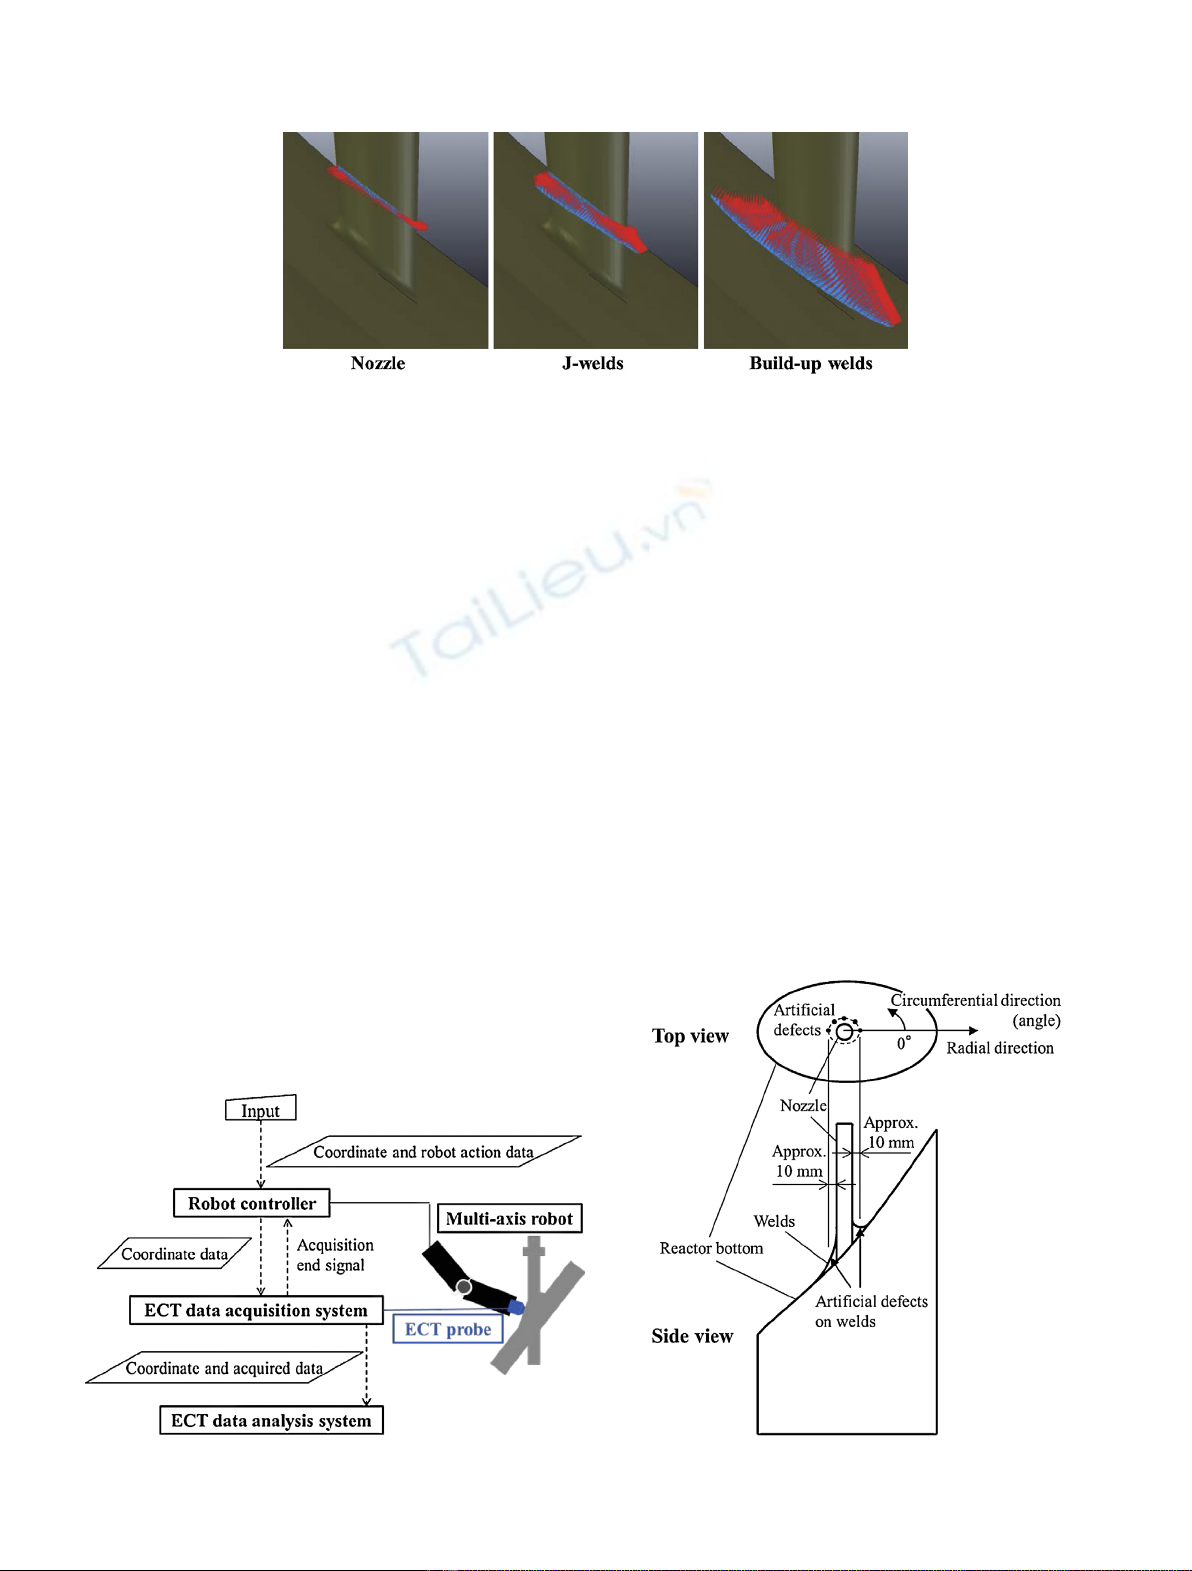
(TIG) welding. The surface of weld area was machined
smoothly. Both the nozzle and the weld metal are made of
alloy 600. Artificial and circumferential defects were given
on the weld surface at the points of 10 mm from the outer
surface of nozzle. The type and size of defects are described
in Table 1. It was defined that the top of the mock-up is at 0°
in circumferential angle as shown in Figure 7. The length of
SCC shown in Table 1 is the value of indication on
penetrant testing (PT).
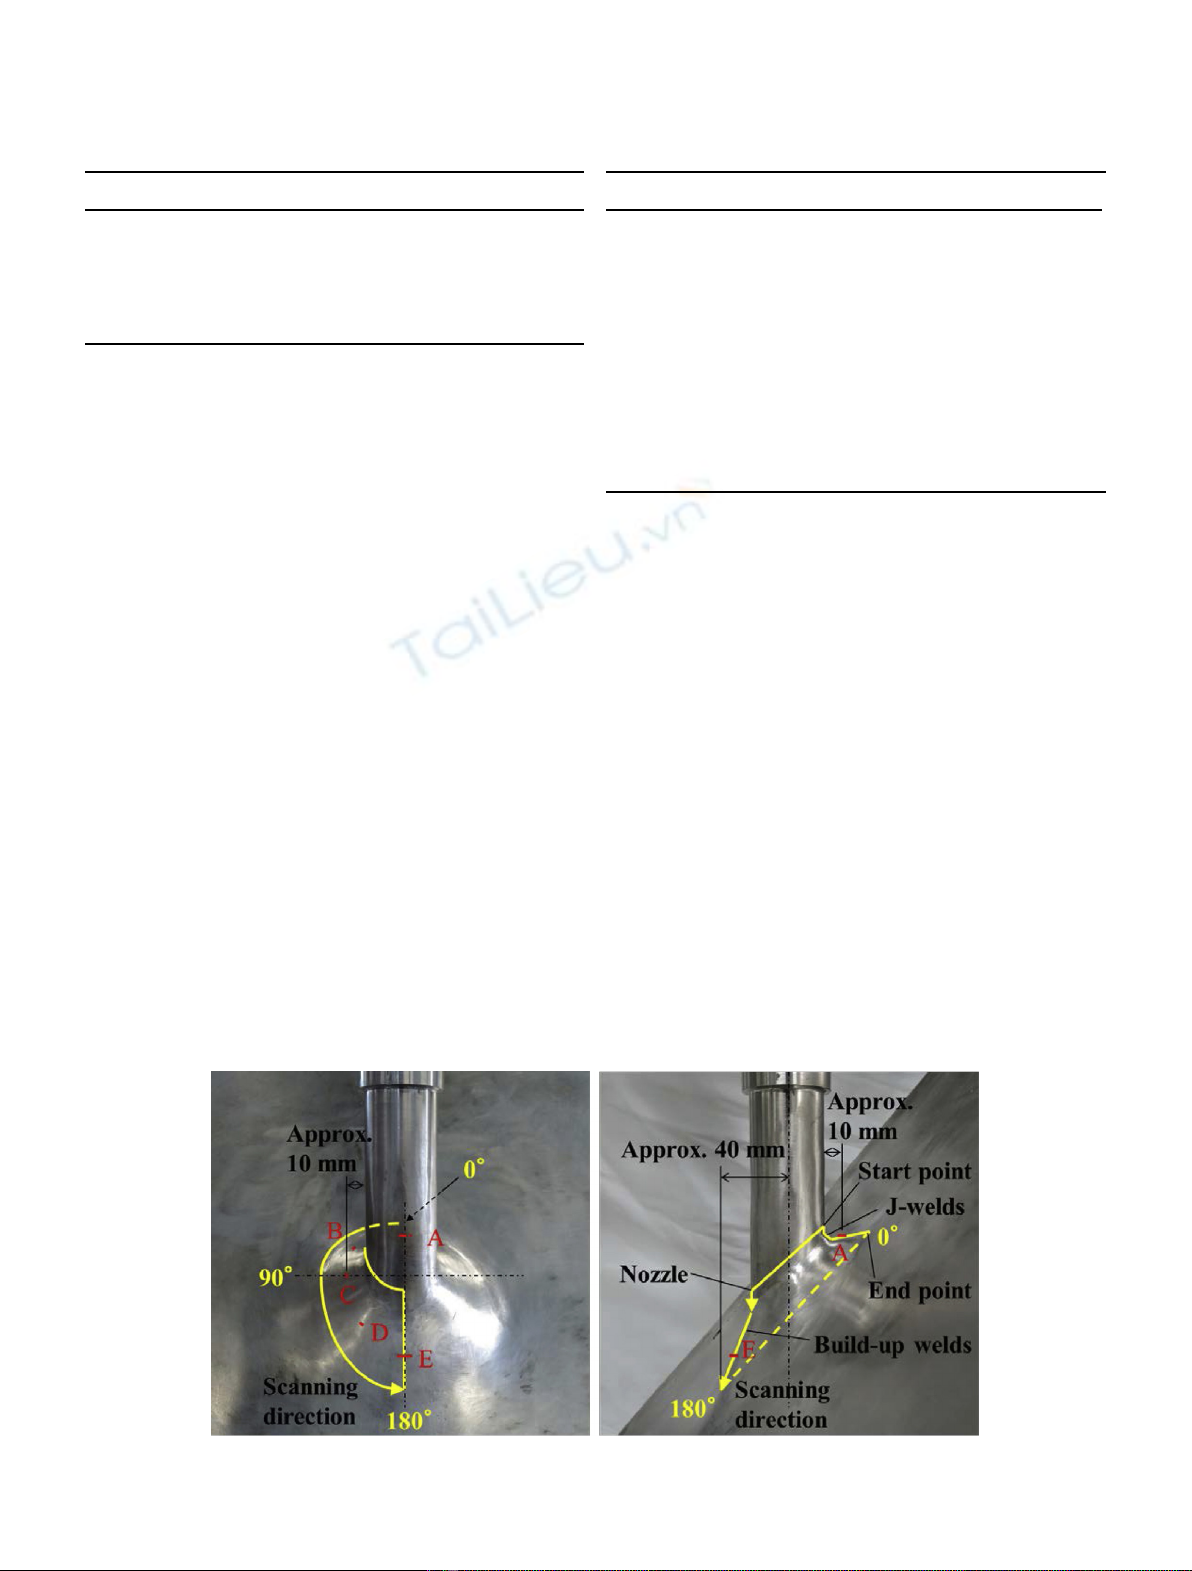
The scanning range by the ECT probe is shown in
Figure 8. The start point of scanning is on the outer surface
of nozzle at 0° in circumferential angle and approximately
3 mm above the J-weld. The probe was moved in less than
0.5 mm interval within the scanning range in a circumfer-
ential direction and made several round trips half side
around the nozzle. An end point of scanning is on the build-
up weld surface at 0° in circumferential angle and
approximately 40 mm from the center of nozzle. This
scanning range includes the nozzle, the J-welds, the build-
up welds and the artificial defects.
3.3 Experimental and calibrating conditions
The experimental and calibrating conditions are shown
in Table 2. We used the developed ECT probe [15] that
has small-sized cross coil and the higher directional
characteristics of magnetic field in the mock-up test. The
diameter of the probe tip that has contact with an inspected
surface is 3.4 mm. The probe operated with the differential
mode at the frequency of 250 kHz, 500 kHz and 1 MHz. The
calibration block made of alloy 600 has an EDM slit of
80 mm in length, 1 mm in depth and 0.3 mm in width. The
thickness of calibration block is 20 mm. We calibrated the
output voltage and the phase angle to 2 V and 90° using this
block in air, respectively.
4 Experimental results of mock-up test
The C scope images as seen through the signal processing
for the absolute values of imaginary part of ECT output
voltages at a frequency of 250 kHz, 500 kHz and 1 MHz are
shown in Figure 9. At a frequency of 250 kHz, the clear
signals from the defect A (SCC), the defect B (EDM) and
the defect C (EDM) were confirmed. It was considered that
the signals from the defect D (EDM) and the defect E
(SCC) were not detected because the volumes of the defect
D and the defect E are smaller than those of the other
Fig. 5. Divided scanning trajectories.
Fig. 6. Block diagram of ECT system. Fig. 7. Schematic of BMI mock-up [15].
4 N. Kobayashi et al.: EPJ Nuclear Sci. Technol. 1, 4 (2015)
defects. The maximum output voltages of the detected
defects were 0.93 V in the defect A, 0.33 V in the defect B
and 0.24 V in the defect C. The ratio of maximum output
voltages between the defects B and C was 1.4. This value
was roughly equal to the ratio of the volumes between the
defects B and C (1.5). On the other hand, the maximum
output voltage of the noises was 0.25 V. Under the following
three assumptions:
a. the maximum output voltage from the defect is
proportional to the defect volume;
b. the criterion for defect detection is that the signal to
noise ratio is more than 2;
c. the ECT can detect the defect of 0.5 mm and more in
depth,
it is estimated that the minimum EDM slit size that this
ECT system can detect is approximately 2.3 mm in length,
0.5 mm in depth and 0.2 mm in width. The output voltage
ofthedefectEwaslessthan0.125V.Itwasdifficult to
recognize the figure of the defect E visually. If the width of
the defect E was 0.05 mm, it is evaluated using the above
assumption (a) that the depth of the defect E is less than
0.38 mm. Although the length of the defect E is longer than
the lengths of the other EDM slits, it is considered that the
signal from the defect E was not detected because the width
and depth are smaller than those of the other EDM slits.
The noises increased at higher frequencies. It was
considered that the sensitivity of ECT probe for the change
of surface shape was increased by the dense eddy current on
the mock-up surface layer because of shallower skin depths
at higher frequencies. The skin depth of alloy 600 at each
frequency is shown in Table 3. The skin depth at each
frequency is the same or less than the depth of the EDM slit
given on the calibration block, 1.0 mm. When a defect
depth is the same or more than 1.0 mm, a phase angle of a
signal from a defect indicates the near-calibrated value,
approximately 90° or 90°. Positive and negative values
mean that directions of defects are mutually orthogonal. A
phase angle of an eddy current lags to the direction of
material depth [16]. Therefore, a phase angle of a signal
from a defect may lag behind the calibrated value if a defect
depth is less than 1.0 mm. The measured phase angles of the
signals from the defects (A, B and C) and the noises (F, G
and H) in Figure 9 are shown in Table 4. It was reasonable
that the phase angles of the signals from the defects A, B
and C were approximately 90° or 90°. It was considered
that the noises F and G were caused by the change of
Table 1. Artificial defects.
Defect Type Length (mm) Depth (mm) Width (mm)
A SCC Approx. 6 No data No data
B EDM slit 0.5 1.5 0.2
C EDM slit 0.5 1.0 0.2
D EDM slit 0.3 1.0 0.2
E SCC Approx. 3 No data No data
EDM: electrical-discharge machining; Approx.: approxi-
mately.
Fig. 8. ECT scanning range.
Table 2. Experimental and calibrating conditions.
ECT probe Cross coil
Operation mode Differential
Frequency (kHz) 250, 500, 1000
Atmosphere In air
Calibration block Alloy 600 (20 mm in thickness)
EDM slit
Length (mm) 80
Depth (mm) 1
Width (mm) 0.3
Calibrated
Output voltage (V) 2
Phase angle (°) 90
N. Kobayashi et al.: EPJ Nuclear Sci. Technol. 1, 4 (2015) 5


![Đề ôn tập cuối kỳ môn Kỹ thuật nhiệt - Nhiệt động học [mới nhất]](https://cdn.tailieu.vn/images/document/thumbnail/2026/20260310/hoaphuong0906/135x160/60681773197823.jpg)

![Bài giảng thang máy và thang cuốn: Tổng hợp kiến thức [chuẩn nhất]](https://cdn.tailieu.vn/images/document/thumbnail/2026/20260310/hoaphuong0906/135x160/41471773283876.jpg)
