
REGULAR ARTICLE
Nuclear core activity reconstruction using heterogeneous
instruments with data assimilation
Bertrand Bouriquet
*
, Jean-Philippe Argaud, Patrick Erhard, and Angélique Ponçot
Électricité de France, 1 avenue du Général de Gaulle, 92141 Clamart cedex, France
Received: 28 July 2015 / Received in final form: 8 October 2015 / Accepted: 20 November 2015
Published online: 18 December 2015
Abstract. Evaluating the neutronic state (neutron flux, power . . . ) of the whole nuclear core is a very
important topic that has strong implication for nuclear core management and for security monitoring. The core
state is evaluated using measurements and calculations. Usually, parts of the measurements are used, and only
one kind of instrument is taken into account. However, the core state evaluation should be more accurate when
more measurements are collected in the core. But using information from heterogeneous sources is at glance a
difficult task. This difficulty can be overcome by Data Assimilation techniques. Such a method allows to combine
in a coherent framework the information coming from numerical model and the one coming from various types of
observations. Beyond the inner advantage to use heterogeneous instruments, this leads to obtaining a significant
increase of the quality of neutronic global state reconstruction with respect to individual use of measures. In order
to describe this approach, we introduce here the basic principles of data assimilation (focusing on BLUE, Best
Unbiased Linear Estimation). Then we present the configuration of the method within the nuclear core
problematic. Finally, we present the results obtained on nuclear measurements coming from various instruments.
1 Introduction
The knowledge of the neutronic state (neutron flux,
power . . . ) in the core is a fundamental point for the
design, the safety and the production process of nuclear
reactors. Due to the crucial role of this information,
considerable work has been conducted for a long time to
accurately estimate the neutronic spatial fields. Spatial
distribution of power or activity in the whole core, or hottest
point of the core, can be derived from such spatial fields.
These information allow mainly to check that the nuclear
reactor is working as expected in a very detailed manner, and
that it will remain in the operating limits during production.
Two types of information can be used for the neutronic
state evaluation.
Firstly, the physical core specifications, including the
nuclear fuel description, make it possible to build a
numerical simulation of the system. Taking into account
neutronic, thermic and hydraulic spatial properties of the
nuclear core, such well-known numerical models calculate
in particular the reaction rates used for the physical
analysis of the core state.
Secondly, various measurements can be obtained from
in-core or out-of-core detectors. Some detectors can
measure neutron density, either locally or in spatially
integrated areas, others can measure temperature of the in-
core water at some points. A lot of reliable measures come
from periodical flux maps measured in each core reactor, at
a periodicity of about one month. Then, all these
measurements do not have the same type of physical
relation with the neutronic activity, and also not the same
accuracy. So it is not easy to take into account
simultaneously all these heterogeneous measurements for
the experimental evaluation of the neutronic state in the
core.
A lot of these measures are local, in determined fuel
assemblies, and do not give informations in un-instru-
mented areas of the core. The activity distribution over the
whole core is traditionally obtained through an interpola-
tion procedure, using the calculated fields as first guess (a
proxy) of the “real”activity field corresponding to the
measurements. In other words, the activity value in un-
instrumented areas is calculated as the weighted average of
the activity measures, using the calculated activity field to
interpolate. The power is then obtained from activity
through an observation operator, which depends only on
core nominal physical specifications for the periodical flux
map measurements. This interpolation procedure gives
* e-mail: bertrand.bouriquet@edf.fr
EPJ Nuclear Sci. Technol. 1, 18 (2015)
©B. Bouriquet et al., published by EDP Sciences, 2015
DOI: 10.1051/epjn/e2015-50046-1
Nuclear
Sciences
& Technologies
Available online at:
http://www.epj-n.org
This is an Open Access article distributed under the terms of the Creative Commons Attribution License (http://creativecommons.org/licenses/by/4.0),
which permits unrestricted use, distribution, and reproduction in any medium, provided the original work is properly cited.

already good results, but some drawbacks remain in using
only activity measures in a deterministic interpolation
procedure.
Both physical core specifications and real measurements
are subject to some uncertainties. Moreover, numerical
assumptions, required to use the models, add some
inaccuracy. All these uncertainties are not used explicitly
in the interpolation procedure, but often used to qualify the
a posteriori activity field obtained through the procedure.
Moreover, the interpolation cannot take into account, for
example, heterogeneous instruments, or observed discrep-
ancy of some instruments.
Attempts have been made to overcome these limita-
tions, mainly in two directions. Firstly, studies attempt to
combine activity measurements and calculations through
least-squares derived methods (for example in Ref. [1]),
leading to the most probable activity (or power) field on the
whole core. These methods allow to take into account
heterogeneous measures, but are difficult to develop
because of their extreme sensitivity to the weighting factor
in the combination of measures and calculations. Secondly,
explicit control of the error, in order to reduce its
importance, has been tried through the development of
adaptive methods to adjust coefficients in the calculation or
the interpolation procedure.
Some of these difficulties can be solved by using data
assimilation. This mathematical and numerical framework
allows combining, in an optimal and consistent way, values
obtained both from experimental measures and from a priori
models, including information about their uncertainties.
Commonly used in earth sciences as meteorology or
oceanography [2], data assimilation has strong links with
inverse problems or Bayesian estimation [3,4]. It is specifically
tailored to solve such estimation problems through efficient
yet powerful procedures such as Kalman filtering or
variational assimilation [5,6]. Already introduced in nuclear
field [7–10], it can be used both for field reconstruction or for
parameter estimation in a unified formalism. In particular, in
those papers are detailed effects of number and precision of
measurements, as well as effect of instrument localization.
Those methods are also used to improve nuclear data
evaluation [11,12] as well as nuclear mass [13].
Data assimilation can treat information coming from any
type of measure instruments, taking into account the way the
measure is related with the objective field to be recon-
structed, such as neutronic activity here. Data assimilation
can further adapt itself to instrument configuration changes,
and for example the removal or the failure of an instrument.
Moreover, the method takes natively into account informa-
tions on instrumental or model uncertainties, introducing
them a priori through the data assimilation procedure, and
obtaining a posteriori the reduced uncertainties on the
reconstruction solution.
In this paper, we introduce the data assimilation
method and how it addresses physical field reconstruction.
Then we make a detailed description of the various
components that are used in data assimilation, and of
the various types of instruments we can use to get in-core
neutronic activity measurements. Then we present results
with various instrument situations in nuclear core, obtained
on a set of true nuclear cores.
2 Data assimilation
We briefly introduce the useful data assimilation key
points, to understand their use as applied here. But data
assimilation is a wider domain, and these techniques are for
example the keys of nowadays meteorological operational
forecast. It is through advanced data assimilation methods
that long-term forecasting of the weather has been
drastically improved in the last 30 years. Forecasting is
based on all the available data, such as ground and satellite
measurements, as well as sophisticated numerical models.
Some interesting information on these approaches can be
found in the following basic references [2,5,6].
The ultimate goal of data assimilation methods is to be
able to provide a best estimate of the inaccessible “true”
value of the system state (denoted x
t
, with the tindex
standing for “true”). The basic idea of data assimilation is to
put together information coming from an a priori state of
the system (usually called the “background”and denoted
x
b
), and information coming from measurements (denoted
as y). The result of data assimilation is called the analysed
state x
a
(or the “analysis”), and it is an estimation of the
true state x
t
we want to find. Details on the method can be
found in references [4]or[5].
Mathematical relations between all these states need to
be defined. As the mathematical spaces of the background
and of the observations are not necessarily the same, a
bridge between them has to be built. This bridge is called
the observation operator H, with its linearisation H, that
transforms values from the space of the background state to
the space of observations. The reciprocal operator is known
as the adjoint of H. In the linear case, the adjoint operator is
the transpose H
T
of H.
Two additional pieces of information are needed. The first
one is the relationships between observation errors in all the
measured points. They are described by the covariance matrix
Rof observation errors e
0
,defined by e
0
=yH(x
t
).Itis
assumed that the errors are unbiased, so that E[e
0
]=0,where
Eis the mathematical expectation. Rcan be obtained from
the known errors on the unbiased measurements. The second
one is similar and describes the relationships between
background errors. They are described by the covariance
matrix Bof background errors e
b
,defined by e
b
=x
b
x
t
.This
represents the a priori error, assuming it to be also unbiased.
There are many ways to obtain this a priori and background
error matrices. However, in practice, they are commonly built
from the output of a model with an evaluation of its accuracy,
and/or the result of expert knowledge.
It can be proved, within this framework, that the
analysis x
a
is the Best Linear Unbiased Estimator (BLUE),
and is given by the following formula:
xa¼xbþKyHxb
;ð1Þ
where Kis the gain matrix [5]:
K¼BHTHBHTþR
1
:ð2Þ
Moreover, we can get the analysis error covariance
matrix A, characterising the analysis errors e
a
=x
a
x
t
.
2 B. Bouriquet et al.: EPJ Nuclear Sci. Technol. 1, 18 (2015)

This matrix can be expressed from Kas:
A¼IKHðÞB;ð3Þ
where Iis the identity matrix.
The detailed demonstrations of those formulas can be
found in particular in the reference [5]. We note that, in the
case of Gaussian distribution probabilities for the variables,
solving equation (1) is equivalent to minimising the
following function J(x), x
a
being the optimal solution:
JxðÞ¼ xxb
TB1xxb
þyHxðÞ
TR1yHxðÞ
:
ð4Þ
We can make some enlightening comments concerning
this equation (4), and more generally on the data assimilation
methodology. If we do extreme assumptions on model and
measurements, we notice that these cases are covered by
minimising J. Firstly, assuming that the model is completely
wrong, then the covariance matrix Bis ∞(or equivalently
B
1
is 0). The minimum of Jis then given by x
a
=H
1
y
(denoting by H
1
the inverse of Hin the least square sense).
It corresponds directly to information given only by
measurements in order reconstruct the physical field.
Secondly, on the opposite side, the assumption that
measurements are useless implies that Ris ∞. The minimum
of Jis then evident: x
a
=x
b
and the best estimate of the
physical field is then the calculated one. Thus, such an
approach covers the whole range of assumptions we can have
with respect to models and measurements.
3 Data assimilation method parameters
The framework of the study is the standard configuration of
a 1300 electrical MW Pressurized Water Reactor
(PWR1300) nuclear core. Our goal is to reconstruct the
neutronic fields, such as the activity, in the active part of
the nuclear core. For that purpose, we use data assimila-
tion. To implement such methodology, we need both
simulation codes and measures. For the simulation code, we
use standard EDF calculation code COCCINELLE for
nuclear core simulation, in a typical configuration (see Ref.
[14] for a general overview). The results are built on a set of
20 experimental neutronic flux maps measured on various
PWR1300 nuclear cores. Such measurements are done
periodically (about each month) on each nuclear core.
These different measurement situations are chosen for their
representativeness, in order that statistical results cover a
wide range of situations and can have some sort of
predictability property.
3.1 The background and the measurements
A standard PWR1300 nuclear core has 193 fuel assemblies
within. For the calculation, those assemblies are each
considered as homogeneous, and are divided in 38 vertical
levels. Thus, the state field xcan be represented as a vector
of size 193 38 = 7334.
The background is built upon neutronic diffusion
calculation from operational COCCINELLE code routinely
used at EDF. This code produces the fields for neutron flux,
power and temperature in the context of real cores.
The measurements come from instruments that can be
located on horizontal 2D maps of the core. There are three
types of instrument that are usually used to monitor the
nuclear power core:
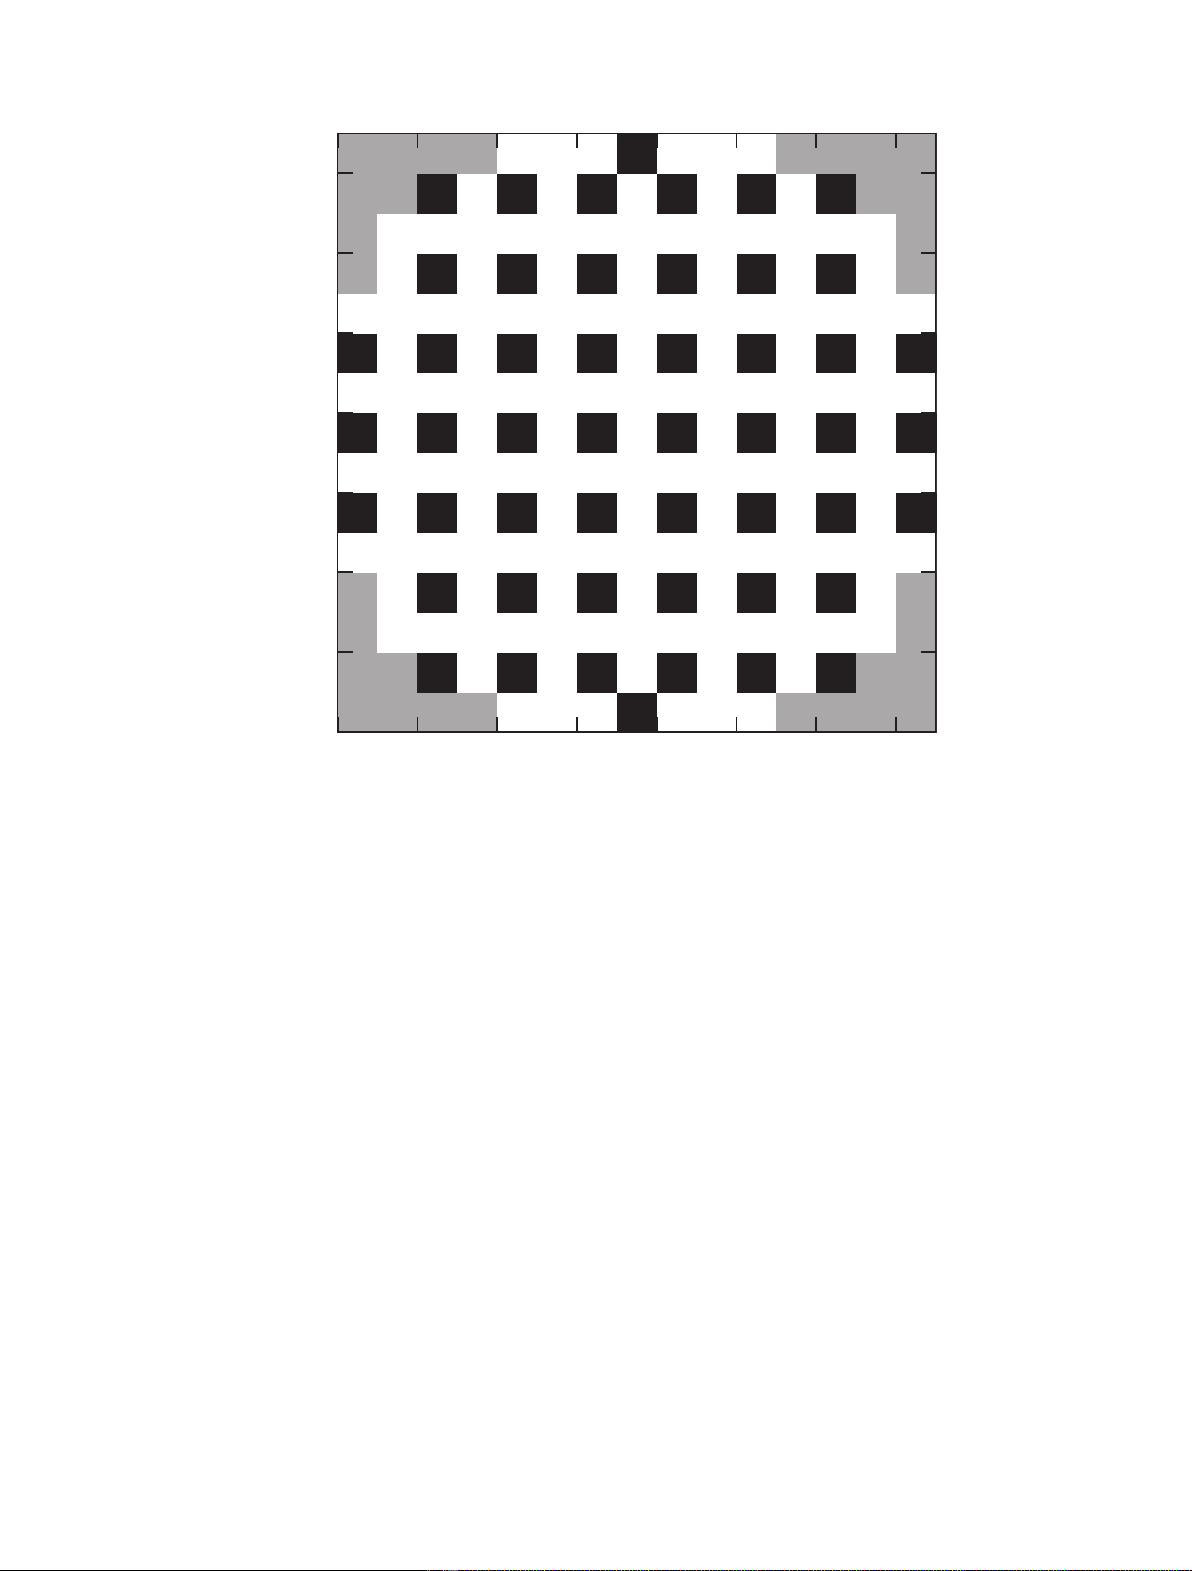
–Mobile Fission Chambers (MFC), which measure
neutrons inside the active part of the nuclear core, and
for which the locations are presented on Figure 1;
–Thermocouples (TC), which are above the active nuclear
core, for which the locations are presented on Figure 2;
–fixed ex-core detector locations.
The data coming from the ex-core detectors are
continuous in time and are very efficient for security purpose,
which is their main goal. Their purpose is to continuously
monitor the core, but not to measure accurately the
neutronic activity at each fine flux map. So, their measures
are too crude for being interesting on a fine reconstruction of
the inner core activity map. Thus, we choose here to not take
into account information coming from those ex-core
detectors.
All these types of instrumentation (MFC, TC, ex-core)
can be found on any power plants. For the purpose of this
study, we add artificially an extra type of detector,
described as idealized Low Granularity MFC (named here
LMFC). The measurement attributed to the LMFC are
built artificially from the information given by the MFC.
Thus they are replacing the MFC on the given LMFC
locations. The evaluation of LMFC response is calculated
from the MFC measured neutron flux, assuming a different
physic process, and a lower granularity. The lower
granularity assumption done on the LMFC induces a
partial integration of the results of the MFC over a given
area. Of course, the physical process involved to make a
measurement being different, the resolution of LMFC will
be different from the one from MFC. We take 16 of those
instruments. They are located in various area of the core,
replacing MFC, to try to make a representative array of
measurement as shown on Figure 3.
The main characteristics of the instruments, as their
number in the core, the number of considered vertical levels,
and the size of the part of the observation vector y
associated with the particular instrument type, are
reported in Table 1. The size of the final observation
vector is given by summing the size of all the individual y
vector of the instruments used.
3.2 The observation operator H
As the output of the neutronic code COCCINELLE
provides results which are equivalent to measurements,
the observation operator His mainly a selection operator,
that picks up the chosen information for an instrument
among all the code outputs. A normalisation procedure is
added for the measurements that have no absolute value.
In details, the Hobservation operator can be built
independently for each instrument. Each observation
B. Bouriquet et al.: EPJ Nuclear Sci. Technol. 1, 18 (2015) 3

operator is then basically a selection matrix, that chooses in
the model space a cell that is involved in a measurement in
the observation space. In addition, a weight, according to
the size of the cell, is affected to the selection. As some
experimental data are normalised, this selection matrix is
multiplied by a normalisation matrix that represents the
effect of the cross normalisation of the data. This
observation matrix is a 7334 Pdi
ðÞmatrix, where d
i
is the size of the part of the observation vector yfor each
instrument involved in assimilation, as reported in Table 1.
So there is one individual Hmatrix observation
operator by instrument type. The complete Hmatrix
observation operator is the concatenation, as a bloc-
diagonal matrix, of all the individual matrix for each
instrument.
3.3 The background error covariance matrix B
The Bmatrix represents the covariance between the
spatialised errors for the background. The Bmatrix is
estimated as the double-product of a correlation matrix C
by a diagonal scaling matrix containing standard deviation,
to set variances.
The correlation Cmatrix is built using a positive
function that defines the correlations between instruments
with respect to a pseudo-distance in model space. Positive
functions allow, through the Bochner theorem, to build
symmetric defined positive matrix when they are used as
matrix generator (for theoretical insight, see reference
documents [15] and [16]). Second Order Auto-Regressive
(SOAR) function is used here. In such a function, the
amount of correlation depends from the euclidean distance
between spatial points in the core. The radial and vertical
correlation lengths (denoted L
r
and L
z
respectively,
associated to the radial rcoordinate and the vertical z
coordinate) have different values, which means we are
dealing with a global pseudo euclidean distance. The used
function can be expressed as follows:
Cr;zðÞ¼1þr
Lr
1þz
jj
Lz
exp r
Lr
z
jj
Lz
:ð5Þ
The matrix Cobtained from the above equation (5) is a
correlation one. It can be multiplied (on left and right) by a
suitable diagonal standard deviation matrix, to get
covariance matrix. If the error variance is spatially
constant, there is only one coefficient to multiply C. This
coefficient is obtained here by a statistical study of
difference between the model and the measurements in
0 2 4 6 8 10 12 14
x position
0
2
4
6
8
10
12
14
y position
5857
56555453
52515049
484746
4544434241
403938
37363534
3332313029282726
25242322
2120191817
16151413
121110
9876
543
21
Fig. 1. The Mobile Fission Chambers (MFC) instruments within the nuclear core are localised in assemblies in black, in a horizontal
slice of the core. The assemblies without instrument are marked in white, and the reflector is in grey.
4 B. Bouriquet et al.: EPJ Nuclear Sci. Technol. 1, 18 (2015)
real cases. In real cases, this value is set around a few
percent.
Globally speaking, the covariance matrix is fully defined
by the parameters L
r
and L
z
that are related to the mean
diffusion length of neutrons in the assemblies.
The size of the background error covariance matrix Bis
related to the size of model space, so it is (7334 7334) here.
3.4 The observation error covariance matrix R
The observation error covariance matrix Ris approximated
by a simple diagonal matrix. It means we assume that no
significant correlation exists between the measurement
errors of all the instruments. A usual modelling consists in
taking the diagonal values as a percentage of the
observation values. This can be expressed as:
Rjj ¼ayj
2
;∀j:ð6Þ
The aparameter is fixed according to the accuracy of
the measurements and the representative error associated
to the instruments. It is the same for all the diagonal
coefficients related with one instrument. Its value only
depends on the type of instrument we are dealing with. The
avalue can be determined by both statistical method and
expert opinion about the measurement quality. In the
present paper, we will use arbitrary value for the a.
The size of the Rmatrix is related to the size of the
observation space, so it is PidiPidi
where d
i
is the
size of the observation vector of each instrument iinvolved
in assimilation, as reported in Table 1.
4 Results on data assimilation using only
one type of instrument
The first results are showing the quality of the reconstruc-
tion as a function of the various types of instruments that
are taken into account for reconstructing the activity of the
core.
The experimental data are a set of measurements on the
38 levels of all the instrument locations inside of the core.
Thus, to evaluate the quality of the reconstruction of the
physical fields with one type of instrument, we look for the
misfit(yHx
a
) at measurement locations (by other
instruments) that are not involved in the assimilation
process. The number of locations, where there is a
0 2 4 6 8 10 12 14
x position
0
2
4
6
8
10
12
14
y position
50
494847464544
434241403938
3736353433323130
2928272625242322
2120191817161514
1312111098
765432
1
Fig. 2. The Thermocouples (TC) instruments within the nuclear core are localised above assemblies in black, in a horizontal slice of the
core. The assemblies without instrument are marked in white, and the reflector is in grey.
B. Bouriquet et al.: EPJ Nuclear Sci. Technol. 1, 18 (2015) 5


![Đề ôn tập cuối kỳ môn Kỹ thuật nhiệt - Nhiệt động học [mới nhất]](https://cdn.tailieu.vn/images/document/thumbnail/2026/20260310/hoaphuong0906/135x160/60681773197823.jpg)

![Bài giảng thang máy và thang cuốn: Tổng hợp kiến thức [chuẩn nhất]](https://cdn.tailieu.vn/images/document/thumbnail/2026/20260310/hoaphuong0906/135x160/41471773283876.jpg)
