
REGULAR ARTICLE
Characterization of the ion-amorphization process and thermal
annealing effects on third generation SiC fibers and 6H-SiC
Juan Huguet-Garcia
1*
, Aurélien Jankowiak
1
, Sandrine Miro
2
, Renaud Podor
3
, Estelle Meslin
4
, Lionel Thomé
5
,
Yves Serruys
2
, and Jean-Marc Costantini
1
1
CEA, DEN, Service de Recherches Métallurgiques Appliquées, 91191 Gif-sur-Yvette, France
2
CEA, DEN, Service de Recherches en Métallurgie Physique, Laboratoire JANNUS, 91191 Gif-sur-Yvette, France
3
ICSM-UMR5257 CEA/CNRS/UM2/ENSCM, Site de Marcoule, bâtiment 426, BP 17171, 30207 Bagnols-sur-Cèze, France
4
CEA, DEN, Service de Recherches en Métallurgie Physique, 91191 Gif-sur-Yvette, France
5
CSNSM, CNRS-IN2P3, Université Paris-sud, 91405 Orsay, France
Received: 11 June 2015 / Received in final form: 14 September 2015 / Accepted: 24 September 2015
Published online: 09 december 2015
Abstract. The objective of the present work is to study the irradiation effects on third generation SiC fibers
which fulfill the minimum requisites for nuclear applications, i.e. Hi-Nicalon type S, hereafter HNS, and Tyranno
SA3, hereafter TSA3. With this purpose, these fibers have been ion-irradiated with 4 MeV Au ions at room
temperature and increasing fluences. Irradiation effects have been characterized in terms of micro-Raman
Spectroscopy and Transmission Electron Microscopy and compared to the response of the as-irradiated model
material, i.e. 6H-SiC single crystals. It is reported that ion-irradiation induces amorphization in SiC fibers. Ion-
amorphization kinetics between these fibers and 6H-SiC single crystals are similar despite their different
microstructures and polytypes with a critical amorphization dose of ∼310
14
cm
2
(∼0.6 dpa) at room
temperature. Also, thermally annealing-induced cracking is studied via in situ Environmental Scanning Electron
Microscopy. The temperatures at which the first cracks appear as well as the crack density growth rate increase
with increasing heating rates. The activation energy of the cracking process yields 1.05 eV in agreement with
recrystallization activation energies of ion-amorphized samples.
1 Introduction
Future nuclear applications include the deployment of the
so-called Generation IV fission and fusion reactors, which
are devised to operate at higher temperatures and to higher
exposition doses than nowadays nuclear reactors. One of
the critical issues to the success of future nuclear
applications is to develop high performance structural
materials with good thermal and radiation stability,
neutron transparency and chemical compatibility [1].
Structural materials for nuclear applications are exposed
to high temperatures, aqueous corrosive environments and
severe mechanical loadings while exposed to neutron and ion
irradiation. Its exposure to incident energetic particles
displaces numerous atoms from the lattice sites inducing
material degradation. Such degradation is the main threat to
the safe operation of core internal structures and is
manifested in several forms: radiation hardening and
embrittlement, phase instabilities from radiation-induced
or enhanced precipitation, irradiation creep and volumetric
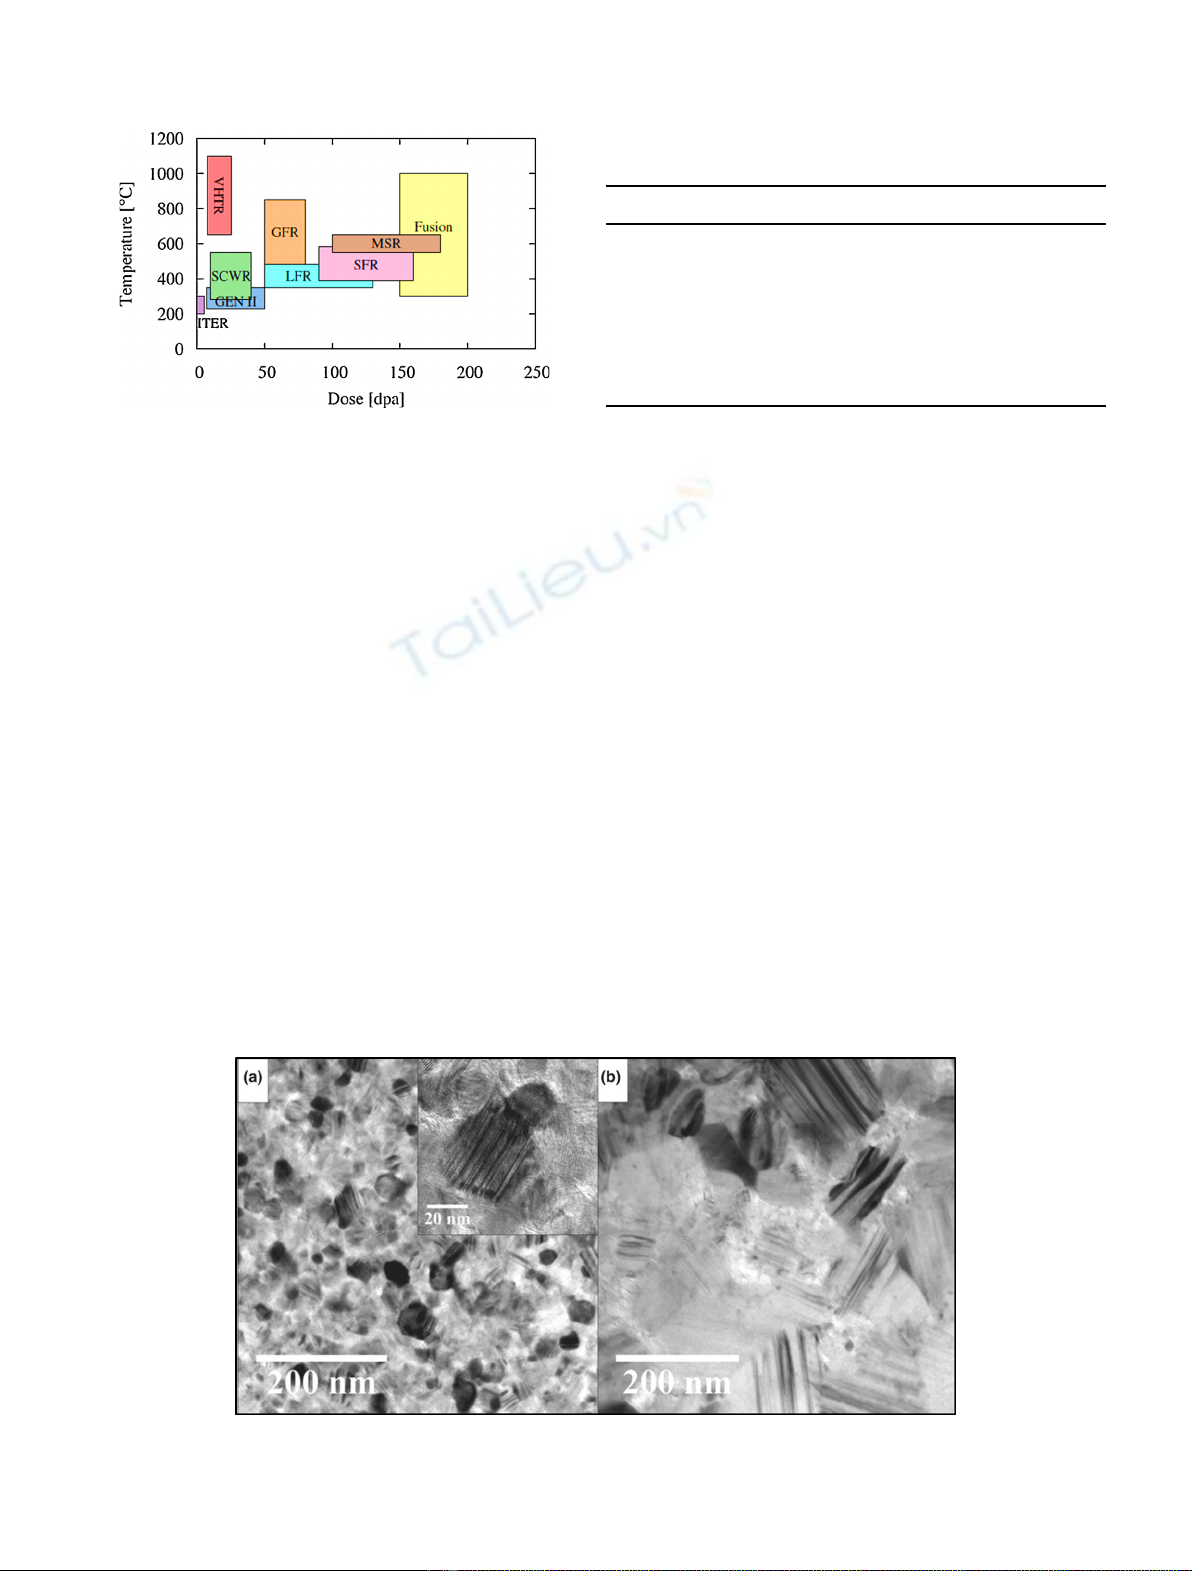
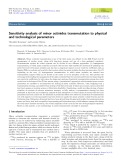
swelling [2]. As can be observed in Figure 1, nominal temp-
eratures and displacement doses can reach up to 1100°C and
200dpa depending on the nuclear reactor design. As a
consequence, conventional nuclear materials, mostly metal-
lic alloys, do not meet the requirements to operate neither
under nominal nor accidental conditions.
Nuclear grade Silicon Carbide based composites –made
of third generation SiC fibers densified via chemical vapor
infiltration (CVI) with a SiC matrix; SiC
f
/SiC
m
–are
among the most promising structural materials for fission
and fusion future nuclear applications [3]. However, several
remaining uncertainties place SiC
f
/SiC
m
in a position that
requires further research and development, notably the
radiation behavior of the fiber reinforcement which is
crucial for the composite radiation stability.
The objective of the present work is to study the
irradiation effects on third generation SiC fibers which
fulfill the minimum requisites for nuclear applications, i.e.
Hi-Nicalon type S, hereafter HNS, and Tyranno SA3,
hereafter TSA3. With this purpose, these fibers have been
ion-irradiated at room temperature to different doses under
*e-mail: juan.huguet-garcia@cea.fr
EPJ Nuclear Sci. Technol. 1, 8 (2015)
©J. Huguet-Garcia et al., published by EDP Sciences, 2015
DOI: 10.1051/epjn/e2015-50042-9
Nuclear
Sciences
& Technologies
Available online at:
http://www.epj-n.org
This is an Open Access article distributed under the terms of the Creative Commons Attribution License (http://creativecommons.org/licenses/by/4.0),
which permits unrestricted use, distribution, and reproduction in any medium, provided the original work is properly cited.
elastic energy loss regimes to simulate neutron damage. The
irradiation effects have been characterized in terms of
micro-Raman Spectroscopy (mRS), Transmission Electron
Microscopy (TEM) and Environmental Scanning Electron
Microscopy (E-SEM) and compared to the response of the
as-irradiated model material, i.e. 6H-SiC single crystals.
2 Materials and methods
2.1 6H-SiC single crystals and third generation
SiC fibers
6H-SiC single crystals of 246 mm thickness were machined
from N-doped (0001)-oriented 6H-SiC single crystal wafers
grown by CREE Research using a modified Lely method.
Crystals were of n-type with a net doping density (n
D
–n
A
)
of 10
17
cm
3
. All samples were polished to achieve a
microelectronics “epiready”quality.
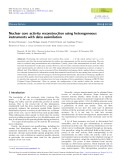
Main characteristics of HNS and TSA3 fibers are
summarized in Table 1.Figure 2 shows TEM images of the
microstructures of both fibers. Both fibers consist in highly
faulted 3C-SiC grains and intergranular pockets of
turbostratic C visible as white zones in Figure 2. Stacking
Faults (SFs) in SiC grains are clearly observed for both
fibers as striped patterns inside the grains. Stacking fault
linear density yields 0.29 ±0.1 nm
1
for HNS fibers and
0.18 ±0.1 nm
1
for TSA3 fibers. It has been determined by
counting the number of stripes per unit length in the
perpendicular direction using ImageJ [4] image analysis
software. Also, mean maximum and minimum Feret
diameters –which correspond to the shortest and the
longest distances between any two points along the grain
boundary (GB) –were determined. These values yield,
respectively, 26 and 36 nm for the HNS fibers and 141 and
210 nm for the TSA3 fibers [5].
2.2 Ion-irradiation
Different 6H-SiC single crystals and SiC fibers were
irradiated at room temperature (RT) with 4 MeV Au
2+
to 5 10
12
,10
13
,510
13
,10
14
,210
14
,310
14
,10
15
cm
2
at JANNUS-Orsay facility and to 2 10
15
cm
2
at
JANNUS-Saclay facility [8]. To evaluate the irradiation
Fig. 1. Nominal operating temperatures and displacement doses
for structural materials in different nuclear applications. The
acronyms are defined in the Nomenclature section (adapted from
Ref. [2]).
Table 1. Main characteristics of third generation
SiC fibers.
Fiber Tyranno SA3 Hi-Nicalon type S
Producer [6] Ube Industries Nippon Carbon
Diameter (mm) [6] 7.5 12
Density (g cm
3
)[6] 3.1 3.05
C/Si ratio
a
[7] 1.03–1.2 1.07
Composition [6] 68Si + 32C
+ 0.6Al
69Si + 31C + 0.2O
Grain Size (nm)
b
[5] 141–210 26–36
a
Values correspond to the edge and core of the fiber respectively.
b
Min. and max. Feret diameters.
Fig. 2. TEM images of the as-received (a) HNS and (b) TSA3 fibers. Stripped patterns inside the grains indicate the high density of
stacking faults in both samples (reproduced from Ref. [5]).
2 J. Huguet-Garcia et al.: EPJ Nuclear Sci. Technol. 1, 8 (2015)
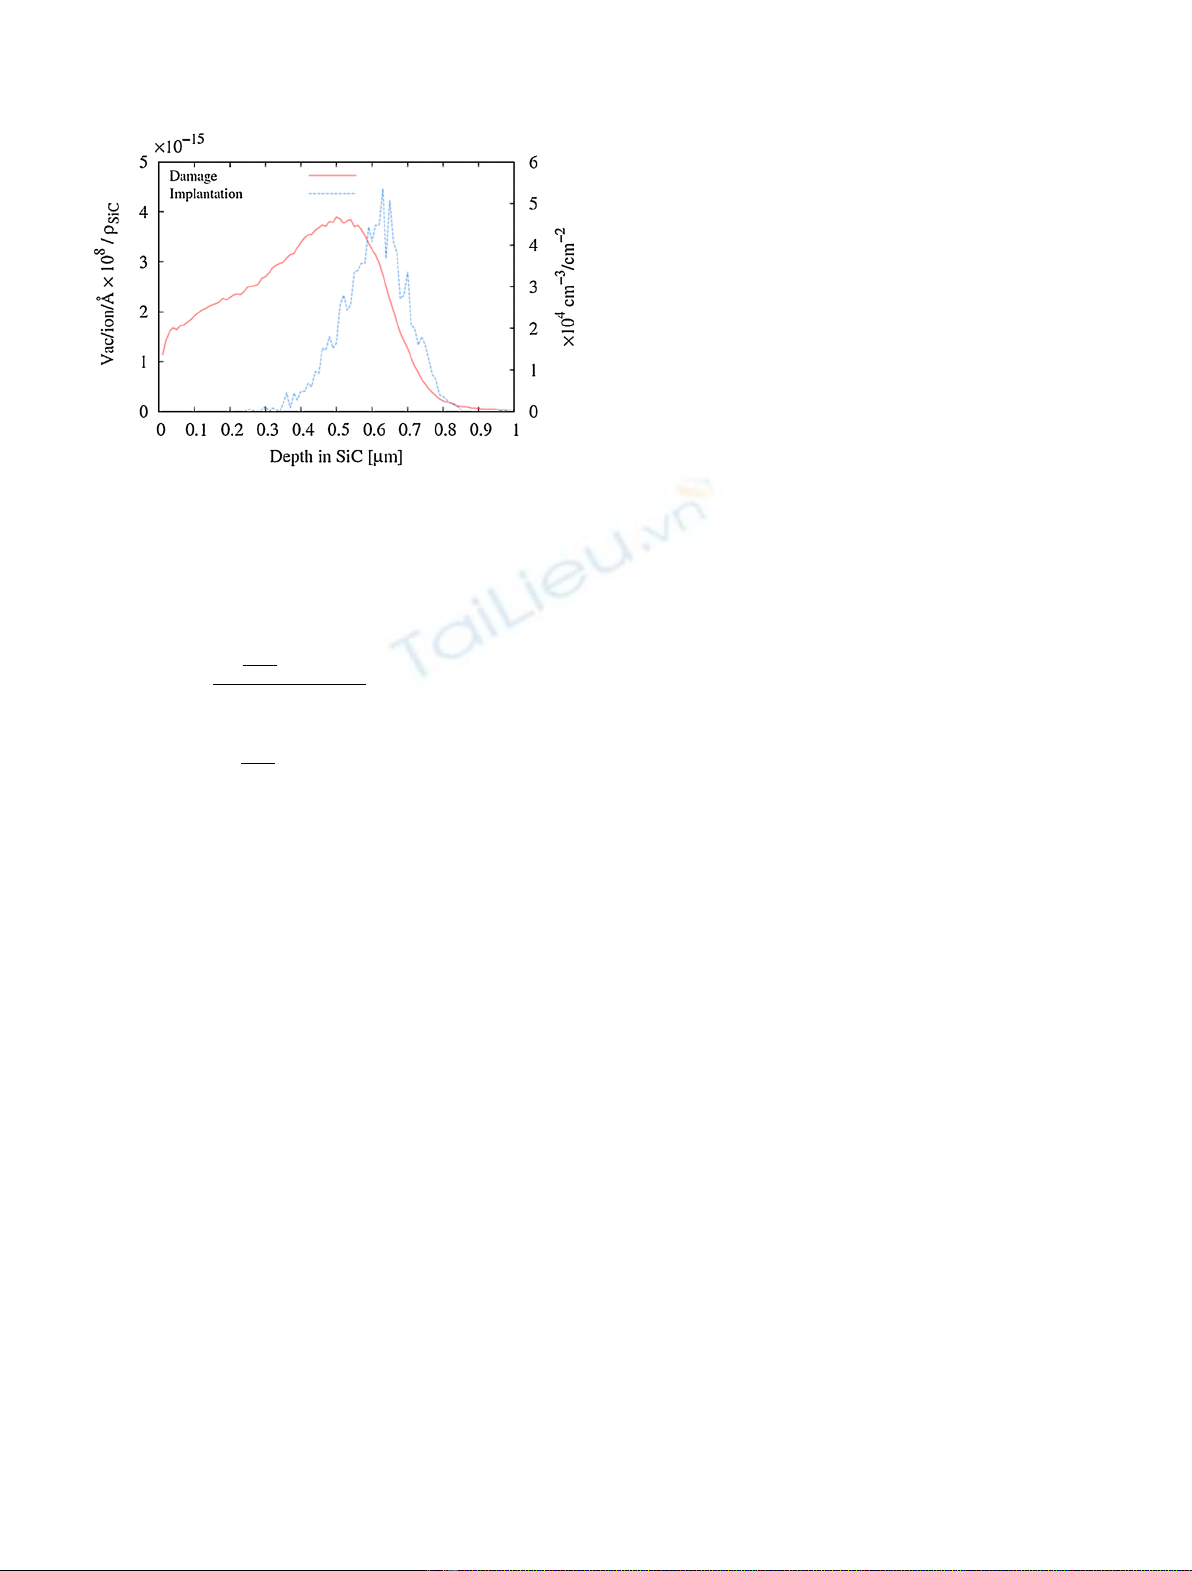
damage, ion-fluences have been converted to dpa with
equation (1):
dpa ¼
Vac
ion A
108
rSiC atoms cm3
½
’ions cm2
ð1Þ
where ’is the ion fluence, r
SiC
the theoretical density of SiC
(3.21gcm
3
) and Vac
ion A
the vacancy per ion ratio given by
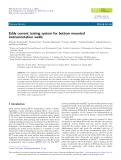
SRIM-2010 calculations [9]. Figure 3 shows the vacancy per
ion ratio and the implantation profiles asa function ofthe SiC
depth. SRIM calculations have been performed with full
damage cascades. Threshold displacement energies for C and
Si sublattices were set to 20 and 35 eV respectively [10].
2.3 Micro-Raman Spectroscopy (mRS)
Irradiated samples were characterized at JANNUS-Saclay
facility by surface mRS at RT using an Invia Reflex
Renishaw (Renishaw plc, Gloucestershire, UK) spectrome-
ter. The 532 nm line of a frequency-doubled Nd-YAG laser
was focused on a 0.5 mm
2
spot and collected through a 100
objective. The laser output power was kept around 2 mW to
avoid sample heating.
2.4 Transmission (TEM) and Environmental Scanning
Electron Microscopy (E-SEM)
Thin foils for TEM observations were prepared using the
Focused Ion Beam (FIB) technique. The specimens were
extracted from the samples irradiated to 2 10
15
cm
2
using a
Helios Nanolab 650 (FEI Co., Hillsboro, OR, USA) equipped
with electron and Ga ion beams. The specimen preparation
procedure is described elsewhere [5]. TEM observations were
conducted in a conventional CM20 TWIN-FEI (Philips,
Amsterdam, Netherlands) operated at 200 kV equipped with
a LaB6 crystal as electron source and a Gatan (Gatan Inc,
Warrendale, PA, USA) heating specimen holder (25–1000°C)
with manual temperature control. The CCD camera used to take
pictures is a Gatan Orius 200.
The E-SEM observation was conducted in a FEI
QUANTA 200 ESEM FEG equipped with a heating plate
(25–1500 °C), operated at 30 kV. Precise sample tempera-
ture measurement is ensured by a homemade sample holder
containing a Pt-Pt-Rh10 thermocouple [11]. H
2
O pressure
was kept constant at 120 Pa. The 6H-SiC samples were
quickly heated up to 900 °C to then set the heating rate to
values ranging from 1 to 30 °C/min for each test.
3 Results and discussion
3.1 Third generation SiC fibers microstructure and
Raman spectra
mRS is a powerful characterization technique based on the
inelastic scattering of light due to its interaction with the
material atomic bonds and the electron cloud providing a
chemical fingerprint of the analyzed material. SiC is known
to have numerous stable stoichiometric solid crystalline
phases, so-called polytypes, the cubic (3C-SiC) and the
hexagonal (6H-SiC) being the most common ones [12].
Raman peak parameters such as intensity, bandwidth and
wavenumber provide useful information related to the
phase distribution and chemical bonding of SiC and SiC
fibers [13]. Table 2 gathers the characteristic Raman peak
wavenumber for 3C- and 6H-SiC polytypes.
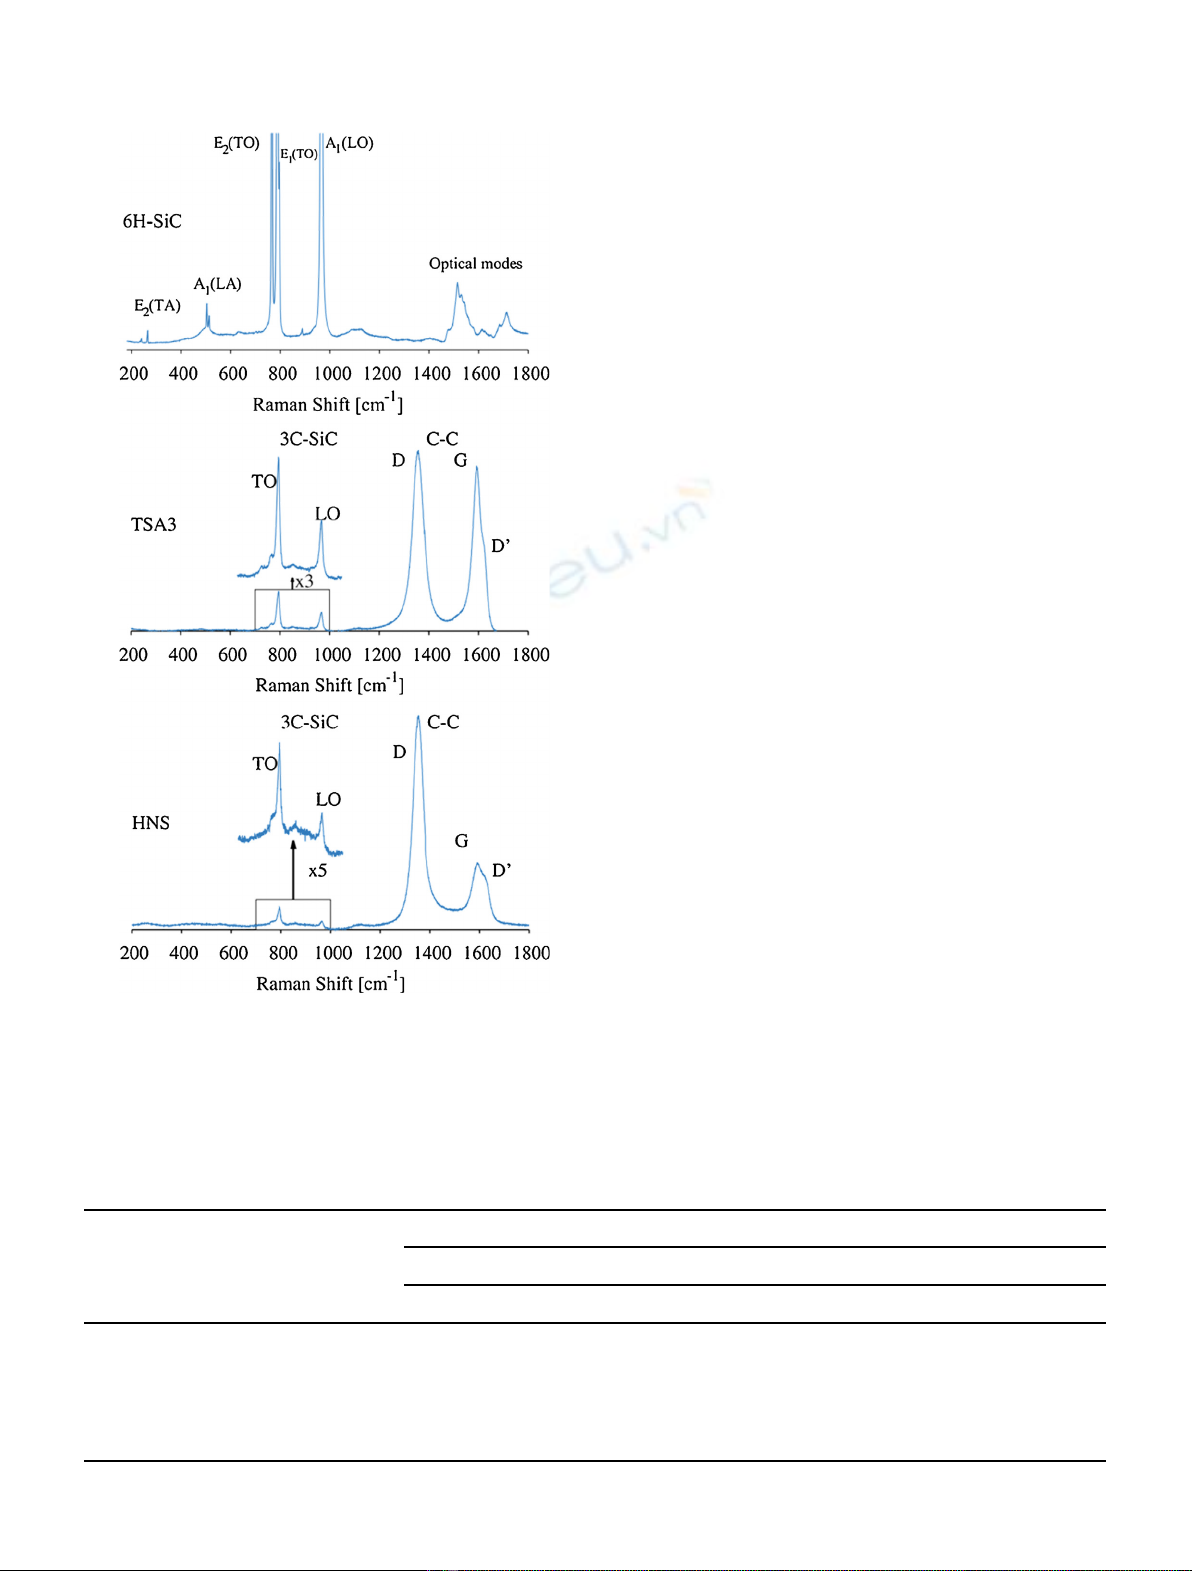
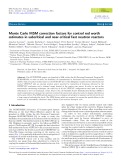
Figure 4 shows the collected Raman spectra for the as-
received samples. For the 6H-SiC spectrum, group-
theoretical analysis indicates that the Raman-active modes
of the wurtzite structure (C
6v
symmetry for hexagonal
polytypes) are the A
1
,E
1
and E
2
modes. In turn, A
1
and E
1
phonon modes are split into longitudinal (LO) and
transverse (TO) optical modes. Also, the high quality of
the sample allows the observation of second order Raman
bands as several weaker peaks located at 500cm
1
and
between 1400–1850 cm
1
.
Raman spectra collected from as-received TSA3 and
HNS fibers differ notably from the single crystal one. Their
polycrystalline microstructure and the intergranular free C
shown in Figure 2 induce the apparition of several peaks
related to their chemical fingerprint. Peaks located between
the 700 cm
1
and 1000 cm
1
are related to the cubic SiC
polytype. Satellite peaks around 766 cm
1
are attributed to
disordered SiC consisting of a combination of simple
polytype domains and nearly periodically distributed
stacking faults [13,14]. This explanation is consistent with
the high SF density observed in Figure 2.
High-intensity peaks located between 1200cm
1
and
1800cm
1
are attributed to the intergranular free C despite
the little free C content of both fibers. The high contribution
of these peaks to the spectra is due to the high Raman cross-
section of C2C bonds which is up to ten times higher than the
Si2C bonds [15]. Regarding the C chemical fingerprint, the G
peak centered around 1581 cm
1
is related to graphitic
structures as a result of the sp
2
stretching modes of C bonds
and the D peak centered around 1331cm
1
, according to
Colomban et al. [13], should be attributed to vibrations
Fig. 3. Damage and implantation profiles for 4 MeV Au in SiC.
Fluence-dpa estimation can be obtained by direct multiplication
of the y-axis per the ion fluence.
J. Huguet-Garcia et al.: EPJ Nuclear Sci. Technol. 1, 8 (2015) 3
involving sp
3
2sp
2/3
bonds. Finally, the shouldering appear-
ing on the G band in both fibers, D’, results from the folding of
the graphite dispersion branch corresponding to G at Gpoint.
There is a remarkable difference in the G peak intensity
between TSA3 and HNS fibers. It has been stated that the
G over D peak intensity ratio is proportional to the in-plane
graphitic crystallite size [17]. Therefore, the smaller size of
the intergranular free C pockets of HNS takes account for
such difference.
3.2 Ion-irradiation-induced amorphization
During service as nuclear structural material, SiC compo-
sites will be subjected to neutron and ion-irradiation. When
an energetic incident particle elastically interacts with a
lattice atom, there is a kinetic energy exchange between
them. If this transmitted energy is higher than the
threshold displacement energy of the knocked lattice atom,
it will be ejected from its equilibrium position giving birth
to a Frenkel pair: a vacancy and an interstitial atom. In
turn, if the kinetic energy transfer is high enough, the
displaced atom may have enough kinetic energy to displace
not only one but many atoms of the lattice, which, in turn,
will cause other displacement processes giving birth to
displacement cascade. The number of surviving defects
after the thermal recombination of the displacement
cascade may pile up dealing to the degradation of the
exposed material [18].
Ion-irradiation has been widely used by the nuclear
materials community to simulate neutron damage due to
the tunability of the radiation parameters (dose, dose rate,
temperature) and the similarity of the defect production in
terms of displacement cascade creation [19].
In this work, the samples have been irradiated to
increasing fluences at RT with 4 MeV Au ions in order to
simulate neutron damage. Figure 5 shows the evolution of
the Raman spectra as a function of the irradiation dose. As
can be observed, ion-irradiation induces sequential broad-
ening of the Si2C bond related peaks until they combine in
a unique low-intensity broad peak. Also, ion-irradiation
induces the appearance of new low-intensity broad peaks at
∼500 cm
1
and ∼1400 cm
1
. These changes with dose in the
Raman spectra are the consequence of the increasing
damage of the crystal lattice and are usually attributed to
the dissociation of the Si2C bonds and the creation of Si2Si
and C2C homonuclear bonds [20], in agreement with
EXAFS [21] or EELS [22] data and theoretical analyses
[23]. However, some authors have pointed out that changes
Fig. 4. Surface Raman spectra for as-received 6H-SiC single
crystal and third generation SiC fibers (adapted from Ref. [5]).
Table 2. Raman shift for 3C- and 6H-SiC [16].
Polytype X = q/qB Raman shift [cm
1
]
Planar acoustic Planar optic Axial acoustic Axial optic
TA TO LA LO
3C-SiC 0 - 796 - 972
0 - 797 - 965
6H-SiC 2/6 145,150 789 - -
4/6 236,241 504,514 889
6/6 266 767 - -
4 J. Huguet-Garcia et al.: EPJ Nuclear Sci. Technol. 1, 8 (2015)
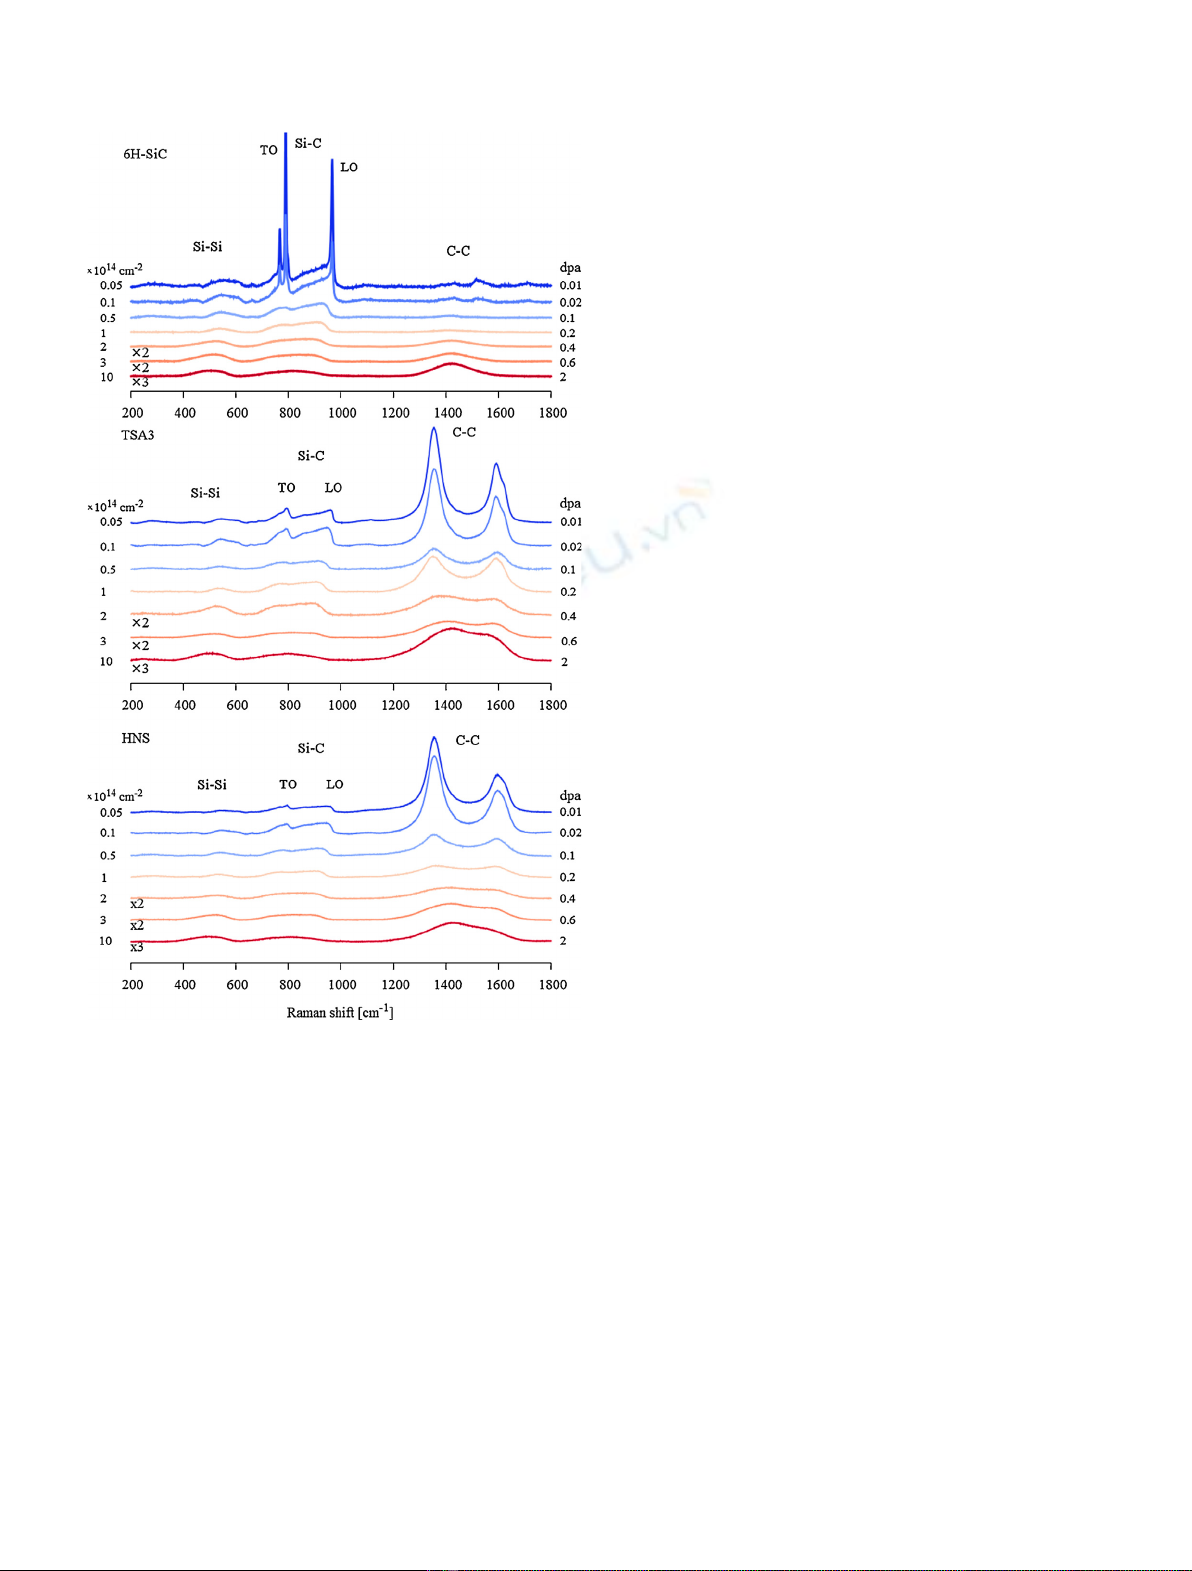
in the Raman spectra in SiC for moderated irradiation
damage do not necessarily imply the formation of Si and C
homonuclear bonds. For instance, the abrupt end of the
broad band observed near the 950 cm
1
for samples
irradiated to 10
14
cm
2
in Figure 5 can be attributed to a
release of the Brillouin zone-center Raman selection rules
due to a loss of translation symmetry caused by minor and
local damage without amorphization [24]. It is worth to
highlight that in SiC fibers irradiation at low doses
increases the intensity of the Si2C related peak despite
its randomization. As commented, there is a remarkable
influence of the free C in the SiC fibers Raman spectra due
to the high Raman cross-section of C2C bonds. Under
irradiation, the rupture of these bonds will imply the drop of
its cross-section allowing the SiC Raman signal to emerge
over the free C one. Finally, the spectra show similar low-
intensity broad peaks at ∼800 cm
1
characteristic of
amorphous SiC. As can be observed in Figure 6, complete
amorphization of the ion-irradiated layer is confirmed by
TEM imaging and electron diffraction of samples irradiated
to 4 dpa (2 10
15
cm
2
). SAED patterns of these zones are
composed of diffuse concentric rings.
Ion-amorphization kinetics for 6H-SiC single crystals
has been previously studied by mRS in terms of the total
disorder parameter and the chemical disorder. The former is
defined as (1-A/A
cryst
) corresponding to the total area A
under the principal first-order lines normalized to the value
A
cryst
of the crystalline material. The latter is defined as the
ratio of C2C homonuclear bonds to Si2C bonds and
denoted as x
(C-C)
, ranging from zero for perfect short-range
order to unity for random short-range disorder. Short-range
order describes the degree of the chemical state with respect
to the local arrangement of atoms, which can be partially
preserved even when the LRO is completely lost [20,25].
In our work, the use of these parameters to study the
ion-amorphization of SiC fibers is limited by two factors.
First, the Si-C signal increases at low doses, hence
invalidating A/A
norm
as an indicative of the total disorder
evolution, and secondly, the enormous impact of the free C
of the as-received fibers in their Raman spectra, hence
invalidating x
(C-C)
as a good indicative of the short-range
order evolution. In order to overcome these limitations,
chemical disorder has been calculated as the ratio of Si2Si
homonuclear bonds to Si2C bonds (x
(Si-Si)
) under the
assumption that the intensity of the Raman peaks is
proportional to the concentration of the related atomic
bond [20].
Figure 7 shows the x
(Si-Si)
evolution as a function of the
dose for the three samples. Data has been fitted with a
multistep damage accumulation (MSDA) model given by
equation (2):
fd¼X
n
i¼1
fsat
d;ifsat
d;i1
1esi’’i1
ðÞ
hi
ð2Þ
where nis the number of steps in damage accumulation, fsat
d;i
the level of damage saturation for the step i,s
1
the damage
cross-section for the step i,andfand f
i–1
the dose and the
saturation dose of the ith step [26].
MSDA model assumes that damage accumulation is a
sequence of distinct transformations of the current
structure of the irradiated material and that reduces to a
direct impact (DI) model meaning that amorphization is
achieved in a single cascade [26]. Table 3 gathers the best-fit
(non-linear least-squares Marquardt-Levenberg algorithm)
parameters for n= 2 of the x
(Si-Si)
evolution with dose.
MSDA parameters for 6H-SiC amorphization kinetics
are consistent with previous reported ones based in RBS
and mRS data [25,27] hence confirming x
(Si-Si)
as a relevant
indicative for the amorphization level of the sample.
According to the MSDA parameters, there is a
significant difference in the first stage of the amorphization
process between SiC fibers and 6H-SiC. However, this
difference may arise from the difficulty to treat the Raman
spectra of SiC fibers due to their C signal so it cannot be
directly attributed to a prompt amorphization. More
experimental data is needed to confirm this hypothesis.
Fig. 5. Surface Raman spectra for ion-irradiated 6H-SiC single
crystal and third generation SiC fibers.
J. Huguet-Garcia et al.: EPJ Nuclear Sci. Technol. 1, 8 (2015) 5


![Bài tập trắc nghiệm Kỹ thuật nhiệt [mới nhất]](https://cdn.tailieu.vn/images/document/thumbnail/2025/20250613/laphong0906/135x160/72191768292573.jpg)
![Bài tập Kỹ thuật nhiệt [Tổng hợp]](https://cdn.tailieu.vn/images/document/thumbnail/2025/20250613/laphong0906/135x160/64951768292574.jpg)

![Bài giảng Năng lượng mới và tái tạo cơ sở [Chuẩn SEO]](https://cdn.tailieu.vn/images/document/thumbnail/2024/20240108/elysale10/135x160/16861767857074.jpg)


