
105
Sè §ÆC BIÖT / 2024
Summary
This study employs regression analysis and Pearson correlation coefficient testing to identify the
SERVQUAL model and five key factors influencing service quality and customer satisfaction at the
School Sports Club in Phu Nhuan District. The identified factors include reliability, responsiveness,
assurance, empathy, and Tangibility. Among these, "tangibility" emerged as the most significant
determinant, while "empathy" was identified as the least influential factor affecting customer
satisfaction.
Keywords: Service quality, customer satisfaction, influencing factors.
(1)Master, Khanh Hoa University; (2)PhD, Sports Center, Vietnam National University, Ho Chi Minh City
(3)Master, Culture and Sports Center, Phu Nhuan District
Luu Phan Xuan Hoang(1); Huynh Thi Thuy Uyen(1)
Nguyen Van Thai(2); Tran Phi Hoa(3)
INTRODUCTION
In recent years, Ho Chi Minh City,
particularly Phu Nhuan District, has witnessed
a proliferation of enterprises offering sports
products and services characterized by
substantial scale, high quality, and diverse
activities supported by modern facilities. To
achieve a competitive advantage in this dynamic
market, fostering robust customer relationships
and enhancing service quality is imperative
rather than solely focusing on product offerings.
A plethora of domestic and international studies
have investigated the relationship between
service quality and customer satisfaction in the
context of sports services. Noteworthy among
these are the works of Yanni Thamnopoulos,
George Tzetzis, and Sakis Laios, (2012) [4].
Phạm Xuân Trường (2017). However, existing
studies lack a comprehensive examination of the
specific service quality factors that impact
customer satisfaction in this context. Therefore,
this study of the factors influencing service
quality and customer satisfaction at the School
Sports Club in Phu Nhuan District is necessary
to adapt to the increasingly sophisticated
demands of customers engaging in activities and
training at the club.
RESEARCH METHODS
This research employs those methods:
document review, expert interviews, sampling
techniques, and statistical analysis methods
(descriptive statistics, Cronbach’s Alpha
analysis, exploratory factor analysis, correlation
analysis, and regression analysis).
RESULTS AND DISCUSSION
1. Establishing the Service Quality
Assessment Model at the Phu Nhuan
District School Sports Club
1.1. Establishing the Service Quality
Assessment Model at the Phu Nhuan District
School Sports Club.
In the field of service quality assessment and
customer satisfaction within sports services,
numerous models have been developed. Among
them, the SERVPERF model proposed by
Cronin & Taylor (1992) stands out as a
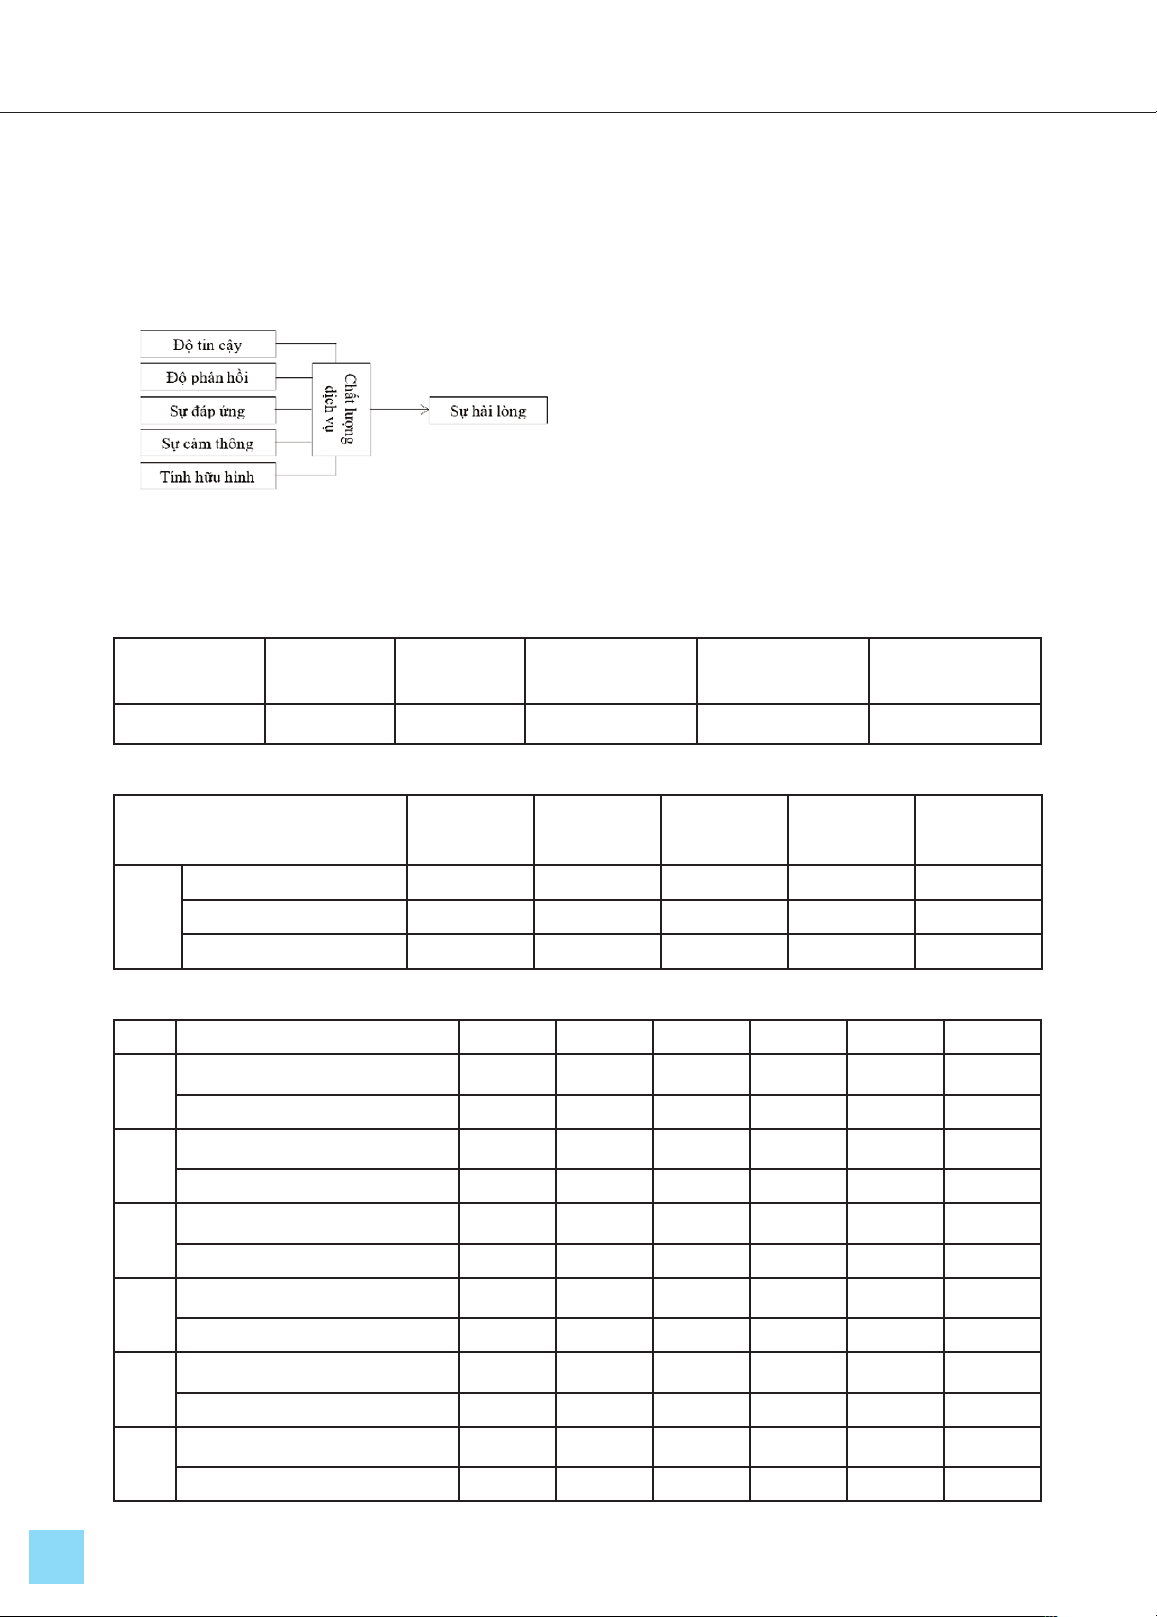
significant framework. The SERVPERF scale
identifies five dimensions of service quality:
Reliability (REL), Responsiveness (RES),
Assurance (ASS), Empathy (EMP), and
Tangibility (TAN) with 22 observed variables
that measure the aforementioned dimensions.
Through the analysis of internal reliability using
Cronbach’s Alpha, along with variable
correlation coefficients and Exploratory Factor
Analysis (EFA), this study has validated the
reliability of the scale. The analyses ensured
both convergent and discriminant validity, thus
FACTORS INFLUENCING SERVICE QUALITY ON CUSTOMER
SATISFACTION AT THE SCHOOL SPORTS CLUB IN PHU NHUAN
DISTRICT, HO CHI MINH CITY
p-ISSN 1859-4417 e-ISSN 3030-4822
106
confirming the appropriateness of the
SERVPERF model for evaluating service
quality and customer satisfaction.
Consequently, the SERVPERF model has
been chosen as the foundational basis for this
research. The proposed research model is
outlined as follows:
1.2. Evaluation of Model Appropriateness
In this model, the R-value is 0.759,
indicating a high level of appropriateness. The
adjusted R² value is 0.571, which is lower than
the R² value (see Table 1). This suggests that
using the adjusted R² is more prudent, as it
doesn’t exaggerate the model’s appropriateness
level. Consequently, the appropriateness of the
model is considered acceptable. However, to
determine whether the model can be generalized
to the broader population, it is necessary to test
its overall appropriateness through an F-test.
2. Identifying Factors Affecting Service
Quality on Customer Satisfaction at the
School Sports Club in Phu Nhuan District
To identify the factors affecting service
Figure 1. Model of service quality and
satisfaction of the School Sports Club
in Phu Nhuan District
Table 1. Summary of the Regression Model
Model RR
2R2 adjusted Standard Error of
Estimate Durbin-Watson
1 .759a0.577 0.571 0.42362 1.792
Table 2. Model Appropriateness Assessment
Model Sum of
Squares df Mean
Square F Sig.
1
Regression 92.204 5 18.441 102.76 0.000
Residual 67.655 377 0.179
Total 159.859 382
Table 3. Correlation Matrix of Model Factors
REL ASS RES EMP TAN SAT
REL Pearson correlation 1.000 .479** .377** .460** .278** .484**
significance level 0.000 0.000 0.000 0.000 0.000
ASS Pearson correlation .479** 1.000 .438** .453** .383** .539**
significance level 0.000 0.000 0.000 0.000 0.000
RES Pearson correlation .377** .438** 1.000 .382** .358** .557**
significance level 0.000 0.000 0.000 0.000 0.000
EMP Pearson correlation .460** .453** .382** 1.000 .348** .495**
significance level 0.000 0.000 0.000 0.000 0.000
TAN Pearson correlation .278** .383** .358** .348** 1.000 .594**
significance level 0.000 0.000 0.000 0.000 0.000
SAT Pearson correlation .484** .539** .557** .495** .594** 1.000
significance level 0.000 0.000 0.000 0.000 0.000
107
Sè §ÆC BIÖT / 2024
quality and customer satisfaction at the School
Sports Club in Phu Nhuan District, the study
performed Pearson correlation analysis to
quantify the strength of relationships. The
results of the correlation analysis are presented
in Table 3:
The results in Table 3 demonstrate that there
are statistically significant correlations between
the dependent variable "Satisfaction" and the
independent variables at the 5% level of
significance (p < 0.05). The independent
variables have a positive correlation with the
dependent variable (correlation coefficients are
greater than 0.4 and less than 0.6). The variable
"Tangibility" has the strongest correlation with
satisfaction (r = 0.594). Therefore, these
variables can be included in the model to
explain the dependent variable "Satisfaction."
2.1. Testing the Theoretical Model and
Research Hypotheses
2.1.1. Development of the Regression Model
The linear regression equation that represents
the relationship between the five influencing
factors (independent variables) and satisfaction
is structured as follows: Y = 0 + 1*REL+ +
2*ASS + 3*RES + 4*EMP + 5*TAN (1)
2.1.2. Testing for Regression Assumption
Violations
The study performed the following steps to
test the assumptions: the assumption of linear
relationships, the assumption of no correlation
between residuals, the assumption of normally
distributed residuals, and multicollinearity. The
results indicate that the assumption of a linear
relationship is satisfied; the null hypothesis of
no first-order autocorrelation in the model is
accepted; the multiple linear regression model
meets all assumptions, including the absence of
multicollinearity, meaning the relationships
between the independent variables do not affect
the model’s explanatory power.
2.1.3. Regression Results
To test the appropriateness of the five service
quality factors influencing customer satisfaction
at the club, a multiple linear regression model
using the Enter method was employed. The
results of the multiple regression analysis are
presented in Table 4.
Table 4. Regression Analysis Results
Model
Unstandardized
Coefficients
Standardized
Coefficients t Sig.
Multicollinearity Test
Tolerance VIF
B Std. Error Beta
1.000 Constant 0.165 0.176 0.938 0.349
REL 0.156 0.041 0.153 3.763 0.000 0.679 1.472
ASS 0.156 0.041 0.160 3.802 0.000 0.631 1.584
RES 0.243 0.038 0.252 6.391 0.000 0.723 1.384
EMP 0.131 0.040 0.133 3.270 0.001 0.679 1.472
TAN 0.288 0.031 0.354 9.352 0.000 0.785 1.274
The regression analysis results shown in
Table 4 indicate that all standardized regression
coefficients in the regression equation are non-
zero and have a significance value (Sig.) < 0.05.
This confirms that all five independent variables
significantly influence customer satisfaction at
the club: Reliability (REL), Assurance (ASS),
Responsiveness (RES), Empathy (EMP), and
Tangibility (TAN). According to Nguyễn Đình
Thọ (2011), using unstandardized coefficients
may not allow for an accurate comparison of the
impacts of independent variables, as their
measurement scales may differ. Therefore, we
must use the standardized regression coefficient
β to make more precise comparisons. By
comparing the values of the standardized
coefficients in the Beta column, it is evident that
Tangibility (β = 0.354, sig. = 0.000) has the

p-ISSN 1859-4417 e-ISSN 3030-4822
108
strongest impact, followed by Responsiveness
(β = 0.252, sig. = 0.000), while Empathy (β =
0.133, sig. = 0.001) has the weakest effect.
The regression equation for the model, based
on the standardized coefficients β, is as follows:
Y = 0.165 +0.153*REL+ 0.160*ASS +
0.252*RES + 0.133*EMP + 0.354*TAN (1).
2.2. Results of Hypothesis Testing
Based on the β coefficients and significance
values (sig.) from the regression analysis (Table
4), we conducted hypothesis testing for the
research hypotheses (see Table 5).
Table 5. Hypothesis Testing Results
Hypothesis Statement Standardized
Beta Coefficient p-value Conclusion
H1
Reliability has a positive impact on
customer satisfaction at the Phú Nhuận
School Sports Club
0.153 0 Accepted
H2
Assurance has a positive impact on
customer satisfaction at the Phú Nhuận
School Sports Club
0.16 0 Accepted
H3
Responsiveness has a positive impact on
customer satisfaction at the Phú Nhuận
School Sports Club
0.252 0 Accepted
H4
Empathy has a positive impact on
customer satisfaction at the Phú Nhuận
School Sports Club
0.133 0.001 Accepted
H5
Tangibility has a positive impact on
customer satisfaction at the Phú Nhuận
School Sports Club
0.354 0 Accepted
The results in Table 5 demonstrate that
hypotheses H1, H2, H3, H4, and H5 positively
impact customer satisfaction at the Phú Nhuận
School Sports Club. All of the hypotheses are
supported, as the standardized regression
coefficients have sig. (β1) = 0.000 < 0.05. This
confirms that all five service quality factors—
reliability, assurance, responsiveness, empathy,
and tangibility—affect customer satisfaction.
Among these, tangibility has the strongest effect
(β = 0.354, sig. = 0.000), followed by
responsiveness (β = 0.252, sig. = 0.000), and
empathy has the weakest effect (β = 0.133, sig.
= 0.001).
CONCLUSION
Through a comprehensive review of the
theoretical foundations and the use of various
testing and analytical methods, the study has
identified that the service quality evaluation
model applied to the School Sports Club in Phu
Nhuan district is the SERVPERF model. The
hypothesis testing results have determined five
factors of service quality that influence
customer satisfaction at the club, including
reliability, assurance, responsiveness, empathy,
and tangibility. Of these, tangibility has the
greatest influence, while empathy has the least.
REFERENCES
1. Cronin Jr, G.A., & Taylor, S.A. (1992),
“Measuring service quality: a reexamination
and extension”, Journal of Marketing, Vol. 56,
July, pp. 55-68.
2. Hoàng Trọng, Chu Nguyễn Mộng Ngọc
(2005), Data Analysis for Research with SPSS,
Statistical Publishing House.
3. Phạm Xuân Trường (2017), "A Study on
Service Quality and Customer Satisfaction of
Gym, Fitness, and Yoga Club Participants in
Thủ Đức District, Ho Chi Minh City."
4. Yanni Thamnopoulos, George Tzetzis,
Sakis Laios (2012), “The Impact of Service
Quality and Satisfaction on Customers’ Future
Intentions in the Sport Spectators’ Context”
Democritus University of Thrace, Greece.
(Received 12/10/2024, Reviewed 6/11/2024, Accepted 28/11/2024
Main responsible: Luu Phan Xuan Hoang; Email: xuanhoang@gmail.com)

![Đề cương ôn tập Bản đồ du lịch [năm hiện tại]](https://cdn.tailieu.vn/images/document/thumbnail/2025/20250809/dlam2820@gmail.com/135x160/53061754884441.jpg)