MINISTRY OF EDUCATION&TRAINING MINISTRY OF AGRICULTURE AND RURAL DEVELOPMENT
THUYLOI UNIVERSITY
PHAM VAN LAP
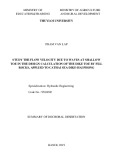
STUDY THE FLOW VELOCITY DUE TO WAVES AT SHALLOW TOE IN THE DESIGN CALCULATION OF THE DIKE TOE BY FILL ROCKS, APPLIED TO CATHAI SEA-DIKE-HAI PHONG
Specialization: Hydraulic Engineering
Code No.: 9580202
SUMMARY OF DOCRORAL DESERTATION
HANOI, 2019
The thesis has been completed at the Thuyloi University
Supervisors: 1: Assoc. Prof. PhD. Le Xuan Roanh
2: Prof. PhD. Ngo Tri Vieng
Reviewer 1:
Prof. PhD. Tran Dinh Hoa
Reviewer 2:
Assoc.Prof. PhD. Phung Dang Hieu
Reviewer 3:
Assoc.Prof. Tran Thanh Tung
The thesis will be presented at the meeting of the University Doctoral Committee in room No……………….on…14:00, day 21st, June, 2019.
The thesis can be found at:
- The National Library - Thuyloi University
INTRODUCTION
1 1. The rational of the thesis Located in the tropical-monsoon climate, Vietnam has a long coastline and is often affected by many storms. There are 6 to 10 storms occurred during the year with a high scale of wind speed and some time they occurred later or sooner of the year climate. In fact, in the past years, sea dykes and revetments are affected seriously after the storm leading to a large amount of money to repair them. The dike toe protecting the sea side has main forms such as high revetment toe, shallow revetment toe and deep revetment toe. Based on materials, it can be classified as: stone carpet, cylinder hollow well inside inserting rocks, pile and reinforced concrete sheet, steel sheet and so on... Calculating the size of stone is advised the formula (1.37) of TCVN9901: 2014 that is proposed by Izobat. This formula only mentioned three factors: wave height, water depth and wavelength. On the other hand, this formula is used linear wave theory for calculation. In fact, rocks laided on the sea bed closed to dike toe are always pushed to slope of the embankment or moved to sea side, or along shore. In fact, the phenomenon of rock sliding on the roof, up and down, friction between the rock and the revetment has caused abrasion and damage to the roof protection structure. For the above reasons, the impact of abrasive rock embankment is very dangerous to the safety of the embankment, it is necessary to find the exact velocity at the foot of the embankment (dike toe) so as to determine the weight of stones accordingly. The topic "Study the flow velocity due to waves at shallow toe in design of dike toe by fill rocks; applied to Cathai sea-dike-Hai Phong” has been proposed for research. 2. Research objectives The thesis will solve the following two basic objectives: - Clarifying the effect of hydrodynamic and geometric factors on the current velocity due to wave at the dike toe by using rocks; - Determining the formula to calculate the maximum flow velocity at the foot of the embankment (dike toe), then select the solution to design the structure of the foot protection of the embankment in both with or without roughness structures. 3. Subjects and scope of research - Research object: flow due to wave at seadike toe; - Scope of research: dyke toe in the North of Vietnam. 4. Research content - Overview of stabilizing the sea dike toe using filled rock; - Study the flow velocity due to wave at shallow sea dike toe by physical model; - Digital model to study flow at shallow seadike toe. 5. Approach and research methodology
(1.1)
5.1 Approach
In order to solve the objective of the thesis, the author chooses the inheritance
method which is both creative and suitable to the conditions of Vietnam.
5.2 Research methods
- Methods of general research; Experimental method; Digital model method; and
applied research methods.
6. Scientific and practical significance
- Scientific significance:The thesis has proposed a new calculation formula as a
scientific contribution.
- Practical significance: Finding the maximum velocity at the foot of the
revestment by the wave, propose a procedure to check the stone stability at the
foot of the embankment.
CHAPTER 1: OVERVIEW OF SEA-DIKE TOE STABILITY BY FILL
ROCKS
1.1 Structure of the sea dyke toe
1.1.1 General structure of sea dykes
The structure of normal sea dykes has the following main components [1], [2],
[3], [4]:
Dyke body, dike base, protection layer of sea side slope, dike top parts: dike face
and dike crest wall, protection structure for land side slope, drainage ditches.
1.1.2 Overview of protection layer of sea-dike toe
The toe dike is kept the protechtion layers and the upper structures from moving
down due to the impact of external forces such as waves, currents, floating
objects and other impacts causing instability. The toe dike also has the task of
forming a composite structure to protect the dike body when the erosion pit
appears at the base of the embankment.
Materials for foot embankment and toe can be stone, hollow cilinder well, sheet,
concrete pile or other material to protect the embankment. According to the
geometry of foot embankment can be classified into 2 types: shallow dike toe
and deep dike toe.
1.1.3 The shallow toe of sea dike
The standard of classifying sea dike toe according to hydraulic boundary is as
follows:
shallow dike toe :
1.0 < ds / (Hm0,0) < 4.
Very shallow dike toe: 0.3
2
Usually, the coastal area is usually divided into four regions based on the
transformation of waves from deep water into shallow water: shoaling zone,
breaker zone, surf zone and swash zone.
The area of the dike foot of the embankment is swash zone , when the waves
reach the slope of dike, it will climb and stop, flowing down which is called as
going up anf fall down flows. Those flows directly affects the material at the foot
of the embankment.
1.2.3. Wave flow due to waves attacking the foot of the shallow toe
When waves coming up and fall down on the sloping roof, being affected by the
terrain and wind direction, there are three main types of currents at this area:
cross-shore, long-shore and Rip (concentrated currents forward to the sea side).
The dike toe is influenced by two flows as horizontal and longshore bank flows,
the Rip flow is less affected comparing with two athers.
a) Cross-shore flow
When the mass of water due to the wave carries close to the shore it dissolves
and this amount of water will have to return to the sea - that is the reverse flow
or undertow. The bottom flow can be relatively strong, usually 8-10% of √𝑔𝑑𝑠
at the point of measurement near the bottom. Research on bottom flow has been
made by Longuet-Higgins (1953), Dyhr-Nielsen and Sorensen (1970), Dally and
Dean (1984), Hansen and Svendsen (1984), Stive and Wind (1986), and
Svendsen, Schäffer, Hansen (1987) (EM 2002) [7].
(b) Undertow on the beach
When the wave travels from the sea to the shore, the current velocity is divided
into 3 parts: surface velocity (wave front), velocity of the sub-surface water mass
and undertow flow velocity. The direction of the velocity of these regions is
opposite.
− 𝛾𝐿𝑛
2).0.5𝑒−0.5 𝑘𝑡 cos(𝜛𝑜−𝐵)]/2𝜛𝑜
(1.20) .
Figure 1.8: Longuet-Higgins flow velocity diagram (1953)
The current velocity at the bottom is determined as follows: 𝑈̅.𝑢𝑛𝑑𝑒𝑟𝑡𝑜𝑤 =
𝑠𝑖𝑛𝛼[1−(4𝜛𝑜
Inside:
α- bottom slope; Ln- change of the water level; ϓ- Breaking wave standard; k -
coefficient of bottom resistance; characteristic coefficient:
3
− ); t- Calculation time when wave propagates. ϖo = √(
𝑘2
4
𝑔 sin2 𝛼
𝛾ℎ𝑜
(c) Vertical flow
+ According to Longuet-Higgins (1970) [9], [10] He has given the formula for
calculating the longshore current velocity:
U = (1.21) 𝞬b √𝑔𝑑𝑠 sin 𝛼 cos 𝛼
tan 𝛽∗
𝐶𝑓
5𝜋
16
Inside:
U- longshore current velocity;Tanβ * - The slope of the corrected beach slope,
2/8);Cf - coefficient of bottom friction;α- slope angle of
Tanβ*= Tanβ /(1+3 𝞬b
beach;𝞬b - breaking wave standard.
(d) Flow in swash zone
Swash zone is the area of wave impacting on the shore area in the form of water
level fluctuation between the run-up and down waves. The swash zone is
conected betwen land and sea. The swash region is strongly related to the surges
in the slope and when the waves fall down the slope. The run- up flows are
usually much stronger than the down flows. According to Ruessink and Van Rijn
[16], the velocity of run-up wave can be approximated: ub = √ (gds) with ds in
the range of 0.1m to 0.2m, it accelerates to reach ub from about 1m / s to 3 m/s.
According to the study of Van Rijn et al. 2018 (linear wave theory) [17], [18],
the maximum flow velocity at the bottom can be expressed as follows:
Umax= Hs(Tp)-1sinh-1 (2ds/Ls)
(1.23)
Inside: ds is the water depth (m); Hs is the wave height, Tp is the wave period, Ls
is the wavelength.
1.3 Study of stability of fill rocks dike toe
1.3.1 Study the foot of embankment of stone in the world
a) Study of steady flow, horizontal direction and stabilize solid
Considering material particles in an environment with flow velocity, it is affected
by 5 force components as shown in Figure 1.12 [19]. In which FD is the dragging
component due to the impact flow, FS is the cutting force due to the bottom stress,
FL is the lift force caused by the flow curvature, FF is the friction force between
the particles holding it when moving. W is the weight of the particle itself.
Different forces of the effect flow on the particle are determined as follows [19].
Relationship between the parameters proposed by Izatbat:
2
𝑢𝑐
2𝑔
(1.26) = 1.7 𝑜𝑟 ∆𝑑 = 0.7 ) uc = 1.2 √2𝑔𝑑∆ ( 𝑜𝑟
𝑢𝑐
√∆𝑔𝑑
4
Figure 1.12: Impacting force of flow on particles in horizontal direction.
When calculating with the rock at the foot of the embankment, the density of
seawater is equal to γn = 1025 kg/m3, density of the quarry rocks γđ = 2400kg/m3,
formula (1.26) can be rewritten: (1.27). uc = 6.156√𝑑
inside:
uc - limit speed (m/s); d- typical diameter of a stone (m); g- gravitational
acceleration (m/s2);
In this formula horizontal velocity has no effect of water level. In fact Izbash did
not determine the position of velocity and did not specify how to determine the
particle diameter [19]. This formula is mainly used to estimate in the case of
known bottom velocity, but correlation of unspecified flow depth, like a stream
flowing into a water body.
+ The flow of water proceeds to the slope
Stability of the solid block under the impact of flow is shown by the following
formula (Pilarczyk - 1990) [20], [21], [22]
DΔ = Ucr2. (1.31)
0.035∗Φ∗𝐾𝑇∗𝐾ℎ
2g∗Ψ∗𝐾𝑠
Inside:
Δ= = Relative density of materials (-),
( 𝜌đ−𝜌𝑤)
𝜌𝑤
(1.34)
D - Thickness of protection layer (m),
g- Gravity acceleration (g = 9.81 m/s2),
ucr - Directional average flow velocity on slope (m/s),
Φ - Stability coefficient (-),
Ψ – Limited Shields Number (-),
KT - Coefficient of turbulent flow (-),
Kh - Flow depth coefficient (-)
Ks - Roof slope coefficient (-).
Replacment of the known coefficients, the formula (1.31) rewrites:
Ucr= 1.171√𝐷 (m/s).
1.3.2 Study of stability of embankment foot in Vietnam
1.3.2.1 Experimental and theoretical research
5
(1.37)
Research on erosion of sea embankment is also interested by many Vietnamese
scientists. According to the authors Nguyen Van Mao (1999) [23], Nguyen
Hoang Ha et al (2003) [25], Vu Minh Cat et al (2008, 2013), Le Hai Trung & et
al(2008), Thieu Quang Tuan et al(2008) [26], [27], [28], [29] ... conducted a
physical model study at the General Hydraulic Laboratory - Thuyloi University
and a mathematical model carried out at the Ministry-level research project in
2007 of Marine Engineering Faculty [4]. In addition to research on physical
models, many authors also have studied on mathematical models, using Wadibe-
CT program [25], [27]. Wadibe-CT numerical model developed by the Faculty
of Marine and Coastal Engineering, Thuyloi University.
1.3.2.2. Application research
The published scientific work of dike toe dike in Vietnam is still rare. The types
of dike toe are mainly used for hollow wells (circular and regular polygon
shapes), foot-lock beams, gabions, and matric of rock covering bed of floor, that
depended on the geological conditions and the design boundary. The research of
Marine Engineering Faculty staff has contributed more theory to explain the
scour at the foot of the embankment concerning to slope of bed and toe made by
hollow well.
1.3.3 The disadvantages of dike toe reserch at the momemt
At present, some stone works at the foot of the embankment are still unstable,
sometime the stone moves away from the original position.
- In the calculation according to rules, this does not to mention the solutions to
limit solid materials runing up due to the waves pushing on the embankment and
rubbing the roof (especially the wave reduction by roughtness colums ).
- The dissipation of wave energy on the embankment roof is currently being
designed by designers to create raised edges with the height of a few centimeters,
an area of roughness on the surface area of about (20 ÷ 40)%. It is necessary to
study the effect of roughtness colums height on energy reduction of flow.
1.4. Orienting research issues of the thesis
Maximum velocity according to TCVN 9901: 2014 is defined as follows[4]:
Umax =
).
Inside:
Umax is the maximum velocity of the flow at the foot of the embankment(m/s);
Lsp is the design wave length(m); Hsp is the design wave height(m); ds i the water
depth at toe of the embankment(m); g is the gravitational acceleration(m/s2
6
7
Comparing the formula (1.37) with the formula (1.23), the formula (1.23) has
mentioned the wave period factor (Tp) considering the influence Tp to the
maximum velocity at the foot of the embankment. However, the velocity at the
foot of the embankment is also influenced by other factors such as slope of the
embankment (m), the roughness of the embankment (a), the slope of the beach
(i), The breaking wave similar index of Igrabien ().
The thesis will focus on theoretical and empirical research to find the current
velocity near the bottom of ground, thereby proposing the calculation formula
and checking the stone stability at the foot of the embankment. Content included:
- Clarifying the flow regime and affecting the stability of shallow toe of dike
made of stone;
- Developing a calculation method and proposing a process to check the stability
of stone placed at shallow toe of seadike.
1.5. Conclusion chapter 1
- Foot embankment as dike toe is an important part of the sea dike structure, it is
the base of the revetmet, keeping the body and revetment of dike to be stable
under the impact of waves and currents. In general, stability of the embankment
in particular and the dike body is depended on the characteristics of the ground
geology, the depth of the flow, the wave height and the direction of the flow. At
the moment, rubble stone embankment is popularly used in design of sea dike
with suitable natural conditions.
- The flow at the foot of the embankment is belong to the surf zone, the nearshore
area exists the following flows: cross-shore current, longshore current and Rip
current, in which the velocity at the foot of the embankment is directly affect by
the cross-shore current and longshore current.
- There have been many domestic and international studies on current velocity
due to waves at shallow toe of seadike. Factors affecting the flow velocity have
been studied by Shield, Paintal, De Boer, Lammers, Simons and many other
researchers and have many publishs.
However, there are some factors that have not been mentioned about the height
of roughness, wave slope or similar index of breaking wave. The thesis needs
research to clarify the influencing factors that noted abave.
CHAPTER 2: DIGITAL MODEL STUDYING FLOWS AT THE
SHALOW TOE OF REVETMENT
2.1 Set the problem
To expand the scope of the study and the effect of geometric parameters on the
velocity of the shallow toe of revestment, the thesis has used MSS-2D numerical
modeling to describe the flow velocity vector made by wave, analyzed the
influences of hydraulic parameters and construction parameters on flow regime
at the foot of embankment; supportted the content of studying physical models
which is limited due to experimental conditions.
2.2 Research direction of mathematical model
2.2.1 Some common software in research of coastal wave
We can name here some mathematical models using the typical Boussinesq
equation system such as: MIKE 21-BW, FUNWAVE, COULWAVE. Besides,
there are some studies of mathematical models such as common digital wave
flume; IH2 (Spain), SOLA-VOF & DELAWAVE (USA), CADMASURF
(Japan) and MSS-2D, WADIBE-CT (Vietnam) [4].
2.2.2 Digital wave flume
2.2.2.1 Basic equations used in digital wave flume theory
Navier-Stokes equations are known as the right equations for describing fluid
motion, including problems of wave motion. But to facilitate the application of
simplified system of equations from Navier-Stokes equations that can be
represented as: Nonlinear shallow-water equation system (NSW), Boussinesq
equation system (BAE) and Equation system full nonlinear potential lines
(FNPF) .
+ The model based on a direct solution of the Navier-Stokes equation system
in case of closed turbulent flow
The thesis will be interested in spatially filtered Navier-Stokes equation using
the Smagorinsky turbulent diagram (Smagorinsky, 1963). The turbulent
) of the flow field. The
coefficient (
) is determined from the strain stress (
formulas for calculating turbulent coefficient in two-dimensional model are as
follows [42]:
(2.1)
(2.2)
(2.3) where Cs is the model parameter calculated in the range of:
The author of the thesis has used the theory of digital wave flume by authors
Hieu and Tamnimoto to perform calculations [33], [36], [37], [42].
2D equation system (vertical and horizontal directions), continuous equation is
written as follows:
(2.4)
The equation for conservation of momentum in the Navier-Stokes system (in the
x and z directions):
(2.5)
8
(2.6)
Where: t is time, x and z are horizontal and vertical coordinates; u, w are
horizontal and vertical velocity components; is the liquid density; p is pressure;
e is the kinematic viscosity coefficient (sum of viscous and turbulent viscous);
g is the gravitational acceleration; q is the volume; qu, qw is the momentum source
in the x and z directions. Dx, Dz are the energy reduction coefficients in the x and
z directions.
+ Based on the Navier-Stokes equation system, Sakakiyama and Kajima (1992)
have developed an extended equation system for unstable flow in an porous
environment, in which the drag force due to the porous environment is modeled
through drag and inertial forces increasingly due to resistance in the porous layer.
The system of equations proposed by Sakakiyama and Kajima (1992) two
direction 2D as follows:.
Continuous equation.
(2. 7)
The equation for conservation of momentum in the Navier-Stokes system (in the
x and z directions):
(2.8)
(2.9)
The coefficients: t, x, z, u, w,, p, e, q, qu, qw, v ; x, z and Dx, Dz introduced
above.
Rx, Rz: Drag coefficient due to the impact resistance of the porous. v, x, z are
determined from the parameters v, x, z as follows:
(2.10)
with CM is inertial coefficient. The resistance Rx and Rz are determined by the
following expression:
(2.11)
(2.12)
9
x, z are the horizontal and vertical distance of the net in a porous environment;
CD is the drag coefficient.
2.2.2.2 Structure of digital wave flume
The digital wave flume structure is outlined in Figure 2.2. The boundary
conditions for running include: liquid edges such as water level, wave height,
wave cycle, waveform (regular or random); hard edges including bottom
elevation, bottom slope, slope of embankment, roughness... then run and will
give preliminary results. In order to obtain the reliability, it is necessary to have
a mathematical model test in which two coefficients CD and CM need to do by
physical modeling to determine the value. The output part will have supporting
software.
2.3 Selection of boundary conditions in running the math model
2.3.1 Bases for setting up calculation parameters and testing physical models
Figure 2.2: Diagram of digital wave flume structure [34]
The flow velocity at the foot of the embankment is depended on the water depth
(ds), the wave height at the foot of the embankment (Hs), the wave period (Tp),
the slope of sea floor (i), the slope of the embankment (m), rough degree (a). To
go to the experiment and run the math model, the computational margins are
chosen as below.
(a) Hydrology in design.
Surveying the general shoreline, wave parameters at the design point: according
to the calculation design frequency the wave height from 0.2m to 3m and more,
corresponding to the wave period of about 5 seconds to 7 seconds in the shallow
water zone, the water depth at the foot of the embankment is from 0.5m to 3m
and more. Therefore, the thesis will base on this calculation to establish scenarios
[4], [38], [39].
(b) Topographic boundary, structure of dike slopes
According to the results of the study of the sea dyke program in the first phase
from Quang Ninh to Quang Nam (MARD), the average beach slope i = 1% to
2% [4], the common slope of sea dyke is m = 3.0 to m = 3. 5 [4], [40], [43], [44],
[45], [46].
10
2.3.2 Modifying MSS-2D digital wave flume model
The model uses wave data Hs = 0.8m and Tp = 5.06s (T = 5s) as a basis for
modifying the model.
The results of model correction show that with the scenario, porosity n = 0.3, Cm
= 0.25 and Cd = 1.5 for velocity UmaxTT = 1.26 m/s, the results are consistent
TN (m/s) = 1.24
with the results of the physical test with the same condition Umax
m/s (see chapter 3). Therefore the MSS-2D digital wave flume model selects the
porosity parameters n = 0.3, Cm = 0.5 and Cd = 1.5 as a basis for verifying
subsequent scenarios [annex 2].
2.3.3 Verification of the model in case of without roughness
Table 2.4: Results of the largest horizontal velocity test (Umax) by digital wave
flume models and physical models
TN(m/s)
TT(m/s) Umax
No. ds(m) Umax
KB1
KB2
KB3
KB4
KB5
KB6
KB7
KB8
KB9
KB10
KB11
KB12 1.5
1.5
1.5
1.0
1.0
1.0
1.5
1.5
1.5
1.5
1.0
1.0 T
Hs
(m)
(s)
0.8 5.06
1
6.96
1.1 6.96
0.6 5.06
0.7 5.06
0.8 5.06
0.8 5.69
0.8 6.96
5.06
1
1.1 6.32
0.7 5.69
0.8 5.69 1.26
1.84
2.26
0.99
1.15
1.27
1.58
2.03
1.59
2.25
1.41
1.57 1.24
2.23
2.35
1.03
1.37
1.46
1.85
2.11
1.66
2.23
1.45
1.62
2.3.4 Verification of the roughness case
Table 2.7: Results of testing the maximum velocity between digital wave flume
models and physical models
11
TN(m/s)
TT(m/s)
Umax Cd No. ds(m) Hs (m) T (s) Umax
KB1
KB2
KB3
KB4
KB5
KB6
KB7
KB8
KB9
KB10
KB11
KB12 1.5
1.5
1.5
1.0
1.0
1.0
1.0
1.0
1.0
1.5
1.5
1.5 5.06
6.96
6.96
5.06
5.06
5.06
5.06
6.96
5.69
5.06
6.96
6.96 2.0
1.0
2.1
2.3
2.3
2.3
2.4
2.3
2.3
2.3
2.3
2.2 0.8
1
1.1
0.6
0.7
0.8
0.6
0.7
0.8
0.8
1
1.1 1.08
1.96
2.15
0.81
0.94
1.08
1.06
1.64
1.61
1.45
1.97
1.81 1.12
1.86
2.27
1.08
1.23
1.27
1.12
1.68
1.5
1.35
1.78
1.90
Rou.
2.4 Study of the enery reduction in case of roughness
Comparing two options: roughness and non-roughness, the calculation results
are shown in the following table: Table 2.10: Comparing two options with and without roughness Umax No. (%) No. T (s) ds(m) Hs (m)
KB1
KB2
KB3
KB4
KB5
KB6 14.3
6.1
4.9
18.2
18.3
15.0 0.8
1
1.1
0.6
0.7
0.8 1.5
1.5
1.5
1
1
1 (m/s)
1.08
1.84
2.15
0.81
0.94
1.08 Umax
(m/s)
1.26
1.96
2.26
0.99
1.15
1.27 5.06
6.96
6.96
5.06
5.06
5.06
Note: The decreases efficiency of velocity is named as No in above Table.
Figure 2.5: Ratio of reduction in speed comparing with and without roughness
12
-With the same depth of water (ds) when Hs increases, T increases, the efficiency
of decelerated velocity No downward trend.
- In terms of water depth ds. When Hs and T are constant, at the small water depth
the result in a reduction efficiency No is not higher than that in case of the water
depth. This can be explained that when the wave will contact with the revetment
and when waves fall down, they are rubbed into the roughness and will create
turbulence, flow runs around the rough area, leading to reduce the velocity in
this area.
- The efficiency of decelerated velocity No at highest level is over 18%, the
lowest value is also over 4%.
2.5 Relationship between parameters
2.5.1 Analysis of periodic effects (T), wave height (Hs) to velocity (U)
(a) Effect of wave height Hs
Figure 2.6: Relationship between maximum horizontal velocity and wave
height
b. Effect of T wave cycle
Figure 2.7: Relationship between maximum horizontal velocity and wave
period
13
From the form of showing relationships through two figures above (2.6) and
(2.7) show that: The maximum flow closed to the bottom is proportional ratio to
the significant wave height and wave period. In cases of the wave height is of
great significance and the longer the wave period, the greater the flow velocity
can get. In which the increase of the cycle is superior to that of the wave height
to the increase in velocity.
c. Identify the relationship line between the largest bottom velocity and the ratio
(ds/L)
From Figure 2.8 shows that: The largest close-bottom flow velocity is inversely
proportional to the number of waves. The bigger the wave, the smaller the flow
velocity due to the bottom-approaching wave. The relationship has a concave
curve form.
d. Effects of slope to bottom velocity
The thesis has run with different slope as cases m = 2.0; 2.5, 3.0, 3.5, 4.0, 4.5
and 5.0.
Comment:
- In the same condition of wave, when the slope reduces, the velocity also
decreases too.
- The height of Hs is large, the speed is high, the length of the cycle is longer, the
greater the velocity;
- The lines of velocity are separated with high grade when slope of embankments
is in the range of m = 3.5 to m = 4.5.
Figure 2.8: Trend of relationship curves between maximum bottom velocity
and function sinh(2πds/L)
14
2.6 Conclusion of chapter 2
The maximum horizontal velocity at the base of the embankment is primarily
depended on the main parameters such as: cycle T, wave height Hs, water depth
at the toe ds, slope m, the roughness of revestment a, slope sea floor i, in wich
the T period has the greatest effect, and then the slope m. The steeper the slope,
the greater the velocity, the difference is 2 times when considering m = 2 and m
= 5 (Appendix 2).
In addition, it is also depended quite large on the ratio of Hs/ds, considering that
with T = 5s, the ratio of Hs/ds = 0.532 and 0.33, the speed difference is 2.0 times.
In case of roughness installation, the maximum velocity at the foot of the
embankment is significantly reduced. Averagely, the ability to reduce velocity
can be from 6% to 18% comparing the same hydraulic boundary conditions
namely with and without the instalation of roughness (Appendix 2).
In addition, the roughness also has the ability to prevent rock rolling on the slope
of the embankment, causing a vortex, limiting the concentration of the flow of
the wave head while comes-up as well as when goes down.
CHAPTER 3: STUDYING THE FLOW VELOCITY BY WAVES AT
SHALLOW TOE USING PHYSICAL MODEL
3.1 Set the problem
The flow velocity at the foot of the embankment is influenced by many factors
such as hydrological boundary conditions, terrain conditions and cross-section
of the project.
Research on physical models used modern wave flume with appropriate scaling
ratio to simulate waves approaching the foot embankment and make more clearly
the flow regime with the influence of geometric elements at the foot of the
embankment in cases of with and without roughness that is essential and will be
resolved in this chapter.
3.2 Research direction with physical models
3.2.1 Development process of research direction
Bcrtrand was the first person to determine the basic nature of similar phenomena
and propose a method of dimension analysis. By 1870, W.Froude conducted the
experiment. He proposed the famous Froude number, which has done the
foundation for the same law of gravity.
Next in 1885, O.Reynolds was the first person to apply the Froude number to
conduct the River Mersey model experiment, Veron-Harcourt conducted the Rin
estuary model experiment. In 1898, H.Engcls has built the first river model
experiment in Germany, studied the evolution of natural estuaries. J.R.Freeman
has built the first hydrodynamic laboratory of the US Bureau of Standards. So
far, there have been many hydraulic laboratories studying wave models using
wave pools and wave flumes to carry out many scientific experiments and have
introduced many semi-experimental formulas.
3.2.2 Theory of correlation parameters conversion in the model
Dimensions are expressed in simple symbols (letters) and close with a square
bracket [].
15
Dimensions that cannot be replaced by other dimensions are called "basic
dimensions" which can be included here: [L] (length), [M] (volume) and [T]
(time), or [F] (force). There are 3 similarities used in model research: Similar in
geometry; Similar in kinetics; Similar in dynamics.
3.2.3 Introduction of physical models
(a) Wave flume
Wave flume is the part that can made and control waves in the flume. The length
is depended by the required test set.
(b) Control software
Wave creation software: regular waves; irregular waves from spectra (PM,
JONSWAP, ITTC, etc.); long waves; short waves with spread angles (Cos,
Cos2N, etc.); focus waves for simulating extreme events; mixed waves are
complex with oscillations; simulate “silver head” waves.
(c) equipment and central control room
The central control room has equipped with computers at high speed, managing
and controlling the wave system, including some tools such as flow velocity
measurement equipment, wave height, cycle, pressure, turbidity...
3.3 Basis for selection of experimental boundaries
3.3.1 Selecting test boundary
(a) Hydrology boundary of design, (b) Topography boundary and structure of
dyke slope, as shown in section 2.3.1.
3.3.2 Experimental wave flume
Wave flume has a total length of 45m, effective length of 42m, height of 1.2m,
width of 1.0m. The wave generator is equipped with an Active Reflection
Compensation (ARC). The wave generator can generate regular or random
waves according to some common spectral forms (eg JONSWAP). The
maximum random wave height that can be generated in wave flume is 0.3m and
cycle 3.0s.
Experimental model:
Here select the representative m = 3.5 is the average slope.
Figure 3.1: Experimental layout diagram
16
Water depth: the change scenario; wave cycle: the basis of waves on the East
Sea; running time for each scenario: about 1000 waves; regular waves and
random waves.
+ Experimental materials
- The revesment of dike is made of waterproof material;
- Protection layer component: concrete slab with dimentions of 40x40x35cm
that is equivalent to 4x4x3,5cm in model size. Fabrication of structure height and
hexagonal edge size varies with c = 23mm, 29mm and 35mm, corresponding to
the height h = 55mm, 60mm and 90mm [39].
- Protection of toe: using stone size 1x2 stone (cm) that means the size of sive of
20mm time 10mm on the screen sieve (actual size is 10x20cm), 2x4 stone is
equivalent to diameter or edge size actually 20x40cm.
3.4 Experimental scenario
The author has conducted 24 scenarios with the following parameters: ratio of
model 1:10; water depth in flume (d): 2.1 and 2.6 (m); Water depth of foot
embankment ds (m): 1.0 and 1.5 (m); wave height Hs (m): 0.8, 1.0 and 1.1 (m);
cycle (T): 5.06, 6.92 and 6.32 (s).
3.5 Results of physical wave flume test
Table 3.1: Results of measuring the maximum velocity at the foot of the
embankment, roughness Cases
TN
Notes Umax
m/s)
No
.
1
2
3
4
5
6
7
8
9
10
11
12 ds
(m)
1.5
1.5
1.5
1
1
1
1
1
1
1.5
1.5
1.5 Hs
(m)
0.8
1
1.1
0.6
0.7
0.8
0.6
0.7
0.8
0.8
1
1.1 Ls
T
(s)
(m)
5.06 19.41 1.12
6.96 26.69 1.86
6.96 26.69 2.27
5.06 15.85 1.08
5.06 15.85 1.23
5.06 15.85 1.27
5.06 15.85 1.12
6.96 21.79 1.68
5.69 17.83 1.5
5.06 19.41 1.35
6.96 26.69 1.78
6.96 26.69 1.9 a=50cm, length C= 20cm
a=50cm, length C=20cm
a=50cm, length C= 20cm
a=50cm, length C=20cm
a=50cm, length C= 20cm
a=50cm, length C= 20cm
a=45cm, length C= 20cm
a=45cm, length C= 20cm
a=45cm, length C= 20cm
a=45cm, length C= 20cm
a=45cm, length C= 20cm
a=45cm, length C= 20cm
Table 3.2: Results of measuring the maximum velocity at the foot of the
embankment, the revetment has no roughness
17
Umax
TN(m/s)
1.24
2.23
2.35
1.03
1.37
1.46
1.85
2.11
1.66
2.23
1.45
1.62
TT
1
2
3
4
5
6
7
8
9
10
11
12 ds (m)
1.5
1.5
1.5
1
1
1
1.5
1.5
1.5
1.5
1
1 Hs (m)
0.8
1
1.1
0.6
0.7
0.8
0.8
0.8
1
1.1
0.7
0.8 T (s)
5.06
6.96
6.96
5.06
5.06
5.06
5.69
6.96
5.06
6.32
5.69
5.69 Ls (m)
19.41
26.69
26.69
15.85
15.85
15.85
21.83
26.69
19.41
24.26
17.83
17.83
3.6 Developing empirical formulas
3.6.1 Bases of establishment
The author divides the dominant parameters to the maximum velocity at the foot
of the embankment into the two basic groups as following:
-The hydrodynamic parameters: Hs, T, Ls = Lop;
Parameters of geometric characteristics of cross-section of dyke and sea floor of
dyke:
-Main dominant parameters - Water depth at embankment: ds;
- Sub-dominant parameters - slope: m; Iribarren Index: = tanα/(Hs/Lop)0.5; Slope
of beach: i (-); roughness height: a (m).
Thus the maximum horizontal velocity function will include the following
variables: Umax = f(Hs, Tp, ds, a, )
(3.5)
The thesis will build a formula based on the formula of calculating the maximum
flow velocity close to the bottom of the orbit [54]:
Umax= Hs(Tp)-1sinh-1 (2ds/Lop)
(3.6)
choose Hs and Tp as the base units with the basic dimensions of [L] and [T],
expressions (3.5) written in the form of functions: (3.7) f (π1, π2, π3, π4) = 0
1
3.6.2 Solving and finding extra functions
Solve functions for results as following:
π1 = Umax , and π4 = . ; 𝜋2 =
𝑇
𝐻𝑠
𝑐𝑜𝑠ℎ (
)
; 𝜋3 =
)
sinh (
2𝜋𝑎
𝐿𝑜𝑝
1
2𝜋𝑑𝑠
𝐿𝑜𝑝
3.6.3 General problem
To give a general formula, the thesis selects the formulas of (3.8)
18
)
𝑇
𝐻𝑠
𝜋2 =
)
sinh (
𝜋1 = 𝑈𝑚𝑎𝑥(
1
2𝜋𝑑𝑠
𝐿𝑜𝑝 (3.8)
1
𝜋3 =
𝑐𝑜𝑠ℎ (
)
2𝜋𝑎
𝐿𝑜𝑝
𝜋4 = {
Equation drawn:
y = a*x^b với a=2.752, b=1.231
1,231
1
or 𝑈𝑚𝑎𝑥𝑇 with R2 = 0.69 (3.9) = 2,752 [ ]
𝐻𝑠
)
cosh(
sinh(
)
2𝜋𝑎
𝐿𝑜𝑝
1
2𝜋𝑑𝑠
𝐿𝑜𝑝
Finally obtained
1.231
1
(3.10) [ ] 𝑈𝑚𝑎𝑥= 2.752
𝐻𝑠
𝑇
cosh(
)
sinh(
)
2𝜋𝑎
𝐿𝑜𝑝
1
2𝜋𝑑𝑠
𝐿0𝑝
Equation (3.10) calculates the maximum horizontal velocity when the
parameters considered are Hs, T, ds, Lop, a and .
Lop: calculated wave length at design point (m); T: wave period at selected design
point (s); Hs: design wave height (m); ds: water depth at toe (m); a: height of
roughness (m); : Iribarren Index: = tanα/(Hs/Lop)0,5.
Figure 3.2: Exponential form and equation describing the relationship between
1 and 2*3*4
From figures and tables of thesis (Figure 3.3), it can be known that the maximum
flow velocity is due to the wave at the near point of bottom according to TCVN
9901-2014. The maximum flow velocity in the general formula is larger than the
calculation result in TCVN 9901-2014 with an average comparison value of 1.51
times. The formula of Van Rijn [23] and the results of physical experiments are
correlated with the maximum flow velocity in the general formula. The flow at
the bottom of the site is depended on the parameters studied: Hs, T, ds, Lop, a and
.
3.7 Conclusion of chapter 3
The maximum velocity at the base of the embankment depends on factors such
as wave period (T), wave height (Hs), water depth (ds), wave length (Lop),
roughness height (a), slope (i), in which the cycle has the strongest effect. With
T > 6s, the measured velocity is greater than 2.0 m/s.
The formula (3.10) shows how to determine the maximum horizontal velocity
that appears at the foot of the embankment. This formula has mentioned 6 factors
considering the influence of hydraulic and computational cross-sectional
geometry, it is universal more general formula used in TCVN9901: 2014 because
it only refers to 3 factors considering Hs, water depth ds and Lop.
19
CHAPTER 4: COMPARISON CALCULATION OF VOLUME OF
STONE AT DIKE TOE, APPLING TO THE SEA DIKE OF CAT HAI,
HAI PHONG
4.1 General introduction of Cathai dyke, Haiphong
Cathai island is surrounded by dikes from Got - Gia Loc - Hoang Chau - Van
Chan - Nghia Lo - Dong Bai - Got. In general, the embankment has a rocky
phenomenon located at the foot of the embankment which has been moved,
rubbed the protection layer, caused serious damage and abrasion. Many types of
revetment have been used in this dyke. However, the phenomenon of rock rolling
on the slope of the embankment often occurs.
4.2 Damage phenomenon of revetment due to abrasions by solid objects
Figure 4.1:Revetment has been demaged due to rocks runing on and abrasion
The reason for this is that the stone located at the foot of the embankment may
be insufficient volume or by determining the weight of the stone in the design is
not enough or any other reason. In fact, after the storms, the embankment is
always rubbed
20
4.3 Design of roughness for dike toe
The thesis has calculated and determined the thickness of the protection layer of
blocks, rough thickness, and performed laboratory tests.
4.4 Propose a procedure to check the condition of stabilizing stones at the
foot of the embankment
Step 1: Determine the maximum velocity at the foot of the embankment by the
formula (2.10);
Step 2: Calculate and select the volume of rock to meet the stable conditions.
Check the size of rocks according to the stability conditions specified in the
formula (1.27) when considering the horizontal velocity Uc. The diameter of the
rocks is calculated as namely diameter.
3
G=V*ρ= D3*ρ, hay D = √
(4.1)
G
ρ
21
Inside:
3, Dn is the
G is the mass of stone (kg); V is the volume of stone (m3), V = Dn
converting diameter of stones, when pouring in layers (m); ρ is the density of the
stone (kg/m3). After having D, it will check the following conditions:
Check the size of the stone according to the stability conditions specified in
formula (1.27) when considering the horizontal velocity Uc.
If the speed of the oblique Ucr is determined, then check the formula (1.34):
Thus, if the stone is slipped, the height of the barrier of rughness must be at least
equal to the converted diameter D of the stone with the weight of G (kg).
4.5 Calculation and selection of protection components
4.5.1 Comment on recent repairs and upgrades at the study dike
- Embankment route has used many types of protection and that are very solid
and strong, however, the phenomenon of rock rolling on the revetment has not
been prevented.
- When rocks rolling, it causes abrasion of components, reducing the stability
and durability of components.
4.5.2 The detailed design of roughness structure to prevent rock and the shape of
components creating roughness
+ Roughness structure of cross section design in hexagonal form, the edges are
described in detail as follows:
• Hexagonal edge c = 23cm, horizontal edge 40cm;
• Height of block h = 70 cm;
• Designed concrete strength R = 250kg/cm2;
• Details for construction: hanging d = 10mm, horizontal pier hole to adjust the
block when installing with n = 30mm, the distance from hole to top 150mm.
+ Components inserted betteen roughness
Structure to protect the foot with a surface size as the same as roughness, height
of structure h = 50cm.
4.6 Comparing and calculating the volume of stones at the foot of the
embankmen
T
Table 4.4: Results comparing the difference between the formula (1.37) and
(3.10)
TQ
Umax
Q T (s) a No. ds(m) Ls
(m) Hs
(m)
G
increasi
ng (%)
G refer
to
Umax
(kg)
T
Umax
CVN(
m/s)
g
(m/s2
) (m/s)
0.8
0.8
0.8
0.8
0.8
0.8 KB1
KB2
KB3
KB4
KB5
KB6 1
1
1
1
1
1 5 15.66 9.81 0.0 1.26 1.64 1.19 40
6 18.79 9.81 0.0 1.38 1.93 1.21 40
7 21.92 9.81 0.0 1.50 2.21 1.22 48
5 15.66 9.81 0.5 1.26 1.60 1.19 40
6 18.79 9.81 0.5 1.38 1.90 1.21 40
7 21.92 9.81 0.5 1.50 2.18 1.22 47
G refer
to
TCV
Umax
N
(kg)
0%
40
40
0%
40 21%
0%
40
40
0%
40 18%
4.7 General comments on the proposed plan
- The proposed plan satisfies the requirement of increasing the ability to reduce
flow velocity when flowing through the abutments.
- Rough threshold height h = 43cm enough to prevent components when moving
through.
- The design is in harmony with the general structure of the project.
4.8 Conclusion of chapter 4
When applying the formula (3.10) to calculate the sea dike toe velocity, it will
give greater value when applying the formula (1.37) of TCVN 9001-2014,
corresponding to the minimum volume of foot-stone carpet will be safe. The
instability of the foot stone of Cathai sea dyke is very likely due to the size of the
calculation of the design of the stone which is still small.
Arrangement of roughness has the effect of reducing the maximum velocity at
the foot of the embankment, increasing the stability of the foot mats or reducing
the minimum volume of foot stone. The size of roughness can be seen in the
author's exclusive registration form and the research team to choose suitable
result [40].
CONCLUSIONS AND RECOMMENDATIONS
1. Achievements of the thesis
(a) Theory research
- When studying the sea embankment in particular, the body is generally
dependent on the geological characteristics, flow depth, wave height, wave
period, slope, and direction of the flow compared to main axis of sea dike;
22
23
The stability of the foundation has a direct impact on the dike toe and stability
of the revetment and the dyke body. The calculation of the maximum design
velocity considering the above influences has contributed to clarifying the
mechanism of rock moving at the foot of the embankment.
- The thesis has synthesized and analyzed the research methods of stability and
instability of the beach neared to toe of the embankment, stated the advantages
and disadvantages of different types of revetment from which it will propose
research method and scope of application of the formula for calculating the
maximum velocity at the foot of the embankment to determine the size of the
foot protection material.
(b) Experimental research using physical models and mathematical models
In order to find out the cause of damage to the foot embankment, mobile
materials from the revetment, the thesis has done a physical model experiment,
at the Department of Integrated laboratory, Thuyloi University, the results show
that: The measurement velocity of 24 scenarios shows that the measured actual
velocity is greater than 1.1 to 1.68 times (or greater with a large T period) the
calculated velocity according to the formula specified in the current design
standard.
Based on the results of the physical model, the author used mathematical
modeling to expand computational margins. The end result is: the flow velocity
due to the wave that be affec factors such as wave height (Hs), wave period (T),
wavelength (Lop), depth water at foot embankment (ds), slope (m). This velocity
has been highly dependent on wave cycles-T, Hs, slopes and Irribaren Index. If
Hs increases, the slope is steeper, the velocity increases. The maximum
horizontal velocity at the foot of the embankment is determined in the formula
(3.10).
(c) Applied research into actual works
Sea dykes in some parts of northern and centra- northern in general as well as
Cat Hai Phong sea dike in particular... these works are disadvantages of the
structures and stones used in the works, and the stone blocks built on beach, it
always be effected by waves on the embankment, causing abrasion and leading
to damage, weakening the quality of the roof. The thesis has applied a stable
calculation of roof and foot protection components when designing for a project
in Hai Phong. The calculation results are designed in accordance with the reality
and the current status of the project is stable, sustainable and fine art since the
invention was granted with intellectual property [40], [Aannex 3].
2. New contributions of the thesis
The thesis has made the following main contributions:
- Formulated the formula for calculating the maximum horizontal velocity at the
toe of embankment when considering many factors including: T, Hs, ds, Lop, tanα,
a, and as shown in formula (3.10).
- The thesis has clarified some factors affecting the flow due to waves in shallow
toe of embankment area.
3. Disavantages and direction of development
(a) Disadvantages
The thesis has proposed the formula for calculating the maximum velocity
appearing at the embankment foot when the wave impacting. However, the
number of experimental scenarios is still modest.
The thesis has studied the effect of sloping roof by mathematical model but has
not yet tested in the physical model fully so it has not been included in the general
formula.
(b) Development direction
Further research is needed on the effects of the slope of the works and the slope
of the beach by empirical models to set up the maximum velocity formulas at the
foot of the embankment related to these two factors.
4. Recommendations
The thesis has given the result of calculating the maximum velocity of
wave-induced flow greater than the current regulated value. This is the
initial basis for reference, to adjust the formula for calculating the
maximum velocity in the current sea dike design standard to suit the
reality.
The thesis has proposed the formula for calculating the maximum
velocity appearing at the embankment foot when the wave is impacted.
However, the number of experimental scenarios is still modest. When
designing the roughness to prevent rock, it is necessary to have more
experiments to measure the velocity at the embankment so that there will
be accurate data for the construction of hydraulic drag coefficient Cd.
It is necessary to study the energy reduction and wave pressure impacts
on the revetment when considering the simultaneous influence of the
roughness of the roof and the height of the roughness.
Additional research is needed on energy issue as well as wave pressure
impacting on the embankment when considering the simultaneous
effects of roughness level and roughness height.
24
LIST OF PUBLISHED WORKS
1) Le Xuan Roanh1, Pham Van Lap2, Hoang Duc Thao3. Le Tuan Hai4 “Toe dike-
Traditional Structure and needed improvement requirements”, Transportation
Journal, Special edition (57th year), ISSN 2354-0818, Excerpt from the
International Conference on Sustainability in Civil Engineering (ICSCE 2016),
Hanoi.
2) Le Xuan Roanh1, Pham Van Lap2, "Research on improving the structure of
sea dike revement to prevent rocks sliding onslope due to waves and impact
currents", Journal of Structural Engineering & Construction, No. ISSN
1859.3194, 19020 / IV-2015, Hanoi 2015;
3) Pham van Lap, Le Xuan Roanh, Le Tuan Hai, "Study of Rock running and
proposed concrete plate solutions erosion of embankment on Cathai sea-dike,
Haiphong" Proceding of Vietnam-japan Workshop on Estuaries, Coasts and
Rivers2015 ", Hoian, Vietnam, 2015.
4) Pham Van Lap, Le Xuan Roanh, "Research to improve the structure of sea
dike roof protection to prevent the phenomenon of sliding rocks on revetment
due to waves and impact currents." Thuyloi University, Hanoi. 2015.
5) Pham Van Lap, Le Xuan Roanh, "Mechanism of movingrocks at the seadike
toe" Collection of reports of the National Conference of Water Science 2017,
Hanoi 2017.
6) Pham van Lap, Le Xuan Roanh (2015), Permision Paper of Patent, Structure
of Sea dike protection layer, No. 17147, Decision No. 43706/QD-SHTT.
Ministry of Science and Technology, Department of Intellectual Property.
2
Usually, the coastal area is usually divided into four regions based on the transformation of waves from deep water into shallow water: shoaling zone, breaker zone, surf zone and swash zone. The area of the dike foot of the embankment is swash zone , when the waves reach the slope of dike, it will climb and stop, flowing down which is called as going up anf fall down flows. Those flows directly affects the material at the foot of the embankment. 1.2.3. Wave flow due to waves attacking the foot of the shallow toe When waves coming up and fall down on the sloping roof, being affected by the terrain and wind direction, there are three main types of currents at this area: cross-shore, long-shore and Rip (concentrated currents forward to the sea side). The dike toe is influenced by two flows as horizontal and longshore bank flows, the Rip flow is less affected comparing with two athers. a) Cross-shore flow When the mass of water due to the wave carries close to the shore it dissolves and this amount of water will have to return to the sea - that is the reverse flow or undertow. The bottom flow can be relatively strong, usually 8-10% of √𝑔𝑑𝑠 at the point of measurement near the bottom. Research on bottom flow has been made by Longuet-Higgins (1953), Dyhr-Nielsen and Sorensen (1970), Dally and Dean (1984), Hansen and Svendsen (1984), Stive and Wind (1986), and Svendsen, Schäffer, Hansen (1987) (EM 2002) [7]. (b) Undertow on the beach When the wave travels from the sea to the shore, the current velocity is divided into 3 parts: surface velocity (wave front), velocity of the sub-surface water mass and undertow flow velocity. The direction of the velocity of these regions is opposite.
− 𝛾𝐿𝑛
2).0.5𝑒−0.5 𝑘𝑡 cos(𝜛𝑜−𝐵)]/2𝜛𝑜
(1.20) . Figure 1.8: Longuet-Higgins flow velocity diagram (1953) The current velocity at the bottom is determined as follows: 𝑈̅.𝑢𝑛𝑑𝑒𝑟𝑡𝑜𝑤 =
𝑠𝑖𝑛𝛼[1−(4𝜛𝑜
Inside: α- bottom slope; Ln- change of the water level; ϓ- Breaking wave standard; k - coefficient of bottom resistance; characteristic coefficient:
3
− ); t- Calculation time when wave propagates. ϖo = √(
𝑘2 4
𝑔 sin2 𝛼 𝛾ℎ𝑜
(c) Vertical flow + According to Longuet-Higgins (1970) [9], [10] He has given the formula for calculating the longshore current velocity:
U = (1.21) 𝞬b √𝑔𝑑𝑠 sin 𝛼 cos 𝛼
tan 𝛽∗ 𝐶𝑓
5𝜋 16 Inside: U- longshore current velocity;Tanβ * - The slope of the corrected beach slope, 2/8);Cf - coefficient of bottom friction;α- slope angle of Tanβ*= Tanβ /(1+3 𝞬b beach;𝞬b - breaking wave standard. (d) Flow in swash zone Swash zone is the area of wave impacting on the shore area in the form of water level fluctuation between the run-up and down waves. The swash zone is conected betwen land and sea. The swash region is strongly related to the surges in the slope and when the waves fall down the slope. The run- up flows are usually much stronger than the down flows. According to Ruessink and Van Rijn [16], the velocity of run-up wave can be approximated: ub = √ (gds) with ds in the range of 0.1m to 0.2m, it accelerates to reach ub from about 1m / s to 3 m/s. According to the study of Van Rijn et al. 2018 (linear wave theory) [17], [18], the maximum flow velocity at the bottom can be expressed as follows:
Umax= Hs(Tp)-1sinh-1 (2ds/Ls)
(1.23) Inside: ds is the water depth (m); Hs is the wave height, Tp is the wave period, Ls is the wavelength. 1.3 Study of stability of fill rocks dike toe 1.3.1 Study the foot of embankment of stone in the world a) Study of steady flow, horizontal direction and stabilize solid Considering material particles in an environment with flow velocity, it is affected by 5 force components as shown in Figure 1.12 [19]. In which FD is the dragging component due to the impact flow, FS is the cutting force due to the bottom stress, FL is the lift force caused by the flow curvature, FF is the friction force between the particles holding it when moving. W is the weight of the particle itself. Different forces of the effect flow on the particle are determined as follows [19]. Relationship between the parameters proposed by Izatbat:
2 𝑢𝑐 2𝑔
(1.26) = 1.7 𝑜𝑟 ∆𝑑 = 0.7 ) uc = 1.2 √2𝑔𝑑∆ ( 𝑜𝑟
𝑢𝑐 √∆𝑔𝑑
4
Figure 1.12: Impacting force of flow on particles in horizontal direction. When calculating with the rock at the foot of the embankment, the density of seawater is equal to γn = 1025 kg/m3, density of the quarry rocks γđ = 2400kg/m3, formula (1.26) can be rewritten: (1.27). uc = 6.156√𝑑
inside: uc - limit speed (m/s); d- typical diameter of a stone (m); g- gravitational acceleration (m/s2); In this formula horizontal velocity has no effect of water level. In fact Izbash did not determine the position of velocity and did not specify how to determine the particle diameter [19]. This formula is mainly used to estimate in the case of known bottom velocity, but correlation of unspecified flow depth, like a stream flowing into a water body. + The flow of water proceeds to the slope Stability of the solid block under the impact of flow is shown by the following formula (Pilarczyk - 1990) [20], [21], [22] DΔ = Ucr2. (1.31)
0.035∗Φ∗𝐾𝑇∗𝐾ℎ 2g∗Ψ∗𝐾𝑠
Inside: Δ= = Relative density of materials (-),
( 𝜌đ−𝜌𝑤) 𝜌𝑤
(1.34)
D - Thickness of protection layer (m), g- Gravity acceleration (g = 9.81 m/s2), ucr - Directional average flow velocity on slope (m/s), Φ - Stability coefficient (-), Ψ – Limited Shields Number (-), KT - Coefficient of turbulent flow (-), Kh - Flow depth coefficient (-) Ks - Roof slope coefficient (-). Replacment of the known coefficients, the formula (1.31) rewrites: Ucr= 1.171√𝐷 (m/s). 1.3.2 Study of stability of embankment foot in Vietnam 1.3.2.1 Experimental and theoretical research
5
(1.37)
Research on erosion of sea embankment is also interested by many Vietnamese scientists. According to the authors Nguyen Van Mao (1999) [23], Nguyen Hoang Ha et al (2003) [25], Vu Minh Cat et al (2008, 2013), Le Hai Trung & et al(2008), Thieu Quang Tuan et al(2008) [26], [27], [28], [29] ... conducted a physical model study at the General Hydraulic Laboratory - Thuyloi University and a mathematical model carried out at the Ministry-level research project in 2007 of Marine Engineering Faculty [4]. In addition to research on physical models, many authors also have studied on mathematical models, using Wadibe- CT program [25], [27]. Wadibe-CT numerical model developed by the Faculty of Marine and Coastal Engineering, Thuyloi University. 1.3.2.2. Application research The published scientific work of dike toe dike in Vietnam is still rare. The types of dike toe are mainly used for hollow wells (circular and regular polygon shapes), foot-lock beams, gabions, and matric of rock covering bed of floor, that depended on the geological conditions and the design boundary. The research of Marine Engineering Faculty staff has contributed more theory to explain the scour at the foot of the embankment concerning to slope of bed and toe made by hollow well. 1.3.3 The disadvantages of dike toe reserch at the momemt At present, some stone works at the foot of the embankment are still unstable, sometime the stone moves away from the original position. - In the calculation according to rules, this does not to mention the solutions to limit solid materials runing up due to the waves pushing on the embankment and rubbing the roof (especially the wave reduction by roughtness colums ). - The dissipation of wave energy on the embankment roof is currently being designed by designers to create raised edges with the height of a few centimeters, an area of roughness on the surface area of about (20 ÷ 40)%. It is necessary to study the effect of roughtness colums height on energy reduction of flow. 1.4. Orienting research issues of the thesis Maximum velocity according to TCVN 9901: 2014 is defined as follows[4]: Umax =
).
Inside: Umax is the maximum velocity of the flow at the foot of the embankment(m/s); Lsp is the design wave length(m); Hsp is the design wave height(m); ds i the water depth at toe of the embankment(m); g is the gravitational acceleration(m/s2
6
7
Comparing the formula (1.37) with the formula (1.23), the formula (1.23) has mentioned the wave period factor (Tp) considering the influence Tp to the maximum velocity at the foot of the embankment. However, the velocity at the foot of the embankment is also influenced by other factors such as slope of the embankment (m), the roughness of the embankment (a), the slope of the beach (i), The breaking wave similar index of Igrabien (). The thesis will focus on theoretical and empirical research to find the current velocity near the bottom of ground, thereby proposing the calculation formula and checking the stone stability at the foot of the embankment. Content included: - Clarifying the flow regime and affecting the stability of shallow toe of dike made of stone; - Developing a calculation method and proposing a process to check the stability of stone placed at shallow toe of seadike. 1.5. Conclusion chapter 1 - Foot embankment as dike toe is an important part of the sea dike structure, it is the base of the revetmet, keeping the body and revetment of dike to be stable under the impact of waves and currents. In general, stability of the embankment in particular and the dike body is depended on the characteristics of the ground geology, the depth of the flow, the wave height and the direction of the flow. At the moment, rubble stone embankment is popularly used in design of sea dike with suitable natural conditions. - The flow at the foot of the embankment is belong to the surf zone, the nearshore area exists the following flows: cross-shore current, longshore current and Rip current, in which the velocity at the foot of the embankment is directly affect by the cross-shore current and longshore current. - There have been many domestic and international studies on current velocity due to waves at shallow toe of seadike. Factors affecting the flow velocity have been studied by Shield, Paintal, De Boer, Lammers, Simons and many other researchers and have many publishs. However, there are some factors that have not been mentioned about the height of roughness, wave slope or similar index of breaking wave. The thesis needs research to clarify the influencing factors that noted abave. CHAPTER 2: DIGITAL MODEL STUDYING FLOWS AT THE SHALOW TOE OF REVETMENT 2.1 Set the problem To expand the scope of the study and the effect of geometric parameters on the velocity of the shallow toe of revestment, the thesis has used MSS-2D numerical modeling to describe the flow velocity vector made by wave, analyzed the influences of hydraulic parameters and construction parameters on flow regime at the foot of embankment; supportted the content of studying physical models which is limited due to experimental conditions.
2.2 Research direction of mathematical model 2.2.1 Some common software in research of coastal wave We can name here some mathematical models using the typical Boussinesq equation system such as: MIKE 21-BW, FUNWAVE, COULWAVE. Besides, there are some studies of mathematical models such as common digital wave flume; IH2 (Spain), SOLA-VOF & DELAWAVE (USA), CADMASURF (Japan) and MSS-2D, WADIBE-CT (Vietnam) [4]. 2.2.2 Digital wave flume 2.2.2.1 Basic equations used in digital wave flume theory Navier-Stokes equations are known as the right equations for describing fluid motion, including problems of wave motion. But to facilitate the application of simplified system of equations from Navier-Stokes equations that can be represented as: Nonlinear shallow-water equation system (NSW), Boussinesq equation system (BAE) and Equation system full nonlinear potential lines (FNPF) . + The model based on a direct solution of the Navier-Stokes equation system in case of closed turbulent flow The thesis will be interested in spatially filtered Navier-Stokes equation using the Smagorinsky turbulent diagram (Smagorinsky, 1963). The turbulent ) of the flow field. The coefficient (
) is determined from the strain stress (
formulas for calculating turbulent coefficient in two-dimensional model are as follows [42]:
(2.1)
(2.2) (2.3) where Cs is the model parameter calculated in the range of:
The author of the thesis has used the theory of digital wave flume by authors Hieu and Tamnimoto to perform calculations [33], [36], [37], [42]. 2D equation system (vertical and horizontal directions), continuous equation is written as follows:
(2.4) The equation for conservation of momentum in the Navier-Stokes system (in the x and z directions):
(2.5)
8
(2.6)
Where: t is time, x and z are horizontal and vertical coordinates; u, w are horizontal and vertical velocity components; is the liquid density; p is pressure; e is the kinematic viscosity coefficient (sum of viscous and turbulent viscous); g is the gravitational acceleration; q is the volume; qu, qw is the momentum source in the x and z directions. Dx, Dz are the energy reduction coefficients in the x and z directions. + Based on the Navier-Stokes equation system, Sakakiyama and Kajima (1992) have developed an extended equation system for unstable flow in an porous environment, in which the drag force due to the porous environment is modeled through drag and inertial forces increasingly due to resistance in the porous layer. The system of equations proposed by Sakakiyama and Kajima (1992) two direction 2D as follows:. Continuous equation.
(2. 7) The equation for conservation of momentum in the Navier-Stokes system (in the x and z directions):
(2.8)
(2.9)
The coefficients: t, x, z, u, w,, p, e, q, qu, qw, v ; x, z and Dx, Dz introduced above. Rx, Rz: Drag coefficient due to the impact resistance of the porous. v, x, z are determined from the parameters v, x, z as follows:
(2.10) with CM is inertial coefficient. The resistance Rx and Rz are determined by the following expression:
(2.11)
(2.12)
9
x, z are the horizontal and vertical distance of the net in a porous environment; CD is the drag coefficient. 2.2.2.2 Structure of digital wave flume The digital wave flume structure is outlined in Figure 2.2. The boundary conditions for running include: liquid edges such as water level, wave height, wave cycle, waveform (regular or random); hard edges including bottom elevation, bottom slope, slope of embankment, roughness... then run and will give preliminary results. In order to obtain the reliability, it is necessary to have a mathematical model test in which two coefficients CD and CM need to do by physical modeling to determine the value. The output part will have supporting software. 2.3 Selection of boundary conditions in running the math model 2.3.1 Bases for setting up calculation parameters and testing physical models
Figure 2.2: Diagram of digital wave flume structure [34] The flow velocity at the foot of the embankment is depended on the water depth (ds), the wave height at the foot of the embankment (Hs), the wave period (Tp), the slope of sea floor (i), the slope of the embankment (m), rough degree (a). To go to the experiment and run the math model, the computational margins are chosen as below. (a) Hydrology in design. Surveying the general shoreline, wave parameters at the design point: according to the calculation design frequency the wave height from 0.2m to 3m and more, corresponding to the wave period of about 5 seconds to 7 seconds in the shallow water zone, the water depth at the foot of the embankment is from 0.5m to 3m and more. Therefore, the thesis will base on this calculation to establish scenarios [4], [38], [39]. (b) Topographic boundary, structure of dike slopes According to the results of the study of the sea dyke program in the first phase from Quang Ninh to Quang Nam (MARD), the average beach slope i = 1% to 2% [4], the common slope of sea dyke is m = 3.0 to m = 3. 5 [4], [40], [43], [44], [45], [46].
10
2.3.2 Modifying MSS-2D digital wave flume model The model uses wave data Hs = 0.8m and Tp = 5.06s (T = 5s) as a basis for modifying the model. The results of model correction show that with the scenario, porosity n = 0.3, Cm = 0.25 and Cd = 1.5 for velocity UmaxTT = 1.26 m/s, the results are consistent TN (m/s) = 1.24 with the results of the physical test with the same condition Umax m/s (see chapter 3). Therefore the MSS-2D digital wave flume model selects the porosity parameters n = 0.3, Cm = 0.5 and Cd = 1.5 as a basis for verifying subsequent scenarios [annex 2]. 2.3.3 Verification of the model in case of without roughness Table 2.4: Results of the largest horizontal velocity test (Umax) by digital wave flume models and physical models
TN(m/s)
TT(m/s) Umax
No. ds(m) Umax
KB1 KB2 KB3 KB4 KB5 KB6 KB7 KB8 KB9 KB10 KB11 KB12 1.5 1.5 1.5 1.0 1.0 1.0 1.5 1.5 1.5 1.5 1.0 1.0 T Hs (m) (s) 0.8 5.06 1 6.96 1.1 6.96 0.6 5.06 0.7 5.06 0.8 5.06 0.8 5.69 0.8 6.96 5.06 1 1.1 6.32 0.7 5.69 0.8 5.69 1.26 1.84 2.26 0.99 1.15 1.27 1.58 2.03 1.59 2.25 1.41 1.57 1.24 2.23 2.35 1.03 1.37 1.46 1.85 2.11 1.66 2.23 1.45 1.62
2.3.4 Verification of the roughness case
Table 2.7: Results of testing the maximum velocity between digital wave flume models and physical models
11
TN(m/s)
TT(m/s)
Umax Cd No. ds(m) Hs (m) T (s) Umax
KB1 KB2 KB3 KB4 KB5 KB6 KB7 KB8 KB9 KB10 KB11 KB12 1.5 1.5 1.5 1.0 1.0 1.0 1.0 1.0 1.0 1.5 1.5 1.5 5.06 6.96 6.96 5.06 5.06 5.06 5.06 6.96 5.69 5.06 6.96 6.96 2.0 1.0 2.1 2.3 2.3 2.3 2.4 2.3 2.3 2.3 2.3 2.2 0.8 1 1.1 0.6 0.7 0.8 0.6 0.7 0.8 0.8 1 1.1 1.08 1.96 2.15 0.81 0.94 1.08 1.06 1.64 1.61 1.45 1.97 1.81 1.12 1.86 2.27 1.08 1.23 1.27 1.12 1.68 1.5 1.35 1.78 1.90
Rou.
2.4 Study of the enery reduction in case of roughness Comparing two options: roughness and non-roughness, the calculation results are shown in the following table: Table 2.10: Comparing two options with and without roughness Umax No. (%) No. T (s) ds(m) Hs (m)
KB1 KB2 KB3 KB4 KB5 KB6 14.3 6.1 4.9 18.2 18.3 15.0 0.8 1 1.1 0.6 0.7 0.8 1.5 1.5 1.5 1 1 1 (m/s) 1.08 1.84 2.15 0.81 0.94 1.08 Umax (m/s) 1.26 1.96 2.26 0.99 1.15 1.27 5.06 6.96 6.96 5.06 5.06 5.06 Note: The decreases efficiency of velocity is named as No in above Table.
Figure 2.5: Ratio of reduction in speed comparing with and without roughness
12
-With the same depth of water (ds) when Hs increases, T increases, the efficiency of decelerated velocity No downward trend. - In terms of water depth ds. When Hs and T are constant, at the small water depth the result in a reduction efficiency No is not higher than that in case of the water depth. This can be explained that when the wave will contact with the revetment and when waves fall down, they are rubbed into the roughness and will create turbulence, flow runs around the rough area, leading to reduce the velocity in this area. - The efficiency of decelerated velocity No at highest level is over 18%, the lowest value is also over 4%. 2.5 Relationship between parameters 2.5.1 Analysis of periodic effects (T), wave height (Hs) to velocity (U) (a) Effect of wave height Hs
Figure 2.6: Relationship between maximum horizontal velocity and wave height b. Effect of T wave cycle
Figure 2.7: Relationship between maximum horizontal velocity and wave period
13
From the form of showing relationships through two figures above (2.6) and (2.7) show that: The maximum flow closed to the bottom is proportional ratio to the significant wave height and wave period. In cases of the wave height is of great significance and the longer the wave period, the greater the flow velocity can get. In which the increase of the cycle is superior to that of the wave height to the increase in velocity. c. Identify the relationship line between the largest bottom velocity and the ratio (ds/L) From Figure 2.8 shows that: The largest close-bottom flow velocity is inversely proportional to the number of waves. The bigger the wave, the smaller the flow velocity due to the bottom-approaching wave. The relationship has a concave curve form. d. Effects of slope to bottom velocity The thesis has run with different slope as cases m = 2.0; 2.5, 3.0, 3.5, 4.0, 4.5 and 5.0.
Comment:
- In the same condition of wave, when the slope reduces, the velocity also decreases too. - The height of Hs is large, the speed is high, the length of the cycle is longer, the greater the velocity; - The lines of velocity are separated with high grade when slope of embankments is in the range of m = 3.5 to m = 4.5.
Figure 2.8: Trend of relationship curves between maximum bottom velocity and function sinh(2πds/L)
14
2.6 Conclusion of chapter 2 The maximum horizontal velocity at the base of the embankment is primarily depended on the main parameters such as: cycle T, wave height Hs, water depth at the toe ds, slope m, the roughness of revestment a, slope sea floor i, in wich the T period has the greatest effect, and then the slope m. The steeper the slope, the greater the velocity, the difference is 2 times when considering m = 2 and m = 5 (Appendix 2).
In addition, it is also depended quite large on the ratio of Hs/ds, considering that with T = 5s, the ratio of Hs/ds = 0.532 and 0.33, the speed difference is 2.0 times. In case of roughness installation, the maximum velocity at the foot of the embankment is significantly reduced. Averagely, the ability to reduce velocity can be from 6% to 18% comparing the same hydraulic boundary conditions namely with and without the instalation of roughness (Appendix 2). In addition, the roughness also has the ability to prevent rock rolling on the slope of the embankment, causing a vortex, limiting the concentration of the flow of the wave head while comes-up as well as when goes down. CHAPTER 3: STUDYING THE FLOW VELOCITY BY WAVES AT SHALLOW TOE USING PHYSICAL MODEL 3.1 Set the problem The flow velocity at the foot of the embankment is influenced by many factors such as hydrological boundary conditions, terrain conditions and cross-section of the project. Research on physical models used modern wave flume with appropriate scaling ratio to simulate waves approaching the foot embankment and make more clearly the flow regime with the influence of geometric elements at the foot of the embankment in cases of with and without roughness that is essential and will be resolved in this chapter. 3.2 Research direction with physical models 3.2.1 Development process of research direction Bcrtrand was the first person to determine the basic nature of similar phenomena and propose a method of dimension analysis. By 1870, W.Froude conducted the experiment. He proposed the famous Froude number, which has done the foundation for the same law of gravity. Next in 1885, O.Reynolds was the first person to apply the Froude number to conduct the River Mersey model experiment, Veron-Harcourt conducted the Rin estuary model experiment. In 1898, H.Engcls has built the first river model experiment in Germany, studied the evolution of natural estuaries. J.R.Freeman has built the first hydrodynamic laboratory of the US Bureau of Standards. So far, there have been many hydraulic laboratories studying wave models using wave pools and wave flumes to carry out many scientific experiments and have introduced many semi-experimental formulas. 3.2.2 Theory of correlation parameters conversion in the model Dimensions are expressed in simple symbols (letters) and close with a square bracket [].
15
Dimensions that cannot be replaced by other dimensions are called "basic dimensions" which can be included here: [L] (length), [M] (volume) and [T] (time), or [F] (force). There are 3 similarities used in model research: Similar in geometry; Similar in kinetics; Similar in dynamics. 3.2.3 Introduction of physical models (a) Wave flume Wave flume is the part that can made and control waves in the flume. The length is depended by the required test set. (b) Control software Wave creation software: regular waves; irregular waves from spectra (PM, JONSWAP, ITTC, etc.); long waves; short waves with spread angles (Cos, Cos2N, etc.); focus waves for simulating extreme events; mixed waves are complex with oscillations; simulate “silver head” waves. (c) equipment and central control room The central control room has equipped with computers at high speed, managing and controlling the wave system, including some tools such as flow velocity measurement equipment, wave height, cycle, pressure, turbidity... 3.3 Basis for selection of experimental boundaries 3.3.1 Selecting test boundary (a) Hydrology boundary of design, (b) Topography boundary and structure of dyke slope, as shown in section 2.3.1. 3.3.2 Experimental wave flume Wave flume has a total length of 45m, effective length of 42m, height of 1.2m, width of 1.0m. The wave generator is equipped with an Active Reflection Compensation (ARC). The wave generator can generate regular or random waves according to some common spectral forms (eg JONSWAP). The maximum random wave height that can be generated in wave flume is 0.3m and cycle 3.0s. Experimental model: Here select the representative m = 3.5 is the average slope.
Figure 3.1: Experimental layout diagram
16
Water depth: the change scenario; wave cycle: the basis of waves on the East Sea; running time for each scenario: about 1000 waves; regular waves and random waves. + Experimental materials - The revesment of dike is made of waterproof material; - Protection layer component: concrete slab with dimentions of 40x40x35cm that is equivalent to 4x4x3,5cm in model size. Fabrication of structure height and hexagonal edge size varies with c = 23mm, 29mm and 35mm, corresponding to the height h = 55mm, 60mm and 90mm [39]. - Protection of toe: using stone size 1x2 stone (cm) that means the size of sive of 20mm time 10mm on the screen sieve (actual size is 10x20cm), 2x4 stone is equivalent to diameter or edge size actually 20x40cm. 3.4 Experimental scenario The author has conducted 24 scenarios with the following parameters: ratio of model 1:10; water depth in flume (d): 2.1 and 2.6 (m); Water depth of foot embankment ds (m): 1.0 and 1.5 (m); wave height Hs (m): 0.8, 1.0 and 1.1 (m); cycle (T): 5.06, 6.92 and 6.32 (s). 3.5 Results of physical wave flume test Table 3.1: Results of measuring the maximum velocity at the foot of the embankment, roughness Cases
TN
Notes Umax m/s)
No . 1 2 3 4 5 6 7 8 9 10 11 12 ds (m) 1.5 1.5 1.5 1 1 1 1 1 1 1.5 1.5 1.5 Hs (m) 0.8 1 1.1 0.6 0.7 0.8 0.6 0.7 0.8 0.8 1 1.1 Ls T (s) (m) 5.06 19.41 1.12 6.96 26.69 1.86 6.96 26.69 2.27 5.06 15.85 1.08 5.06 15.85 1.23 5.06 15.85 1.27 5.06 15.85 1.12 6.96 21.79 1.68 5.69 17.83 1.5 5.06 19.41 1.35 6.96 26.69 1.78 6.96 26.69 1.9 a=50cm, length C= 20cm a=50cm, length C=20cm a=50cm, length C= 20cm a=50cm, length C=20cm a=50cm, length C= 20cm a=50cm, length C= 20cm a=45cm, length C= 20cm a=45cm, length C= 20cm a=45cm, length C= 20cm a=45cm, length C= 20cm a=45cm, length C= 20cm a=45cm, length C= 20cm
Table 3.2: Results of measuring the maximum velocity at the foot of the embankment, the revetment has no roughness
17
Umax
TN(m/s) 1.24 2.23 2.35 1.03 1.37 1.46 1.85 2.11 1.66 2.23 1.45 1.62
TT 1 2 3 4 5 6 7 8 9 10 11 12 ds (m) 1.5 1.5 1.5 1 1 1 1.5 1.5 1.5 1.5 1 1 Hs (m) 0.8 1 1.1 0.6 0.7 0.8 0.8 0.8 1 1.1 0.7 0.8 T (s) 5.06 6.96 6.96 5.06 5.06 5.06 5.69 6.96 5.06 6.32 5.69 5.69 Ls (m) 19.41 26.69 26.69 15.85 15.85 15.85 21.83 26.69 19.41 24.26 17.83 17.83
3.6 Developing empirical formulas 3.6.1 Bases of establishment The author divides the dominant parameters to the maximum velocity at the foot of the embankment into the two basic groups as following: -The hydrodynamic parameters: Hs, T, Ls = Lop; Parameters of geometric characteristics of cross-section of dyke and sea floor of dyke: -Main dominant parameters - Water depth at embankment: ds; - Sub-dominant parameters - slope: m; Iribarren Index: = tanα/(Hs/Lop)0.5; Slope of beach: i (-); roughness height: a (m). Thus the maximum horizontal velocity function will include the following variables: Umax = f(Hs, Tp, ds, a, )
(3.5) The thesis will build a formula based on the formula of calculating the maximum flow velocity close to the bottom of the orbit [54]: Umax= Hs(Tp)-1sinh-1 (2ds/Lop)
(3.6) choose Hs and Tp as the base units with the basic dimensions of [L] and [T], expressions (3.5) written in the form of functions: (3.7) f (π1, π2, π3, π4) = 0
1
3.6.2 Solving and finding extra functions Solve functions for results as following: π1 = Umax , and π4 = . ; 𝜋2 =
𝑇 𝐻𝑠
𝑐𝑜𝑠ℎ (
)
; 𝜋3 = )
sinh (
2𝜋𝑎 𝐿𝑜𝑝
1 2𝜋𝑑𝑠 𝐿𝑜𝑝
3.6.3 General problem To give a general formula, the thesis selects the formulas of (3.8)
18
)
𝑇 𝐻𝑠
𝜋2 =
)
sinh (
𝜋1 = 𝑈𝑚𝑎𝑥( 1 2𝜋𝑑𝑠 𝐿𝑜𝑝 (3.8)
1
𝜋3 =
𝑐𝑜𝑠ℎ (
)
2𝜋𝑎 𝐿𝑜𝑝
𝜋4 = {
Equation drawn: y = a*x^b với a=2.752, b=1.231
1,231
1
or 𝑈𝑚𝑎𝑥𝑇 with R2 = 0.69 (3.9) = 2,752 [ ]
𝐻𝑠
)
cosh(
sinh(
)
2𝜋𝑎 𝐿𝑜𝑝
1 2𝜋𝑑𝑠 𝐿𝑜𝑝
Finally obtained
1.231
1
(3.10) [ ] 𝑈𝑚𝑎𝑥= 2.752
𝐻𝑠 𝑇
cosh(
)
sinh(
)
2𝜋𝑎 𝐿𝑜𝑝
1 2𝜋𝑑𝑠 𝐿0𝑝
Equation (3.10) calculates the maximum horizontal velocity when the parameters considered are Hs, T, ds, Lop, a and . Lop: calculated wave length at design point (m); T: wave period at selected design point (s); Hs: design wave height (m); ds: water depth at toe (m); a: height of roughness (m); : Iribarren Index: = tanα/(Hs/Lop)0,5. Figure 3.2: Exponential form and equation describing the relationship between 1 and 2*3*4 From figures and tables of thesis (Figure 3.3), it can be known that the maximum flow velocity is due to the wave at the near point of bottom according to TCVN 9901-2014. The maximum flow velocity in the general formula is larger than the calculation result in TCVN 9901-2014 with an average comparison value of 1.51 times. The formula of Van Rijn [23] and the results of physical experiments are correlated with the maximum flow velocity in the general formula. The flow at the bottom of the site is depended on the parameters studied: Hs, T, ds, Lop, a and . 3.7 Conclusion of chapter 3 The maximum velocity at the base of the embankment depends on factors such as wave period (T), wave height (Hs), water depth (ds), wave length (Lop), roughness height (a), slope (i), in which the cycle has the strongest effect. With T > 6s, the measured velocity is greater than 2.0 m/s. The formula (3.10) shows how to determine the maximum horizontal velocity that appears at the foot of the embankment. This formula has mentioned 6 factors considering the influence of hydraulic and computational cross-sectional geometry, it is universal more general formula used in TCVN9901: 2014 because it only refers to 3 factors considering Hs, water depth ds and Lop.
19
CHAPTER 4: COMPARISON CALCULATION OF VOLUME OF STONE AT DIKE TOE, APPLING TO THE SEA DIKE OF CAT HAI, HAI PHONG 4.1 General introduction of Cathai dyke, Haiphong Cathai island is surrounded by dikes from Got - Gia Loc - Hoang Chau - Van Chan - Nghia Lo - Dong Bai - Got. In general, the embankment has a rocky phenomenon located at the foot of the embankment which has been moved, rubbed the protection layer, caused serious damage and abrasion. Many types of revetment have been used in this dyke. However, the phenomenon of rock rolling on the slope of the embankment often occurs. 4.2 Damage phenomenon of revetment due to abrasions by solid objects
Figure 4.1:Revetment has been demaged due to rocks runing on and abrasion The reason for this is that the stone located at the foot of the embankment may be insufficient volume or by determining the weight of the stone in the design is not enough or any other reason. In fact, after the storms, the embankment is always rubbed
20
4.3 Design of roughness for dike toe The thesis has calculated and determined the thickness of the protection layer of blocks, rough thickness, and performed laboratory tests. 4.4 Propose a procedure to check the condition of stabilizing stones at the foot of the embankment Step 1: Determine the maximum velocity at the foot of the embankment by the formula (2.10); Step 2: Calculate and select the volume of rock to meet the stable conditions. Check the size of rocks according to the stability conditions specified in the formula (1.27) when considering the horizontal velocity Uc. The diameter of the rocks is calculated as namely diameter.
3 G=V*ρ= D3*ρ, hay D = √
(4.1)
G ρ
21
Inside: 3, Dn is the G is the mass of stone (kg); V is the volume of stone (m3), V = Dn converting diameter of stones, when pouring in layers (m); ρ is the density of the stone (kg/m3). After having D, it will check the following conditions: Check the size of the stone according to the stability conditions specified in formula (1.27) when considering the horizontal velocity Uc. If the speed of the oblique Ucr is determined, then check the formula (1.34): Thus, if the stone is slipped, the height of the barrier of rughness must be at least equal to the converted diameter D of the stone with the weight of G (kg). 4.5 Calculation and selection of protection components 4.5.1 Comment on recent repairs and upgrades at the study dike - Embankment route has used many types of protection and that are very solid and strong, however, the phenomenon of rock rolling on the revetment has not been prevented. - When rocks rolling, it causes abrasion of components, reducing the stability and durability of components. 4.5.2 The detailed design of roughness structure to prevent rock and the shape of components creating roughness + Roughness structure of cross section design in hexagonal form, the edges are described in detail as follows: • Hexagonal edge c = 23cm, horizontal edge 40cm; • Height of block h = 70 cm; • Designed concrete strength R = 250kg/cm2; • Details for construction: hanging d = 10mm, horizontal pier hole to adjust the block when installing with n = 30mm, the distance from hole to top 150mm. + Components inserted betteen roughness Structure to protect the foot with a surface size as the same as roughness, height of structure h = 50cm.
4.6 Comparing and calculating the volume of stones at the foot of the embankmen
T
Table 4.4: Results comparing the difference between the formula (1.37) and (3.10)
TQ
Umax Q T (s) a No. ds(m) Ls (m) Hs (m)
G increasi ng (%)
G refer to Umax (kg)
T Umax CVN( m/s)
g (m/s2 ) (m/s)
0.8 0.8 0.8 0.8 0.8 0.8 KB1 KB2 KB3 KB4 KB5 KB6 1 1 1 1 1 1 5 15.66 9.81 0.0 1.26 1.64 1.19 40 6 18.79 9.81 0.0 1.38 1.93 1.21 40 7 21.92 9.81 0.0 1.50 2.21 1.22 48 5 15.66 9.81 0.5 1.26 1.60 1.19 40 6 18.79 9.81 0.5 1.38 1.90 1.21 40 7 21.92 9.81 0.5 1.50 2.18 1.22 47
G refer to TCV Umax N (kg) 0% 40 40 0% 40 21% 0% 40 40 0% 40 18%
4.7 General comments on the proposed plan - The proposed plan satisfies the requirement of increasing the ability to reduce flow velocity when flowing through the abutments. - Rough threshold height h = 43cm enough to prevent components when moving through. - The design is in harmony with the general structure of the project. 4.8 Conclusion of chapter 4 When applying the formula (3.10) to calculate the sea dike toe velocity, it will give greater value when applying the formula (1.37) of TCVN 9001-2014, corresponding to the minimum volume of foot-stone carpet will be safe. The instability of the foot stone of Cathai sea dyke is very likely due to the size of the calculation of the design of the stone which is still small. Arrangement of roughness has the effect of reducing the maximum velocity at the foot of the embankment, increasing the stability of the foot mats or reducing the minimum volume of foot stone. The size of roughness can be seen in the author's exclusive registration form and the research team to choose suitable result [40].
CONCLUSIONS AND RECOMMENDATIONS
1. Achievements of the thesis (a) Theory research - When studying the sea embankment in particular, the body is generally dependent on the geological characteristics, flow depth, wave height, wave period, slope, and direction of the flow compared to main axis of sea dike;
22
23
The stability of the foundation has a direct impact on the dike toe and stability of the revetment and the dyke body. The calculation of the maximum design velocity considering the above influences has contributed to clarifying the mechanism of rock moving at the foot of the embankment. - The thesis has synthesized and analyzed the research methods of stability and instability of the beach neared to toe of the embankment, stated the advantages and disadvantages of different types of revetment from which it will propose research method and scope of application of the formula for calculating the maximum velocity at the foot of the embankment to determine the size of the foot protection material. (b) Experimental research using physical models and mathematical models In order to find out the cause of damage to the foot embankment, mobile materials from the revetment, the thesis has done a physical model experiment, at the Department of Integrated laboratory, Thuyloi University, the results show that: The measurement velocity of 24 scenarios shows that the measured actual velocity is greater than 1.1 to 1.68 times (or greater with a large T period) the calculated velocity according to the formula specified in the current design standard. Based on the results of the physical model, the author used mathematical modeling to expand computational margins. The end result is: the flow velocity due to the wave that be affec factors such as wave height (Hs), wave period (T), wavelength (Lop), depth water at foot embankment (ds), slope (m). This velocity has been highly dependent on wave cycles-T, Hs, slopes and Irribaren Index. If Hs increases, the slope is steeper, the velocity increases. The maximum horizontal velocity at the foot of the embankment is determined in the formula (3.10). (c) Applied research into actual works Sea dykes in some parts of northern and centra- northern in general as well as Cat Hai Phong sea dike in particular... these works are disadvantages of the structures and stones used in the works, and the stone blocks built on beach, it always be effected by waves on the embankment, causing abrasion and leading to damage, weakening the quality of the roof. The thesis has applied a stable calculation of roof and foot protection components when designing for a project in Hai Phong. The calculation results are designed in accordance with the reality and the current status of the project is stable, sustainable and fine art since the invention was granted with intellectual property [40], [Aannex 3]. 2. New contributions of the thesis The thesis has made the following main contributions: - Formulated the formula for calculating the maximum horizontal velocity at the toe of embankment when considering many factors including: T, Hs, ds, Lop, tanα, a, and as shown in formula (3.10).
- The thesis has clarified some factors affecting the flow due to waves in shallow toe of embankment area. 3. Disavantages and direction of development (a) Disadvantages The thesis has proposed the formula for calculating the maximum velocity appearing at the embankment foot when the wave impacting. However, the number of experimental scenarios is still modest. The thesis has studied the effect of sloping roof by mathematical model but has not yet tested in the physical model fully so it has not been included in the general formula. (b) Development direction Further research is needed on the effects of the slope of the works and the slope of the beach by empirical models to set up the maximum velocity formulas at the foot of the embankment related to these two factors. 4. Recommendations
The thesis has given the result of calculating the maximum velocity of wave-induced flow greater than the current regulated value. This is the initial basis for reference, to adjust the formula for calculating the maximum velocity in the current sea dike design standard to suit the reality.
The thesis has proposed the formula for calculating the maximum velocity appearing at the embankment foot when the wave is impacted. However, the number of experimental scenarios is still modest. When designing the roughness to prevent rock, it is necessary to have more experiments to measure the velocity at the embankment so that there will be accurate data for the construction of hydraulic drag coefficient Cd. It is necessary to study the energy reduction and wave pressure impacts on the revetment when considering the simultaneous influence of the roughness of the roof and the height of the roughness.
Additional research is needed on energy issue as well as wave pressure impacting on the embankment when considering the simultaneous effects of roughness level and roughness height.
24
LIST OF PUBLISHED WORKS
1) Le Xuan Roanh1, Pham Van Lap2, Hoang Duc Thao3. Le Tuan Hai4 “Toe dike-
Traditional Structure and needed improvement requirements”, Transportation
Journal, Special edition (57th year), ISSN 2354-0818, Excerpt from the
International Conference on Sustainability in Civil Engineering (ICSCE 2016),
Hanoi.
2) Le Xuan Roanh1, Pham Van Lap2, "Research on improving the structure of sea dike revement to prevent rocks sliding onslope due to waves and impact
currents", Journal of Structural Engineering & Construction, No. ISSN
1859.3194, 19020 / IV-2015, Hanoi 2015;
3) Pham van Lap, Le Xuan Roanh, Le Tuan Hai, "Study of Rock running and
proposed concrete plate solutions erosion of embankment on Cathai sea-dike,
Haiphong" Proceding of Vietnam-japan Workshop on Estuaries, Coasts and
Rivers2015 ", Hoian, Vietnam, 2015.
4) Pham Van Lap, Le Xuan Roanh, "Research to improve the structure of sea
dike roof protection to prevent the phenomenon of sliding rocks on revetment
due to waves and impact currents." Thuyloi University, Hanoi. 2015.
5) Pham Van Lap, Le Xuan Roanh, "Mechanism of movingrocks at the seadike
toe" Collection of reports of the National Conference of Water Science 2017,
Hanoi 2017.
6) Pham van Lap, Le Xuan Roanh (2015), Permision Paper of Patent, Structure
of Sea dike protection layer, No. 17147, Decision No. 43706/QD-SHTT.
Ministry of Science and Technology, Department of Intellectual Property.