* Corresponding author
E-mail address: yohan.wismantoro@dsn.dinus.ac.id (Y. Wismantoro)
© 2020 by the authors; licensee Growing Science.
doi: 10.5267/j.uscm.2020.4.003
Uncertain Supply Chain Management 8 (2020) ****–****
Contents lists available at GrowingScience
Uncertain Supply Chain Management
home
p
a
g
e: www.Growin
g
Science.com/usc
m
The effect of IS SERVQUAL and user information satisfaction (UIS) adoption on user
satisfaction
Yohan Wismantoroa*, Heribertus Himawana and Karis Widiyatmokoa
aUniversitas Dian Nuswantoro, Semarang, Indonesia
C H R O N I C L E A B S T R A C T
Article history:
Received January 29, 2020
Received in revised format March
20, 2020
Accepted April 21 2020
Available online
April 21 2020
Information systems are essential resources for business organizations. Besides, user
information satisfaction will have an impact on service quality. This research used a
Myerscough study, which combined user information satisfaction and SERVQUAL
instruments, which was to measure the quality of information system services and investigated
the correlation between the quality of information system service and user satisfaction. The
survey was conducted on traditional Batik and textile artisans in Central Java, Indonesia. The
results of this research reported a model that is slightly in accordance with previous studies.
The only variable, which influenced the quality of information system services through
SERVQUAL was empathy. However, information system user satisfaction was proven to be
affected by the quality of information system services. This study also recommends further
research on better instruments for assessing the quality of information system services.
.2020 b
y
the authors; license Growin
g
Science, Canada©
Keywords:
Information System
User Information Satisfaction
Service Quality
1. Introduction
The current paradigm regarding company strategy is not only how to defeat the competitors but also
how to build satisfaction of customers (Alegre, 2013; Vu, 2014; Blank, 2014; O, Malley, 2014; Shao,
2016; Escrig, 2018; Putri, Udin, & Djastuti, 2019). With the creation of customers’ satisfaction, it will
encourage them always to use the product or the services again. In general, every company believes in
one of concept or philosophy marketing, which become the basis of every activity in satisfying the
needs and desires of customers, including in the market place (e-commerce), which has begun to
become a business platform. With the broader acceptance of smartphone and tablets in people lifestyle,
mobile shopping has become increasingly popular in recent years (Gandhi, 2016; Kanaanm, 2017;
Ferdinand, 2002). Shopping services via mobile devices using wireless facilities allow shopping to be
done everywhere and provide consumers convenience in shopping. As a result, mobile commerce is a
behavior of using mobile technology as well as consuming behavior. The importance of mobile
commerce increases, and it broadens the power of consumers in shopping. Different with traditional
electronic commerce, cellular trading allows the emergence of shopping everywhere through various
mobile devices, such as smartphones, tablets, notebook computers, etc. The mobile device eliminates
the time and location limits for shopping. Consumers can easily get the latest product
information/promotions for their shopping needs and, of course, save time shopping in accordance with

2
their lifestyle. However, the literature to view mobile commerce behavior in the perspective of
consumer behavior is still limited (Agrebi dan Jallais, 2015; Faqih dan Jaradat, 2014). Besides, not all
perceived usefullness motives all group of mobile shopping service users (Shangand Wu, 2017; Park
et al., 2019; Choe, 2018). The perspective of consumer behavior, consumer users, and user satisfaction
are the concern in mobile commerce (Ardiansah, Chariri, Rahardja, & Udin, 2020). In this case, the
success model of information system (IS) shows the importance of system and user satisfaction in
achieving user benefits. To explore the impact of usage and user satisfaction on mobile shopping
platforms, therefore, this study conducted an empirical survey based on the success model of
information system (IS).
Many studies have been accomplished to measure service quality and information system user
satisfaction. Instruments for measurement have also been extensively studied. Ives et al. (1983)
researched to measure the satisfaction of information system users. The instrument was called UIS
(User Information Satisfaction). They conducted an exploratory factor analysis of the variables
affecting the quality of information system services. Besides, many other scientists researched service
quality in the field of marketing called SERVQUAL (e.g. Parasuraman, Zeithaml, Berry, 1988; Pitt,
Kavan, & Watson, 1995; Becker & Pizzutti, 2017; Burns et al., 1992; Babacus & Mangold, 1992). In
this study, it can be said that SERVQUAL met the requirements to be used as an instrument to measure
the quality of information system services. Also, Kettinger and Lee (1995) tried to use SERVQUAL as
an instrument to measure the quality of information system services. In their research, the tangible
dimension is a dimension that is not suitable to be applied, but the other four dimensions are
scientifically proven to be suitable for use. Moreover, Kettinger and Lee (1994) also suggested that
SERVQUAL can be combined with User Information Satisfaction (UIS) as an instrument to measure
the quality of information system services.
This study tries to investigate the effect of service quality on user satisfaction. The instrument used was
an instrument developed by Myerscough (2002), which was a combination of UIS and SERVQUAL
instruments as tools to measure service quality. Further, the question of global quality assessment from
UIS would be used as an instrument to measure user satisfaction. The dependent variable was the
overall quality, which would be measured using UIS and SERVQUAL indicators, while the
independent variable was user satisfaction. In the overall quality variable as an unobserved variable,
UIS indicators were grouped into three dimensions; namely knowledge and involvement, product
quality information, and attitude of EDP staff and services, whereas indicators for SERVQUAL would
only use two dimensions, namely: reliability and empathy.
2. Literature Review and Hypotheses Development
2.1 Management of information systems
Information management can be defined as the activity of obtaining information, using it as effectively
as possible and discarding it when appropriate. O'Brien (1999) divided the information system area into
five major parts, namely: management of information systems, development of information systems,
application of information systems, the technology of information systems, and foundation concepts of
information systems. Thus, information systems are a combination of organizing people, hardware,
software, communication networks, and data sources, where information is called, transformed, and
distributed within an organization (Avgerou, 2000; Maguire, 2000; DeLone, 2003; Gupta et al., 2019).
In addition, data is a collection of unprocessed facts and figures that are relatively meaningless to the
user. Meanwhile, information is data that has been managed and processed so that it has a particular
meaning for the user. The system itself is a collection of integrated elements with the same intention to
achieve the goal (McLeod, 1995). However, concerning computer-based information systems, two
knowledge is needed, namely: knowledge of computers and information literacy (O'Brien, 1999). Both
of these knowledges are different information for each domain. Knowledge of information in the field

Y. Wismantoro et al. /Uncertain Supply Chain Management 8 (2020) 3
of construction companies is undoubtedly different from information knowledge in the medical field.
For this reason, we need expertise from each party to develop information system.
2.2 User information satisfaction (UIS)
Information systems can be used as one of the competitive advantages in a strategic organization. The
decision to install an information system is an option to determine whether an information system is
indeed needed, and after that, the system must function properly. The UIS is described where system
users believe that the available information system can be used to meet their information needs. This
instrument was developed by Ives et al. (1983). They tried to examine the difference between using
two and four question items in one variable without reducing validity based on the results of Pearson’s
research. It aimed to reduce the number of indicator items in the Pearson model, which reached to 39
items. The method used was the exploratory factor analysis. From the results of Ives et al. (1983), it
was found that the validity and reliability of the data was not affected by measurements using two items
per scale. Nevertheless, this instrument was still considered for years. For this reason, the selection of
genuinely relevant indicators without reducing validity and reliability was needed. Some less
meaningful indicators were excluded from the indicators. As a result, 22 indicator items are still
maintained. The results of this simplification are often referred to as short-form UIS (UIS Short Form)
(Ives et al., 1983; Groß, 2015).
2.3 IS SERVQUAL
Consumer perceptions of service quality levels have been the focus of research in marketing
(Myerscough, 2002; Carr, 2002; Senthil, 2017). Parasuraman et al. (1988) found that service quality is
determined by the comparison between what customers feel about what should be offered/provided
with what has been offered/provided. The perception of service quality is seen from the level and
direction of the difference between customer perceptions and expectations. There is a difference
between service quality and customer satisfaction, where the perception of service quality is a global
assessment or behavior related to service superiority. In contrast, satisfaction is related to specific
transactions. In their research, Parasuraman et al. (1988) used a model that included ten dimensions,
namely: tangibles, reliability, responsiveness, communication, credibility, security, competence,
courtesy, understanding/knowing the customer, and access. Measurements were made using 97
question items. The final results of the study prove that only tangibles, reliability, responsiveness,
assurance, and empathy had validity to the quality of service. As for measurement instruments, it used
22 question items.
a. Tangibles are the appearance of physical facilities, including equipment, personal, and means
of communication.
b. Reliability is the company's ability to keep and fulfill promises given to customers convincingly.
c. Responsiveness is quickly responsive in reading and serving the desires or needs of consumers.
d. Assurance, namely knowledge, reliability, and courtesy of employees which can be trusted and
confident.
e. Empathy is personal care and attention given by personal/individuals in the company to
consumers.
Information systems researchers often face the risk of incorrect measurement of the effectiveness of
information systems, because they often ignore the quality of information system services (Pitt et al.,
1995; Maguire, 2000; Chrisanthi, 2000). Pitt et al. (1995) suggest the use of SERVQUAL as an
instrument to measure the quality of information system services. It is because the information systems
department provides broader services, where previously, they only acted as developers and operations
managers as service providers. The effectiveness of information systems is a multi-dimensional
construct. Virtually, all tangible products have intangible attributes, and all services have tangible

4
values (Pitt et al., 1995; Fawcett, 2011). In some cases, the product is only a bridge to get services. For
example, personal computer users do not just want a computer machine. They also expect installation
services, training in the use of software, technical support, and so on. Goods and services are not things
that can be clearly separated. They exist in the tangibility spectrum, ranging from pure products to
services as a whole, with a combination somewhere near the midpoint. Frequent measurements are
focused on the final spectrum in terms of tangibility. Pitt et al. (1995) argued that service quality, as a
spectrum on the reverse side, needs to be considered as an additional measure of information system
success. There are two possible units for analyzing the quality of information system services, which
are the Department of Information Technology and Information Systems itself (Fawcett, 2011;
Hummel, 2015; Hoda, 2016; Hoda, 2017). When a user only interacts with one system (for example, a
salesclerk who serves customers via the telephone), the user’s impression of the quality of service is
limited to that one system. In this case, the unit of analysis is the information system itself. On the other
hand, if the user interacts with various systems (e.g., personnel managers) that uses human resource
information systems, word processors, spreadsheets, etc., the unit of analysis can be either the system
itself or the information systems department. However, the separation of multi-system users is
irrelevant. For example, a user who has difficulty getting repair services, then attention is not directed
to the existing system, but the services of the information systems department. Although the quality of
the system and the information quality are often associated with specific software products, it does not
always mean the quality of service. Regardless of whether users interact with one or many systems,
service quality can affect user usage and satisfaction (Hoda 2016; Hoda 2017). The difference between
the service expected and received is the gap. Parasuraman et al. (1988) operated a conceptual model of
service quality through gap measurement as a measurement of marketing constructs. The measurement
uses two statements, where one statement is to measure expectations, and one statement is to measure
perception.
2.4 Service-dominant logic (SDL)
Dominant Logic Service theory tries to revise various theories, including SERVQUAL, which has long
been used by researchers. The service industry is a pillar of the current global economy; thus, the
concept of service-dominant logic does not separate between the goods-dominant logic and service-
dominant logic. Service-dominant logic plays a key role in the intangible role, namely, service
excellence in matters related to intangible marketing programs, such as values, co-creation, how to
provide satisfaction to customers, how to focus on customers, and so on. When a company fails to
provide satisfaction to its customers, it requires hard efforts to improve it (Cheung & To, 2016; Aryanto
et al., 2018; Soliha et al., 2019; Sekaran, 2006; Wong et al., 2012). Wu et al. (2018) examined the
relationship between co-creation values that are part of the service-dominant logic and the customer-
centric concept. S-D logic is expanded into an exchange relationship between a company and its
customers formed from the perspective of an ecosystem that integrates corporate resources and the co-
creation values of customers (Lusch & Vargo, 2014; Grönroos, 1991; Kaplan, 1991; Van Dyke et al.,
1997, 1999). S-D logic is essentially not universally adopted by service marketers. Co-creation values
are created because of interactions with customers. Value is defined as value-in-use (value of benefits)
in the universal sense. At the same time, the understanding of S-D logic emphasizes that value is created
dynamically between the company and its customers by combining value-in-use with value-in-context
(value is created due to a specific context). As mentioned above, value-ini-use (customer-centric) and
value-exchange (supplier centric) are the main components in the value-in-context of an embodiment
of the co-creation network. According to the review of literature and previous research, the researcher
developed the conceptual framework in this study, as follows:
Based on the construct above, the hypotheses proposed were:
H1: Knowledge and involvement affect user information satisfaction.
H2: Quality of information product affects user information satisfaction.
H3:Attitude toward EDP staff and service affect. user information satisfaction.
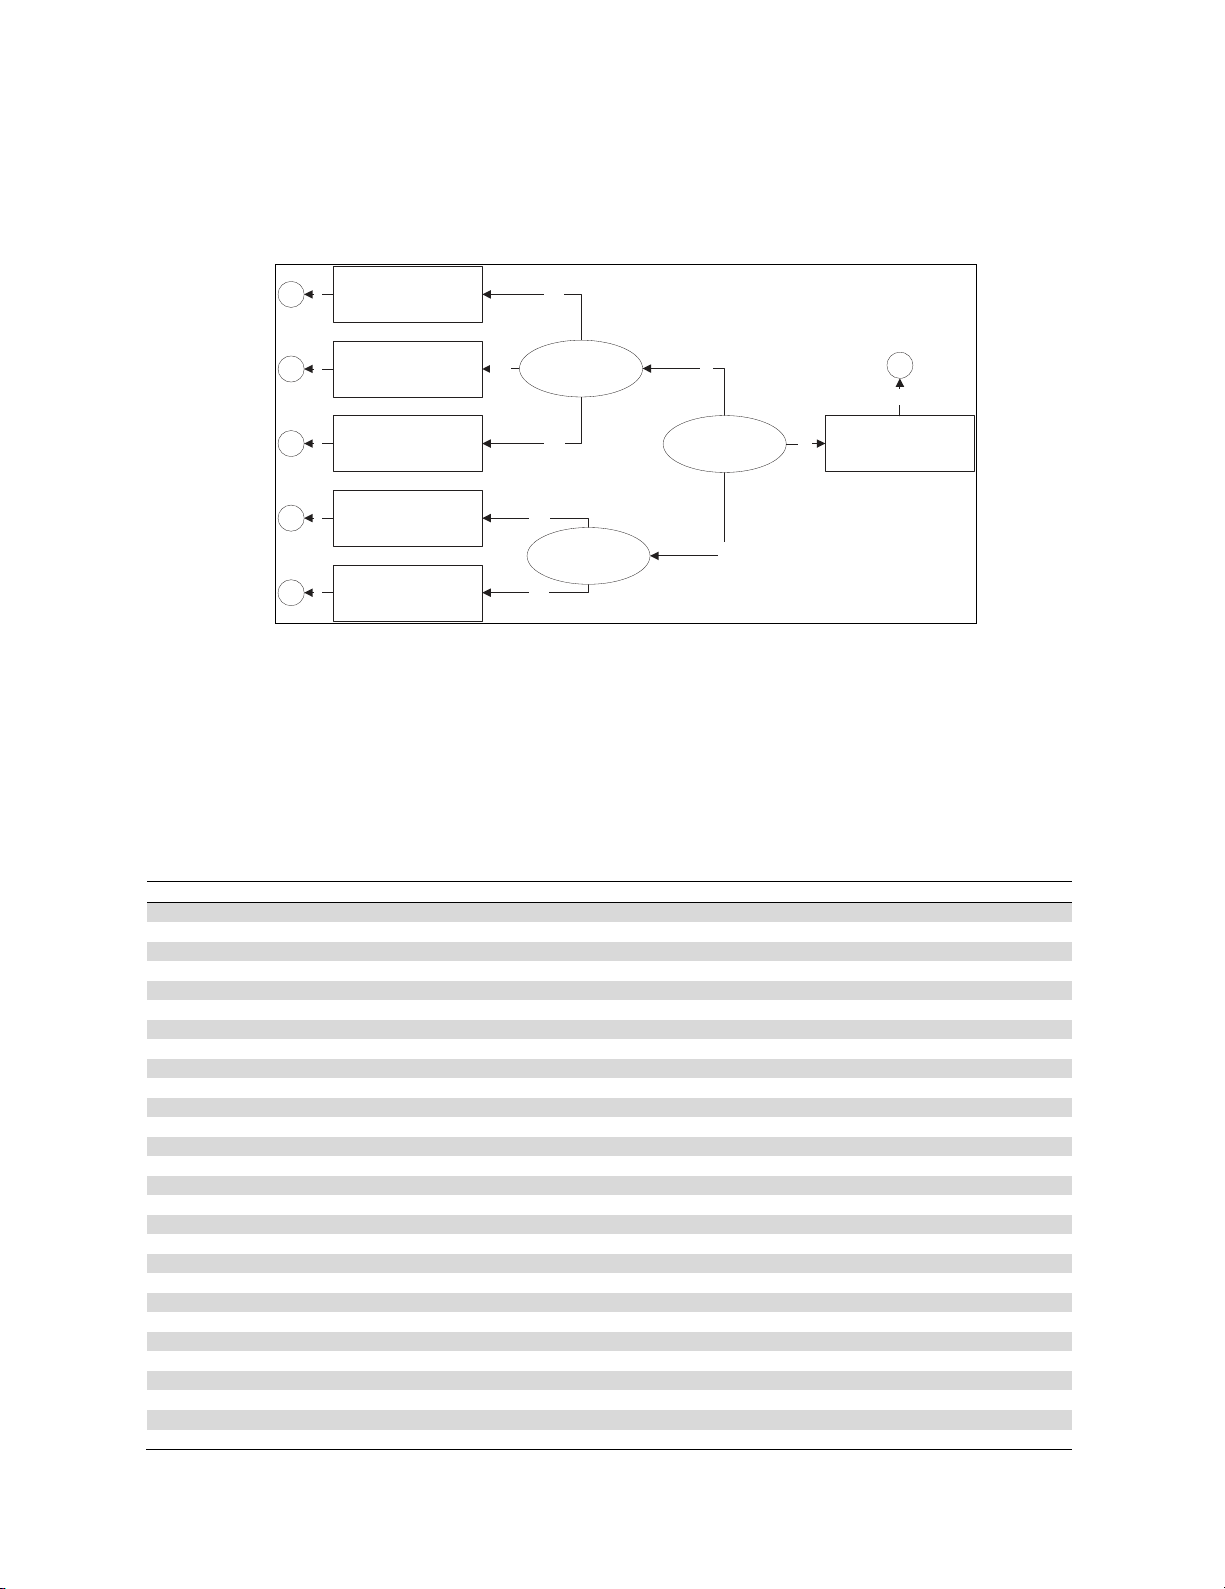
Y. Wismantoro et al. /Uncertain Supply Chain Management 8 (2020) 5
H4: Reliability affects IS SERVQUAL.
H5: Empathy affects IS SERVQUAL.
H6: User information satisfaction affects the overall quality.
H7: IS SERVQUAL affects the overall quality.
H8: Overall quality affects user satisfaction.
Knowledge &
Involvement-UIS
(X1)
Empathy
Servqual
(X5)
Reliability
Servqual
(X4)
Attitude Toward EDP
Staff & Service-UIS
(X3)
Quality of Information
Product-UIS
(X2)
λ1.1
λ1.2
λ1.3
λ2.1
λ2.2
λ1
λ2
Overall Quality
(ξ1) γ1User satisfaction
(ή1)
User Information
Satisfaction (ξ2)
IS Servqual (ξ3)
ζ1
ζ6
ζ5
ζ4
ζ3
ζ2
1
1
1
1
1
1
Fig. 1. Research Framework
3. Research Methods
The population in this study were all traditional Batik and Textile artisans in Klaten, Central Java,
Indonesia. The number of samples in this study was 260 people. Then, the data were processed
employing structural equation modeling (SEM) analysis with Amos 19 software.
Table 1
Hypotheses Testing
Estimate S.E. C.R. P
IS SERVQUAL Overall Qualit
y
.842 .111 7.569 ***
UIS Overall Quality 1.000
Kn & In-UIS UIS 1.000
QIP-UIS UIS .925 .099 9.354 ***
AESS-UIS UIS .485 .076 6.344 ***
Rel-SQ IS SERVQUAL 1.000
Emp-SQ IS SERVQUAL 1.311 .149 8.824 ***
User Satisfaction Overall Qualit
y
1.492 .161 9.289 ***
UIS3 Kn & In-UIS 1.000
UIS4 Kn & In-UIS .807 .077 10.527 ***
UIS5 Kn & In-UIS .682 .067 10.164 ***
UIS7 QIP-UIS 1.000
UIS8 QIP-UIS 1.036 .069 14.924 ***
UIS9 QIP-UIS .951 .074 12.877 ***
UIS10 QIP-UIS 1.326 .098 13.515 ***
UIS6 AESS-UIS 1.000
UIS11 AESS-UIS .502 .105 4.790 ***
SQ1 Rel-SQ 1.000
SQ3 Rel-SQ 1.553 .130 11.922 ***
SQ4 Rel-SQ 1.540 .130 11.866 ***
SQ14 Emp-SQ 1.000
SQ16 Em
p
-SQ 1.081 .100 10.808 ***
SQ17 Emp-SQ 1.096 .105 10.469 ***
SQ18 Em
p
-SQ .884 .140 6.334 ***
E1 UserSatisfaction 1.000
E2 UserSatisfaction 1.050 .084 12.465 ***
E3 UserSatisfaction 1.021 .054 18.839 ***
E4 UserSatisfaction 1.029 .084 12.197 ***


![240 câu hỏi trắc nghiệm Kinh tế vĩ mô [chuẩn nhất]](https://cdn.tailieu.vn/images/document/thumbnail/2026/20260126/hoaphuong0906/135x160/51471769415801.jpg)

![Câu hỏi ôn tập Kinh tế môi trường: Tổng hợp [mới nhất/chuẩn nhất]](https://cdn.tailieu.vn/images/document/thumbnail/2025/20251223/hoaphuong0906/135x160/56451769158974.jpg)


![Giáo trình Kinh tế quản lý [Chuẩn Nhất/Tốt Nhất/Chi Tiết]](https://cdn.tailieu.vn/images/document/thumbnail/2026/20260122/lionelmessi01/135x160/91721769078167.jpg)


