
Material handling cost opmizaon for a pushbelt manufacturing company using computerized relaonship layout planning Algorithm *Le Duc Hanh, Le Duc Dao and Truong Quoc KhoiHo Chi Minh City University of Technology, Vietnam Naonal University ABSTRACTThe strategic arrangement of a shop floor plays a crucial role in determining the operaonal effecveness and financial performance of a manufacturing facility. The layout directly influences producvity, workflow, and even employee safety, making it a key factor in a plant's success. In this study, the objecve is to refine the facility layout of a push belt manufacturing plant to decrease potenal contract penalty fees that may arise from delays and to diminish the expenses associated with material handling. To address this challenge, the research adopts the computerized relaonship layout planning (CORELAP) Algorithm to formulate an opmized layout. The implementaon of this algorithm aims to reorganizing the shop floor to streamline the movement of workers and materials. The ancipated outcome of the newly designed layout is a significant reducon in the travel distance required for employees to complete their tasks. This opmizaon is expected to contribute to notable improvements in operaon mes and cost savings. Parcularly, this enhancement results in the eliminaon of undesirable contract penalty fees and a notable reducon in material handling costs. Keywords: material handling, opmizaon, pushbelt manufacturingIn compeve markets, companies must deliver superior products or services while maintaining cost-effecve producon [1-2]. Consequently, they must strategically analyse and develop approaches to meet demands at reduced costs. The modern manufacturing facility must adapt quickly to fluctuang product mixes and demand, all the while minimizing expenses associated with material handling and machine relocaon [3].Moreover, an efficient facility layout is fundamental for a plant to operate effecvely, seamlessly, and safely [4]. In this case study of a push belt manufacturer, it is determined that an inefficient facility layout results in unnecessary travel distance. The consequences are increase in product storage costs and contract penalty fees. To solve the issue, several studies have been conducted. Farhad Azadivar & John(Jian) Wang used simulaon and genec algorithms that consider dynamic characteriscs and operaonal constraints of the system as a whole [1]. A C Sembiring applied CORELAP Algorithm to enhance the ulizaon of space for classroom allocaon [5]. Inaki Maulida Hakim and Vidyahningtyas Isyan also uses the CORELAP method to improve producon facility layout for a secondary packaging area of a pharmaceucal company [2]. Li Weng proposed an efficient and flexible algorithm to generate plant layout [6]. Ikhsan Siregar and Khalida Syahputri applied BLOCPLAN Algorithm to improve the producon facility design of a cup manufacture [7]. Kar Yan Tam designed a coding scheme using Genec Algorithm to help solve large scale layout problems [8]. Tarigan also proposed a shop floor layout using process layout and product layout approach in an electronic appliance manu-facturing company [9].99Hong Bang Internaonal University Journal of ScienceISSN: 2615 - 9686 DOI: hps://doi.org/10.59294/HIUJS.VOL.6.2024.635Hong Bang Internaonal University Journal of Science - Vol.6 - 6/2024: 99-106Corresponding author: Le Duc DaoEmail: lddao@hcmut.edu.vn1. INTRODUCTION
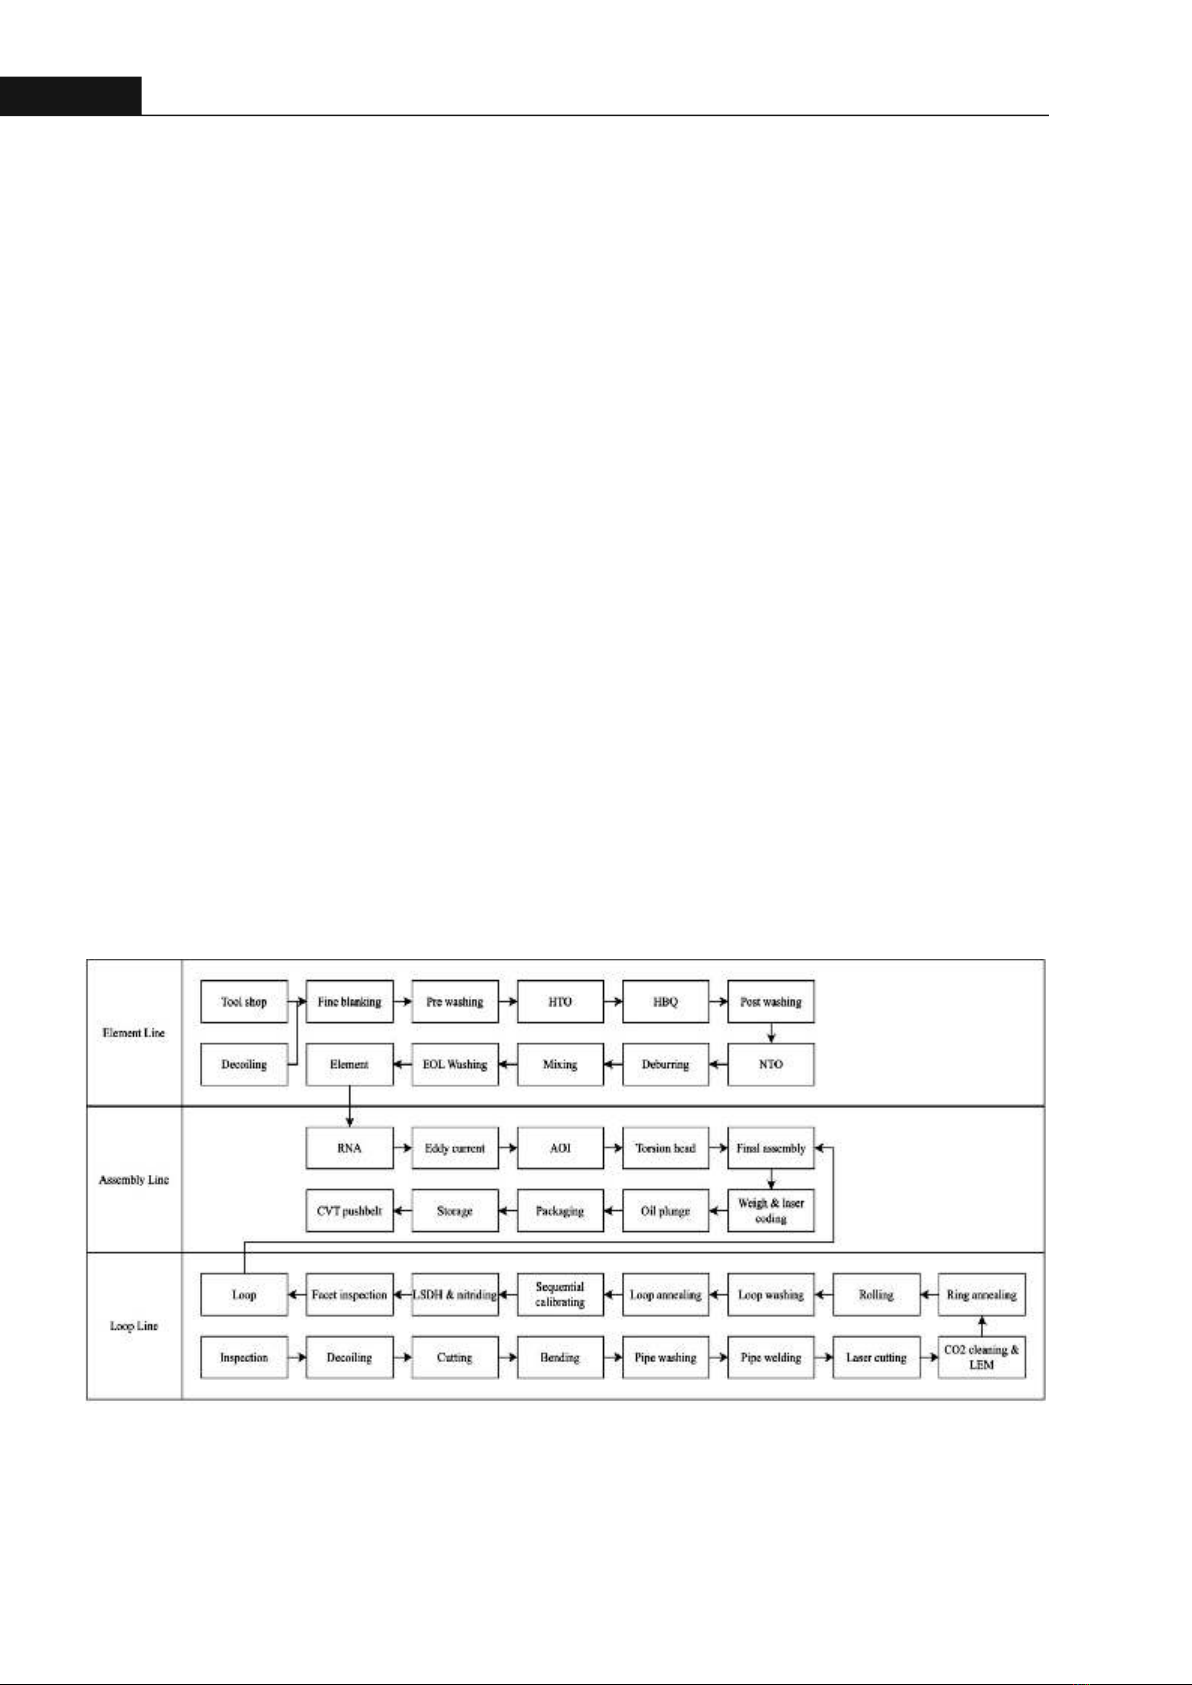
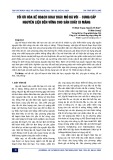
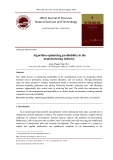
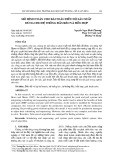
In this paper, a push belt manufacturing plant has experienced an average delay of 20% in its deliveries over a connuous nine-month period, resulng in high storage costs and unwanted contract penalty fees It has been idenfied that the inefficient layout of the shop floor is the root cause of this issue. To address this problem, the CORELAP Algorithm is employed to propose an opmized layout for the manufacturing plant. Secon 2 provides detailed informaon about the push belt manufacturing plant.2. CASE STUDYThis research was conducted at a push belt manufacturing plant located in Long Thanh Industrial Zone, Dong Nai Province, Vietnam. The implementaon was carried out from September 2023 unl the beginning of December 2023. At first, the research idenfies that three major causes leading to late deliveries are long travel distance in the shop floor, take/ give back tools or equipment, and workers waing for materials or components. Then it is concluded that the reason behind those problems is the inefficient facility layout of the shop floor. At the next phase, the research collects data by field study. The field study was carried out on the enre shop floor, which is located inside the plant. Parcularly, the materials flows are collected by examining each funconal area's materials. The material flows are presented in Secon 3.1. Workers' movements from one funconal area to another were observed and recorded in 7 days. The facility layout was obtained from the plant's overall design file. Aer collecng the right data, the relaonship closenesses between each funconal area are grouped using a movements frequency chart which presents the movements between funconal areas. Then, the CORELAP algorithm is applied to propose an opmized facility layout. The detail process is presented in Secon 4.3. Aer that, an analysis of the results has been conducted. It presents the total travel distance of the proposed layout based on CORELAP, the reducon in total travel distance, and the results regarding to costs. The results are presented in Secon 5.3. COLLECTED DATA3.1. Materials flowsThe materials flows are categorized into three main lines: element line, assembly line, and loop line. Work-in-process is produced in the Element Line and Loop Line. The final product, the CVT pushbelt, is composed in the Assembly Line. The processes are presented in Figure 1:3.2. Current layoutAer the inial layout file is obtained, it is essenal to process the data by removing specific machines and equipment presented in the file. To help visualize the layout, a simple layout is designed. The design only shows the locaons, areas, and names as Figure 2:Figure 1. Materials flows100Hong Bang Internaonal University Journal of ScienceISSN: 2615 - 9686Hong Bang Internaonal University Journal of Science - Vol.6 - 6/2024: 99-106
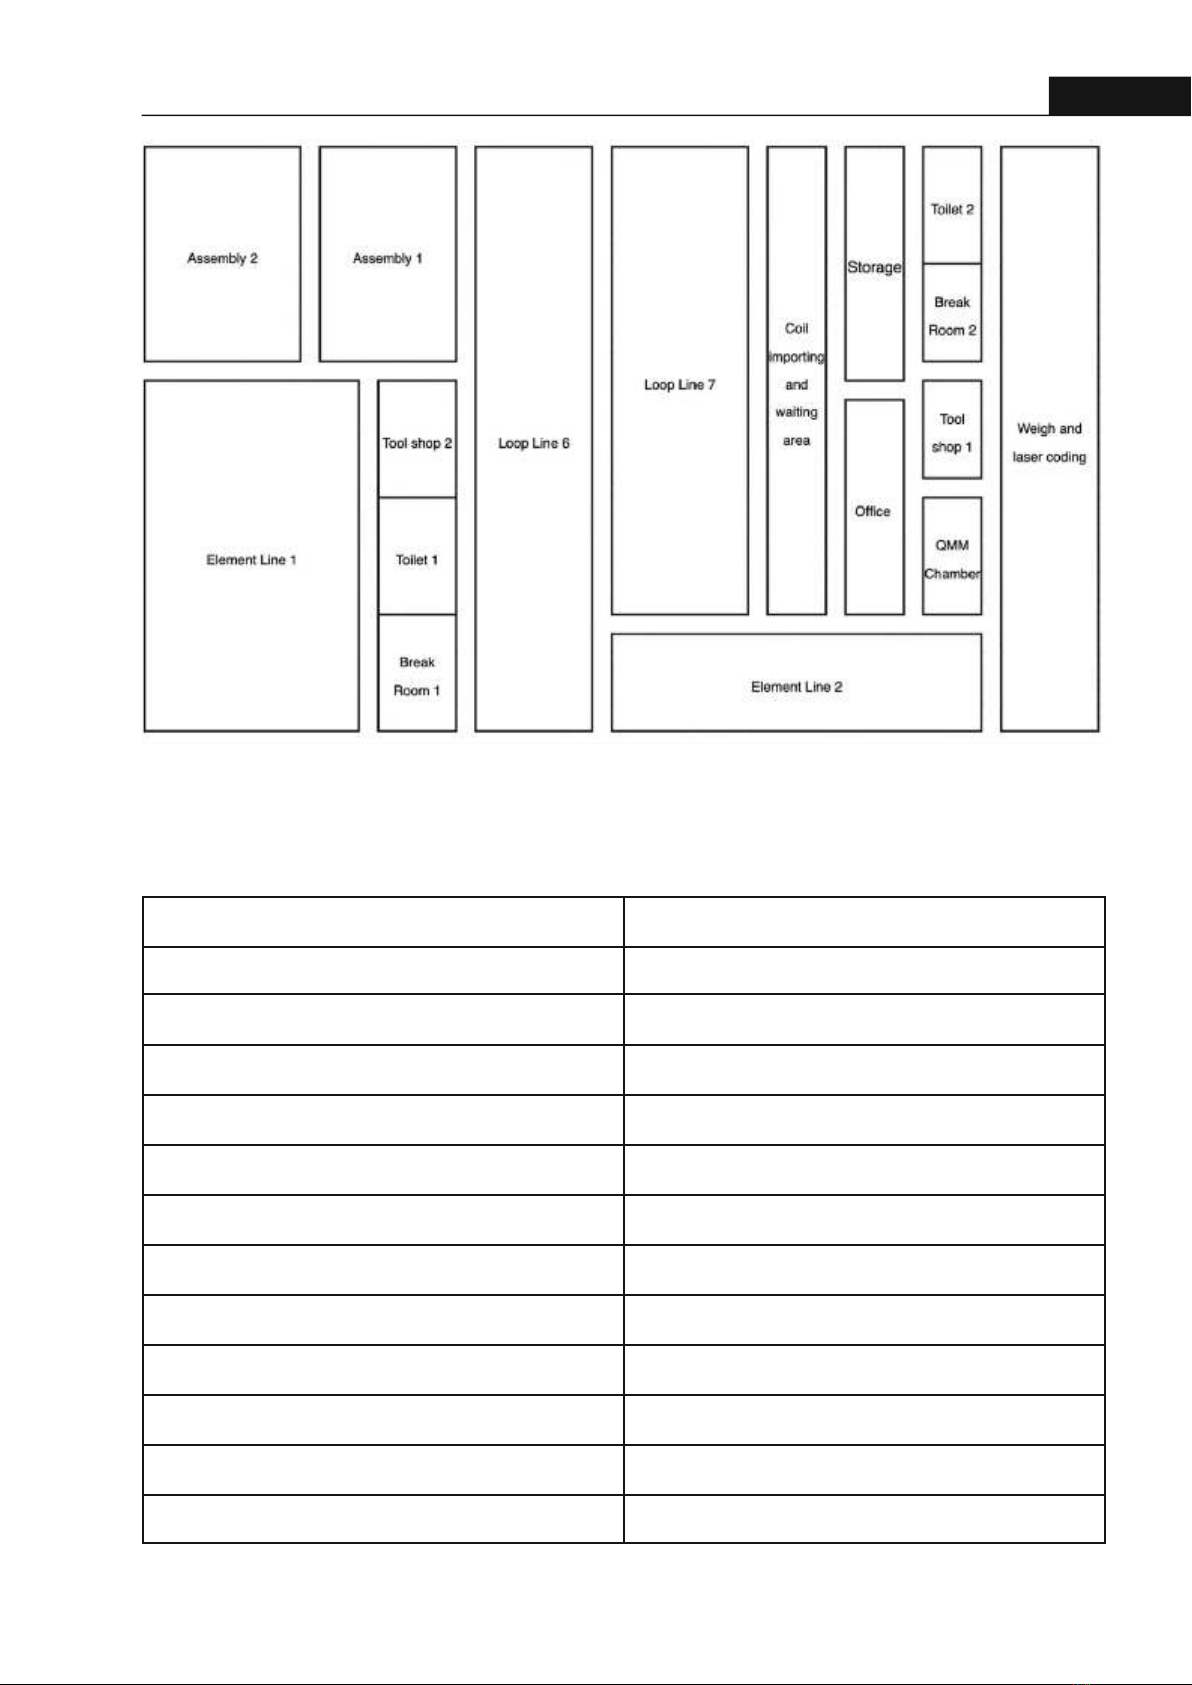
101Hong Bang Internaonal University Journal of ScienceISSN: 2615 - 9686 Hong Bang Internaonal University Journal of Science - Vol.6 - 6/2024: 99-1063.3. Workers' movements recordsIn this study, each funconal area is assigned a symbol so that it is easier to present in tables and illustraons. The symbols are presented in Table 1:Figure 2. Simple design of current layoutTable 1. Symbols used for funconal areasAssembly 1 A Funconal area Symbol Assembly 2 B Element Line 1 C Element line 2 D QMM chamber E Toilet 1 F Toilet 2 G Break room 1 H Break room 2 I Loop line 6 J Loop line 7 K Coil imporng and waing area L
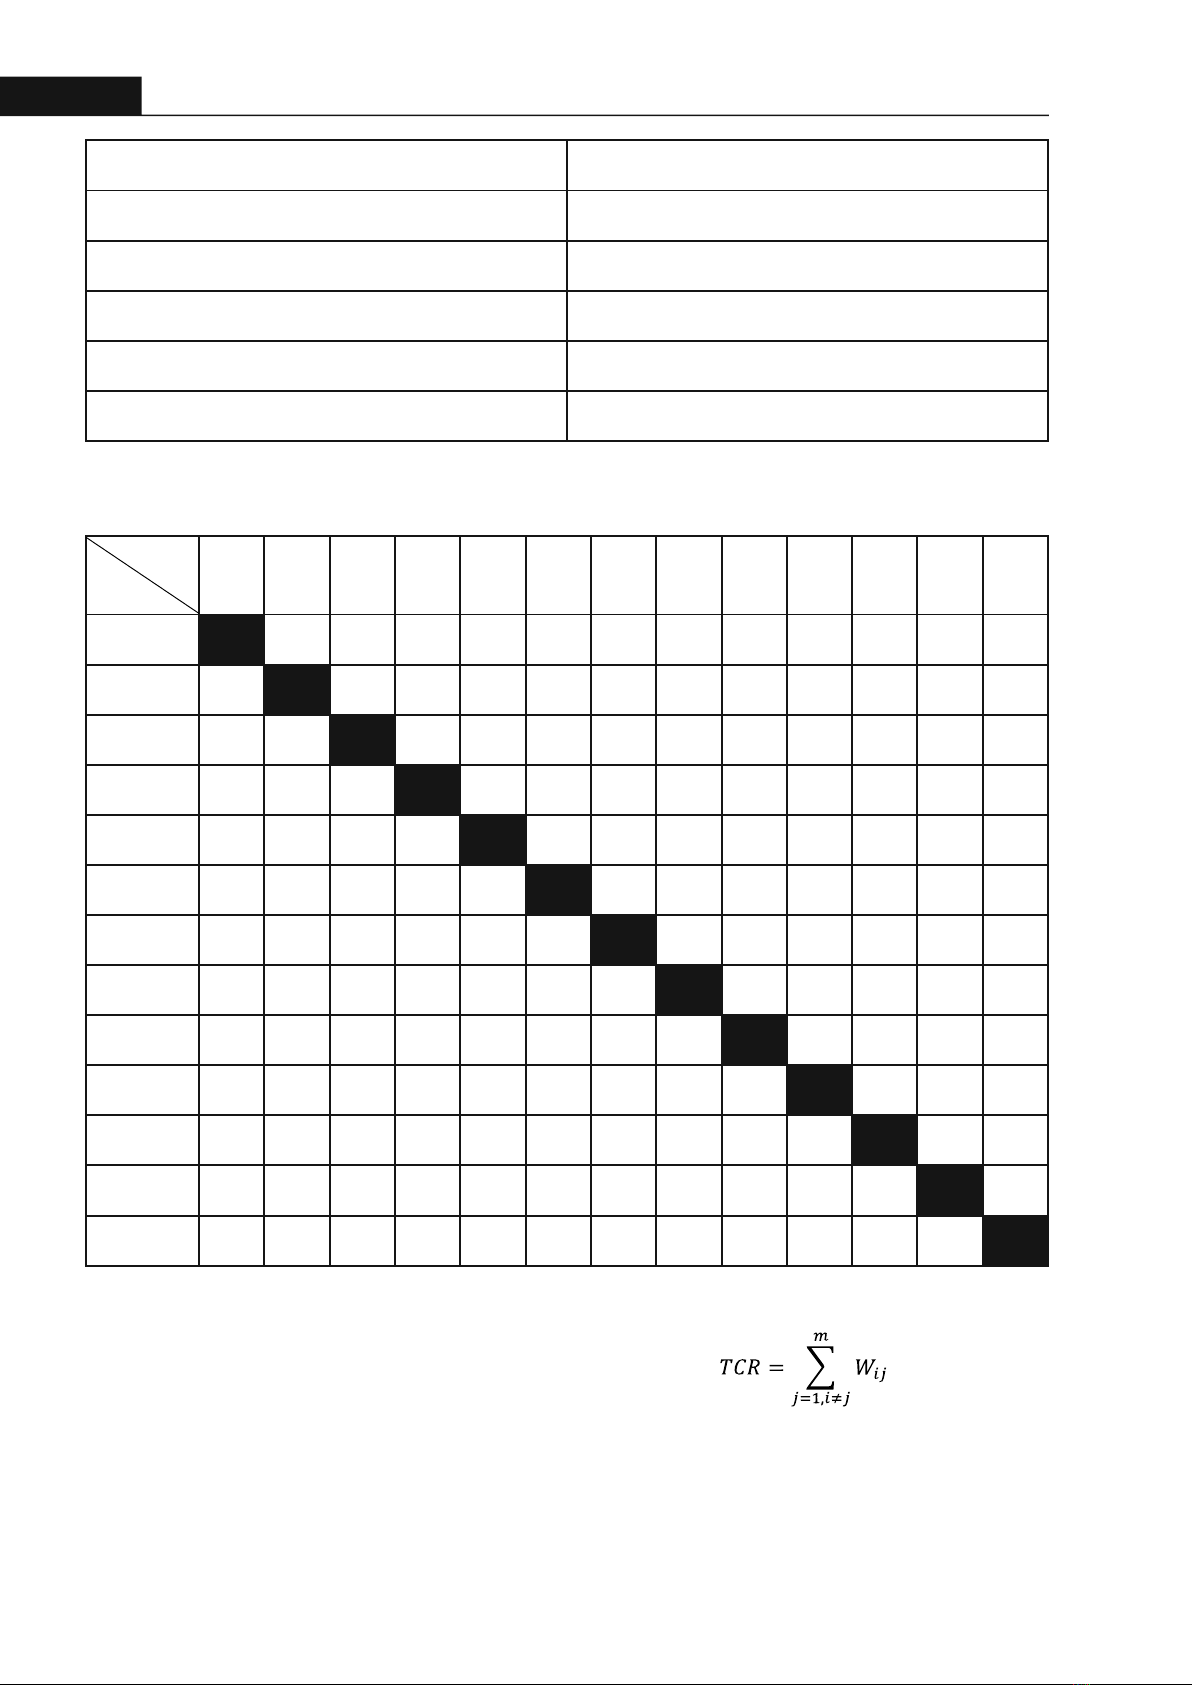
102Hong Bang Internaonal University Journal of ScienceISSN: 2615 - 9686Hong Bang Internaonal University Journal of Science - Vol.6 - 6/2024: 99-1064. Applying CORELAP Algorithm The CORELAP Algorithm uses relaonship rang to define the element placement order. This algorithm can produce a new layout while it doesn't require or depend on an inial layout [8]. The algorithm uses TCR (Total Closeness Rang) to select the placement of the facility elements, where TCR is the sum of the closeness rang of one department to others. The formula can be presented as below:where:m: number of departments W: rang score between departments i and jijThe CORELAP Algorithm contains two main acvies, which are defining the order of Office M Storage N Tool shop 1 O Tool shop 2 P Weigh and laser coding area Q Funconal area Symbol The workers' movements record in 7 days is presented in the movements frequency chart in Table 2.Table 2. Workers' movement records in 7 days To From A B C D E J K L M N O P Q A 22 80 13 15 156 B 24 85 18 21 133 C 128 30 33 D 90 150 32 29 E J 160 132 17 24 22 K 153 15 26 18 L 87 105 21 M 24 22 15 17 14 6 N O P Q
103Hong Bang Internaonal University Journal of ScienceISSN: 2615 - 9686 Hong Bang Internaonal University Journal of Science - Vol.6 - 6/2024: 99-106departments and placing them in the layout. These can be presented in the steps below:- Allocate the department that has the largest TCR. If the same largest TCR is observed within some department, allocate the department having more A, then E, and so on.- Once the department has the X relaonship with the re-arranged department, it will be established in the final step. If there are a lot of X departments, re-arrange it by the decency of TCR.- The next department will be allocated based on the close relaonship with the first one (A, E, I). Using TCR if there is more than one possible outcome. - Make the loop of the process unl all departments are placed in the layout.The detail of how the CORELAP Algorithm is applied is presented in Secons 4.1 and Secon 4.2.4.1. Relaonship closeness groupingIn this stage, the relaonship chart, with rankings A, E, I, O, U, can be constructed by classifying the movement records among the funconal areas. Movement records will be categorized to rankings as in Table 3:4.2. Placing orderTable 5 summarizes the number of rankings, TCR scores, and the placing order based on TCR scores. It presents how many As, Es, Is, Os, Us each funconal area has and the TCR score, where the TCR score can be calculated as:TCR = (number of As × 4) + (number of Es × 3) + (number of Is × 2) + (number of Os × 1) +(number of Us × 0) Ranking Value of movement records A 110 - 160 E 80 - 109 I 40 - 79 O 10 - 39 U 0 - 9 Table 3. Values of the rankingsBased on the movement records among the funconal areas, the relaonship chart, with rankings A, E, I, O, U, can be constructed in Table 4:Table 4. Relaonship closeness rankings A B C D E J K L M N O P Q A U A E O A A U O E O O A B U U A O A U U O E O O A C A U U U U U E O U O O U D E A U U U U E O U O O U E O O U U U U U O U U U U J A A U U U U U O U O O U K A U U U U U U O U O O U L U U E E U U U O U U U U M O O O O O O O O O U U O N E E U U U U U U O U U U O O O O O U O O U U U U U P O O O O U O O U U U U U Q A A U U U U U U O U U U


![Bài giảng Quản lý sản xuất cho kỹ sư: Chương 3 - Đường Võ Hùng [Chuẩn Nhất]](https://cdn.tailieu.vn/images/document/thumbnail/2025/20250812/oursky02/135x160/10441768298495.jpg)


