
Int. J Sup. Chain. Mgt Vol. 8, No. 6, December, 2019
908
Technical Efficiency of Soft Drink
Manufacturing Industry in Malaysia
Ahmad Izzat Mohd Idris1, Mohd Fahmy-Abdullah2*, Lai Wei Sieng3
1, 2 Faculty of Technology Management & Business, Universiti Tun Hussein Onn Malaysia,
3Faculty of Economic and Management, Universiti Kebangsaan Malaysia
*Corresponding author: mohdfahmy@uthm.edu.my
Abstract— The previous studies on technical efficiency
(TE) of the soft drinks industry in Malaysia are still under
consideration from other industries and existing studies
discuss the industry in general. In fact, there is a previous
study using industry-level data and does not consider the
determinants of technical inefficiency determining the TE
level. The purpose of this study is to identify the technical
efficiency level and the technical inefficiency of the soft
drinks manufacturing industry in Malaysia by 2015 using
cross-section data of 118 firms obtained from the
Department of Statistics (DOS). Based on the analysis
method of stochastic analysis (SFA), the results showed
that the level of technical efficiency was high. As a result,
inefficient technical analysis finds that salary rates reduce
inefficiencies and the ratio of capital workers increases
inefficiencies. The basic implication of this study is that soft
drinks manufacturing firms need to increase motivation
among employees and strengthen network market
production through pay increases.
Keywords— Technical Efficiency, Technical Inefficiency,
Firms, Soft Drink, Stochastic Frontier Analysis
1. Introduction
Efficiency Efficiency is effectiveness input users
influenced by production techniques, technological
innovation, management skills and labour skills [1]. The
optimum efficiency can be generated and influenced by
efficient input factors such as the quality of workers.
Based on [2], technical competence is a key element in
economic profits as it measures the firm's ability to
produce the maximum output from a given set of inputs
and it will be reflected in the average operating cost and,
consequently, will directly affect competitive position
of firms.
Soft drinks manufacturing industry is important for
economic growth in Malaysia. The soft drinks industry
covers large and small-scale industries. For the large-
scale industry, the contribution of the soft drinks
industry to support the country's economic growth
contributed 9.7 percent equivalent to the food industry
in the 2012 industrial market. In 2010-2014 Gross
Domestic Product (GDP), the beverage manufacturing
industry contributed 13.9 percent food manufacturing
industry. Besides that, this sub-sector contributes about
10 percent of Malaysia’s manufacturing industry and
6016 SMEs firms are involved in processing and
manufacturing soft drinks and making the second largest
manufacturing sub-sector (DOS, 2011).
However, based on the statistics of the Gross Domestic
Product (GDP) 2016, the soft drinks industry has
steadily declined from 2011 to 2016 [3]. In addition, the
firm's ability to produce efficient beverage production is
unavailable because of inefficient use of inputs and
economic downturns which result in the firms
themselves unable to get enough resources to carry out
beverage production activities [4]. This situation clearly
shows that the level of efficiency of the soft drinks
industry can be deficit or reduced. Studies such as TE
can help to find out the inefficiency problem of
manufacturing industry and then use effective methods
to help improve TE value.
Most of the previous research find that the study on TE
soft drink manufacturing industry is still less attention
compared to other industries. Many studies such as [5],
[6] and [7] only discuss the beverage manufacturing
industry briefly and in small scale and do not conduct
research on this industry as a whole in the research
conducted. In addition, studies conducted do not care
about the efficiency of the industry and further research
on the determinants of technical inefficiencies is also not
considered for efficiency gains such as studies
conducted in neighbouring Indonesia [8].
Furthermore, there were previous studies on the
beverage manufacturing industry in Malaysia such as
[9], [10] and [11] where the studies have used data at the
industry level and do not consider the technical
inefficiencies determining factors to determine the TE
level. [12] emphasized by considering technical
inefficiency factors, firewall-level data play an
important role in obtaining more accurate TE values. In
fact, data at the firms’ level is more effective and more
advantageous to overcome some measurement problems
and can affect aggregate data at industry level [13].
Hence, based on the problems and gaps of this study, an
effort is taken to investigate the extent of the efficiency
______________________________________________________________
International Journal of Supply Chain Management
IJSCM, ISSN: 2050-7399 (Online), 2051-3771 (Print)
Copyright © ExcelingTech Pub, UK (http://excelingtech.co.uk/)
Int. J Sup. Chain. Mgt Vol. 8, No. 6, December, 2019
909
and the determinants of soft drink manufacturing
industry inefficiencies in Malaysia using the latest data
sources. This study is very important and in line with the
national target to develop the soft drink manufacturing
industry as one of the competitive industries not only
locally but also internationally. This study uses data at
the firm’s level in 2015 and employing the SFA
approach. The first analysis determines the level of
technical efficiency, and the second analysis identifies
the determinants of technical inefficiency among the
firms studied. The second section of this article reviews
previous studies. The third section discusses the
research methodology, data sources, and model
specification. The fourth section analyzes the results of
the empirical analysis, and the fifth section provides the
conclusions and the implications of this study.
2. Literature Review
2.1 Concepts and Measurement of Efficiency
The concept of efficiency can be seen when a
department or organization uses all available resources
or inputs optimally to produce maximum output. Output
refers to the output or service produced by an
organization [14]. According to [15] efficiency is a
measure of the ratio between output and input, it can
describe it as the distance between input and output
quantities, and input and output quantities defining
borders, the best boundaries for firms in the cluster
(industry).
Efficiency measurement covers boundary or frontier
efficiency of output use where input combinations are
above the output boundary is efficient. The performance
of productive units is measured based on efficiency of
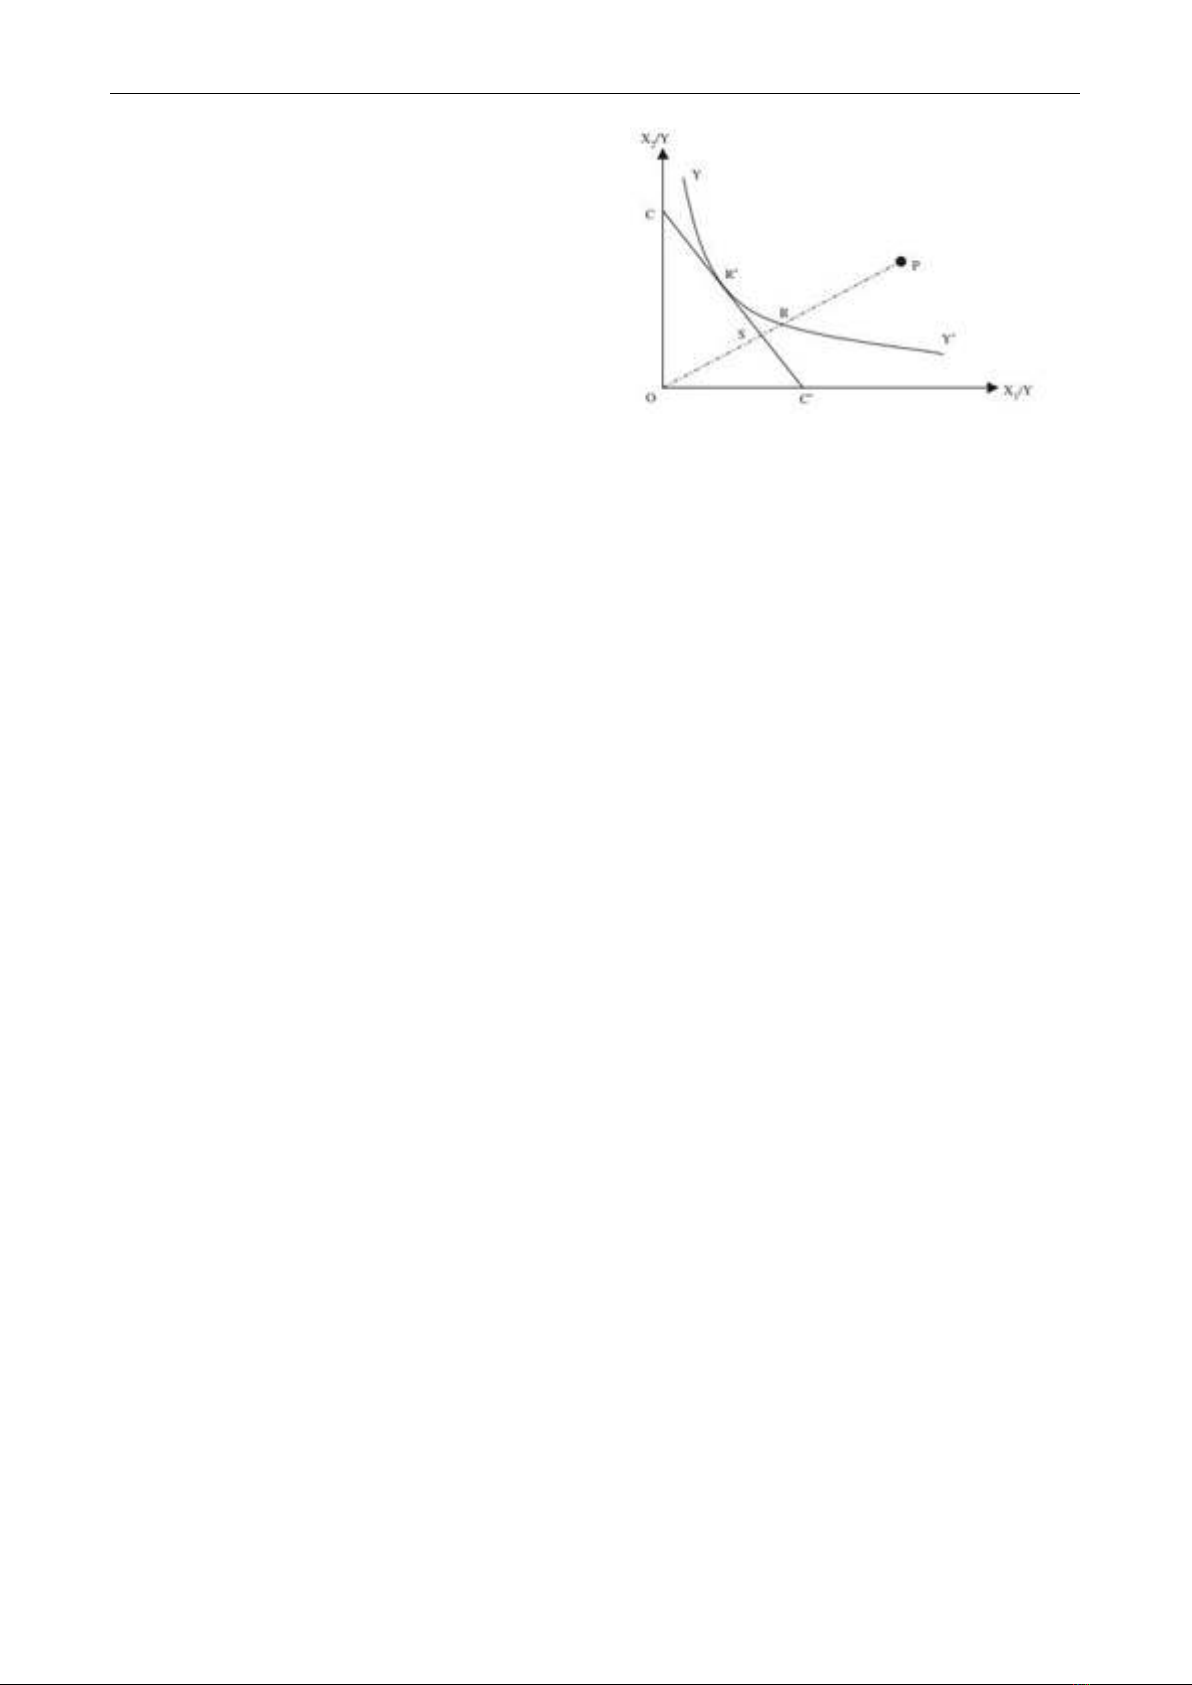
[15]. Measurement of Farell's efficiency with the
assumption of constant return on a scale can be shown
in Figure 2.1. YY 'isoquant line is the production
boundary that reaches the level of efficiency. The form
of an isoquant line represents the minimum set of inputs
per unit of output required to produce a unit of
production. The TE can be generated when the input
combination is located along the isoquant line while the
input combination point is above or at the right of the
isoquant line such as point P cannot reach TE in
production. While OR / OP ratio is TE level and
production allocative efficiency at point P is represented
by OS / OR ratio. The isocost CC 'line shows the
objective function to minimize costs. While overall
efficiency (economic efficiency) is equal to OR / OP x
OS / OR = OS / OP.
2.2. Empirical Studies of Soft Drink
Manufacturing Industry
Based on the previous study, many find out about
technical competence towards the soft drinks industry.
Studies such as [16] are in Greece where they study the
efficacy of beverage production and beverage sales in
Athens. Their TE study shows that the production of
drinking water products has reached a significant
percentage of the revenue from efficient use of inputs
and shows a balanced sales turnover over time. In
addition, [17] also study the comparison of the
efficiency of beverage manufacturing before and after in
terms of innovation and innovation in the production of
beverage products. The comparison has proven to be a
good result of which they place a product that can have
a long-term impact on the production of beverages and
they also propose innovative ideas on the production of
efficient drink products.
For the use of the border approach, this study selected
the use of parametric boundary approaches namely
Stochastic Frontier Analysis (SFA). Studies such as [18]
and [8] use this parametric approach to study the
efficiencies of their respective beverage manufacturing
in Portugal and Indonesia. In addition, the SFA
approach is also used by [19] and [20], respectively in
Nigeria and the Netherlands. Both studies use the SFA
approach only to measure the efficiency of soft drink
manufacturing in general compared to [18] and [8]
which emphasize the study of beverage production in
the country carefully.
In Malaysia, TE research on the soft drink
manufacturing industry is still under consideration.
Studies such as [21] and [22], which mainly lead to the
manufacturing industry as a whole without having to
focus fully on the beverage manufacturing industry in
detail and accuracy. In the meantime, studies such as [6]
study TE for beverage production but its scope focuses
only on small and medium industries.

Int. J Sup. Chain. Mgt Vol. 8, No. 6, December, 2019
910
Finally, only [23] study focuses on the TE of the
beverage manufacturing industry which indicates the
overall TE level is in good condition. There are also
studies such as [24] focusing on the efficiency of
beverage production in the SMI sector through
innovative development in the production of beverage
products. However, both studies do not focus on the
inefficiencies of this industry where this study should
consider the inefficiencies of factors to better measure
the efficiency of the soft drinks industry in Malaysia.
2.3. Empirical Study of Determinant
Factors
The first determinant factor is information and
communication technology (ICT) spending. The use of
high technology information and communications can
increase the production efficiency and manufacturing of
an in-market industry [25]. They also comment that
spending on information technology and ICT can
connect among many manufacturers quickly without
any problems and obstacles and it can indirectly play an
important role in enhancing firm TE. In addition, [26]
further reviews the human relations of each other in the
use of computer technology. He further said that the use
of information technology through the computer is
faster than the use of physical energy to link information
with information when away. This can increase the
efficiency of manufacturing especially in the
manufacture of soft drinks that are more positive and
detailed.
The second determining factor is the training expenses
for the employee. Through training expenses, skills to
labor force increase and promote the production of
better quality goods and services. Training expenses can
also create the use of skilled labor. The use of skilled
labor can increase the efficiency of industrial
manufacturing such as reliable labor in managing stress
in employment, advanced machine control and financial
management [27], [27] also noted that the use of skilled
labor as a result of consistent training expenses can have
a positive impact on the industry's efficiency. [28]
commented that firms providing training to employees
could provide greater knowledge and easy learning and
more innovation. In addition, [29] and [30] states that
firms need to implement programs that focus on quality
work to make jobs more attractive. In the long run, firms
should turn into a professional oriented company with a
steady income outlook, a clear career progression
direction and a good working environment that can
attract young people to the industry. In the short term,
firms should offer employees with long-term contract
work after having sufficient working experience, and
also need to develop a career path to promote employees
to supervisors [31]. The investment in human capital
such as training to employees is a long-term asset that
can provide a positive return over the period of
employee service with the firms [32].
The third determinant factor is based on wage rates. The
wage factor also contributes to the efficiency or
inefficiency of a firm and industry. A balanced wage
rate with training and skills to employees can lead to
positive efficiency in the industry. [33] and [34]
commented that the effect of training participation on
hourly pay rates is quite clear; usually wages are reduced
by 3-7 percent. It is important to note here, though, that
we do not consider the impact of participation on the
overall labor income. The estimated negative impact on
hourly wage rates may, in large part, be offset by higher
attachments to the labor market in terms of
marketability.
The fourth determinant factor is the firm size. The size
of the firm itself determines that the firm is experiencing
positive efficiency or otherwise. According to [35], with
reference to modern mediation theory, larger firms are
more cost-efficient and less likely to fail. This theory
shows that being a bigger proxy is one of the advantages
in reducing the accumulated risk through a large number
of contracting parties, thus reducing the likelihood of
failure. Hence, larger institutions are believed to have
more profitable investment opportunities, higher
efficiencies, greater diversity and lower risk levels. In
addition, [36] showcase a large company with a
conservative attitude which can lead to creative
reduction of researchers and creative entrepreneurs,
thereby reducing research and development (R&D)
efficiency. [37] suggested that larger firms could not
change rapidly to respond to radical innovations as they
often had standard procedures and excessive
bureaucratic controls, and there developed efficient
routines, and their information flow was slower and
more complex [38].
The fifth determinant factor is about R&D. Through
research and development spending, skills to the labor
force are increasing and promoting the production of
better quality goods and services. Labor force with
expertise in innovation in product production can
increase the firm's TE level. [39] suggests that firms can
invest in R&D on product development as a long-term
asset that can give positive returns to firms. Continuous
research on the production of a product can stabilize and
improve the efficiency of firms in the industry [40], [41]
and [42] studies show that firms that promote
development in product production can produce high
quality and satisfy customers with the adequacy of the
desired product specifications. R & D spending is

Int. J Sup. Chain. Mgt Vol. 8, No. 6, December, 2019
911
indeed an effective measure to help provide positive
efficiency in the manufacturing industry.
The sixth determinant factor is the capital-labor ratio.
Through capital-labor ratio analysis, the amount of
capital utilization per employee can be identified in the
production process. The labor capital ratio is associated
with high technology utilization whereby the higher the
utilization ratio can improve product production
efficiency [43]. [44] explains that capital-labor ratios
need to be given priority in economic development
where capital and labor capital utilization factors are
crucial in finding good competitiveness in production
and thus boosting the economic status of a country to a
better. In addition, the difference between developed
and developing countries comes from the ratio of labor-
capital [45]. [46] discussed the increasing use of
machines in the production process as a result of high
capital utilization can have a positive impact on
efficiency and increase production levels. Meanwhile,
studies such as [43] proves that the capital-labor ratio
can reduce the inefficiency of the technique thus
increasing the efficiency of the firm. However, [47] and
[30] found that labor-ratio factors have no significant
relationship with the firm's technical competence. Total
excess capacity in capital utilization has resulted in an
increase in technical inefficiency and a decrease in
efficiency in industry [48].
The seventh determinant factor is education level.
Educational status is an important factor in determining
a firm TE. Firms with many educated employees are
better at maintaining and controlling existing
technology and adopting modern or new technologies
[49]. [50] notes that education is a very important factor
in technology level to improve the efficiency of a firm.
In fact, workers with high levels of education and skills
gain high wages that can contribute to development,
research and development and thus increase production
efficiency [51].
3. Methodology
3.1 SFA Approach
The boundary approach used is Stochastic Frontier
Analysis (SFA). SFA is a parametric method to estimate
the firm's technical competency score or sector level by
exploiting the tendency of error in production function
specifications ([52]; [53]) This model was also proposed
by [54] to obtain firm TE value. [54] proposed a model
for technical inefficiencies in stochastic boundary
production functions for panel data. Provided that the
effect of inefficiency is stochastic, this model allows
estimates of both technical changes in different
stochastic boundaries and technical instability [55]. This
SFA model is used to obtain strong TE value. Efficiency
at firm level can be measured by estimating SFA
production boundary model affected by sample
achievement or best firm to demonstrate that technology
changes are being used in the industry.
The stochastic boundary production model based on the
Translog function is written as follows;
ui = δ0 + δ1ln(W/L)i + δ2ln(TRE)i + δ3ln(ICT)i +
δ4ln(RND)i + δ5ln(SD/L)i + δ6ln(TR/L)i +
δ7ln(C/L)i+δ8(DFSME)i (2)
Where ui is technical inefficiency, W/Li represents the
total wage rate for i-th firm, TREi represents the amount
of employee training expenses for the i-th firm, ICTi is
the communication cost for the i-th firm, RNDi is the
research & development cost for the i-th firm, SD/Li
represents the ratio of employees trained at diploma
level and STPM or equivalent for the i-th firm, TR/Li
represents the ratio of employees trained at higher level
including advanced degree or equivalent for the i-th
firm, C/Li is the total capital ratio divided by the number
of employees for the i-th firm, and DFSME is the
dummy for the i-th firm with small firms size represent
1 and others are considered 0.
3.2 Sources of Data
This study uses data on the level of beverage
manufacturing industry obtained from IMS DOS. The
firm's choice is provided by DOS based on the research
needs and objectives of a dependent and independent
variable. Selected data is randomized through ranking
simulations including identifying larger firms, medium
and small, total output, number of employees and capital
used. Although the amount of data is only 30 percent,
the results are efficient. Based on the original data
provided by DOS, information filtering must be done
because some less-needed firms such as capital and
output value are unclear. The objective of the research
is to measure the value of TE based on the data at the
firm level using the computer software called
FRONTIER 4.1.
3.3 Data Analysis
This study uses computer software programs namely
FRONTIER 4.1 and Microsoft Office Excel 2016 to
analyse data. The FRONTIER 4.1 software uses the
Fortran77 programming language which is a software
used specifically to estimate the production of stochastic
boundaries. This program is used to calculate TE value
estimates for firms obtained from the Translog
approach. Microsoft Office Excel 2016 is used to help

Int. J Sup. Chain. Mgt Vol. 8, No. 6, December, 2019
912
in analysing and calculating data to align with the format
used in FRONTIER 4.1.
4. Results and Discussion
4.1 Descriptive Statistics
This study was conducted on 118 soft drink
manufacturing firms in Malaysia in 2015. Table 1
displays descriptive statistics of the variables used for
SFA estimation. The table exhibits the overall average
amount of output produced the soft drink manufacturing
firms which was RM70 million with a minimum of RM2
million to a maximum of RM1 billion. Intermediate
input value is a major expense for soft drink
manufacturing firms with the average spending of
RM51 million between RM736,000 to RM1 billion. The
second higher expense is capital which average at RM20
million between RM15,000 to RM382 million. In
addition, the average number of employees employed
was 96 people ranging from 4 to 1129 people. The study
also found that the ratio between capital and labour in
the soft drink manufacturing firms ranged from RM877
to RM2 million with an average of RM181,000.
Furthermore, the soft drink manufacturing firms had
spent an average of RM51,000, with expenditures
ranging from RM0 to RM1 million, for the cost of
employee training. Besides, the average ratio of
employees with the highest qualification, including
advanced degree or equivalent, was 0.073 ranging from
0.000 to 0.500. As for the ratio of employees having a
diploma and Malaysian Higher School Certificate or
equivalent, it shows an average range of 0.138, ranging
from 0.000 to 0.670. Furthermore, the firms’ employees
average R&D in the year was RM289,000 ranging
between RM0 to RM8 million. The average of wages in
that year was RM28,000 ranging from RM12,000 to
RM104,000. The firm had also spent an average of
RM60,000 for ICT with minimum spending of RM50
and maximum Spending of RM1 million. Meanwhile,
SME dummy showed that 90 percent of the firms
involved in this study were small-sized and medium-
sized firms. Standard deviation showed that the variance
fell over the entire sample. The result also showed that
there was too much dispersion in the soft drink
manufacturing firms.
Table 1: Descriptive statistics of the variables
Variable
Mean
Minimum
Maximum
Standard Deviation
Y
(RM)
70320.78
2412.97
1525982.51
200803.983
K
(RM)
20470.89
15.48
382874.47
53393.833
L
Number
96.37
4
1129
147.441
II
(RM)
51859.94
736.69
1062940.1
150908.4636
K/L
Ratio
181.133
0.877
2691.497
365.809
TIER
Ratio
0.073
0.000
0.500
0.077
SED
Ratio
0.138
0.000
0.670
0.108
TRE
(RM)
51.25
0
1827.76
213.028
R&D
(RM)
289.38
0
8644.06
1142.280
W
(RM)
28.68
12.22
104.35
14.863
ICT
(RM)
60.65
0.05
1392.61
162.280
DFSME
Number
0.914
0
1
0.281
Notes: Y = output; K = capital; L = labour; K/L = ratio of capital labour; II = intermediate input value; TRE = employee
training expenses; SED = ratio of employees trained at diploma level and Malaysian Higher School Certificate or
equivalent; TIER = ratio of employees trained at a higher level including advanced degree or equivalent; W = wage rate;
ICT = communication cost; R&D = research & development cost; DFSME = dummy for small medium firms size
4.2 Technical Efficiency Analysis
Table 2 displays the frequency and the index distribution
of technical efficiency in the soft drink manufacturing
firms in Malaysia in 2015. This finding describes the
contribution of technical efficiency of a firm in soft
drink manufacturing industry. The soft drink
manufacturing industry consists of 118 firms.
If scrutinized closely, the frequency and index
distribution of technical efficiency between 0.91 and
1.00 were the highest range of the overall industry, i.e.
61.02 percent, followed by index distribution of
technical efficiency between 0.81 and 0.90 which was
32.20 percent. These results were driven by higher
demand due to the rapid economic growth of between
0.8 percent to 6 percent per annum and increase in
purchasing power. Thus, firms have increased the level


%20--%3e%3cdefs%3e%3cstyle%3e%20.st0%20{%20fill:%20%23fff;%20}%20.st1%20{%20fill:%20%237800fa;%20}%20%3c/style%3e%3c/defs%3e%3cpath%20class='st1'%20d='M117.78,12.18H43.11c2.9,3.47,4.65,7.94,4.65,12.82,0,5.6-2.3,10.66-6.01,14.29h76.02l7.22-13.56-7.22-13.56Z'/%3e%3cg%3e%3cpath%20class='st0'%20d='M53.58,26.17h-.59v-1.46h.59v-4.96h2.83c1.78,0,2.67.94,2.67,2.82v5.76c0,1.87-.89,2.81-2.67,2.81h-2.83v-4.96ZM55.36,21.37v3.34h1.1v1.46h-1.1v3.34h1.01c.61,0,.91-.37.91-1.1v-5.93c0-.74-.3-1.1-.91-1.1h-1.01Z'/%3e%3cpath%20class='st0'%20d='M65.99,31.14h-1.8l-.31-2.07h-2.19l-.31,2.07h-1.64l1.82-11.39h2.62l1.82,11.39ZM65.28,18.04c-.25.46-.51.77-.75.94-.21.15-.47.22-.79.22-.26,0-.57-.07-.92-.22l-.38-.15c-.14-.05-.26-.07-.37-.07-.3,0-.53.18-.71.54l-.91-.68c.25-.46.51-.77.75-.94.21-.14.48-.21.79-.21.26,0,.57.07.92.21l.38.15c.14.05.26.07.37.07.3,0,.53-.18.71-.54l.91.68ZM61.91,27.52h1.73l-.87-5.76-.87,5.76Z'/%3e%3cpath%20class='st0'%20d='M74.53,26.89v1.52c0,1.91-.89,2.86-2.67,2.86s-2.67-.95-2.67-2.86v-5.93c0-1.91.89-2.86,2.67-2.86s2.67.95,2.67,2.86v1.11h-1.69v-1.22c0-.75-.31-1.12-.93-1.12s-.93.37-.93,1.12v6.15c0,.74.31,1.11.93,1.11s.93-.37.93-1.11v-1.63h1.69Z'/%3e%3cpath%20class='st0'%20d='M81.4,31.14h-1.8l-.31-2.07h-2.19l-.31,2.07h-1.64l1.82-11.39h2.62l1.82,11.39ZM75.9,19.2l1.52-1.91h1.71l1.51,1.91h-1.61l-.76-.95-.75.95h-1.61ZM77.32,27.52h1.73l-.87-5.76-.87,5.76ZM83.1,15.99l-1.76,1.91h-1.26l1.17-1.91h1.86Z'/%3e%3cpath%20class='st0'%20d='M84.86,19.75c1.78,0,2.67.94,2.67,2.82v1.48c0,1.87-.89,2.81-2.67,2.81h-.85v4.28h-1.79v-11.39h2.64ZM84.01,21.37v3.86h.85c.58,0,.87-.36.87-1.08v-1.71c0-.71-.29-1.07-.87-1.07h-.85Z'/%3e%3cpath%20class='st0'%20d='M93.51,19.75c1.78,0,2.67.94,2.67,2.82v1.48c0,1.87-.89,2.81-2.67,2.81h-.85v4.28h-1.79v-11.39h2.64ZM92.66,21.37v3.86h.85c.58,0,.87-.36.87-1.08v-1.71c0-.71-.29-1.07-.87-1.07h-.85Z'/%3e%3cpath%20class='st0'%20d='M98.8,31.14h-1.79v-11.39h1.79v4.88h2.03v-4.88h1.83v11.39h-1.83v-4.88h-2.03v4.88Z'/%3e%3cpath%20class='st0'%20d='M105.36,24.55h2.46v1.62h-2.46v3.34h3.09v1.63h-4.88v-11.39h4.88v1.63h-3.09v3.18ZM108.17,17.29l-1.76,1.91h-1.26l1.17-1.91h1.86Z'/%3e%3cpath%20class='st0'%20d='M112.2,19.75c1.78,0,2.67.94,2.67,2.82v1.48c0,1.87-.89,2.81-2.67,2.81h-.85v4.28h-1.79v-11.39h2.64ZM111.35,21.37v3.86h.85c.58,0,.87-.36.87-1.08v-1.71c0-.71-.29-1.07-.87-1.07h-.85Z'/%3e%3c/g%3e%3ccircle%20class='st1'%20cx='25'%20cy='25'%20r='20'/%3e%3cpath%20class='st0'%20d='M32.78,19.27c2.92,0,4.43,2.55,5.28,5.33l.71,2.17c.14.38-.33.75-.71.75h-5.61c.19-.33.24-.71.09-1.08l-.75-2.45c-.43-1.32-.99-2.64-1.79-3.77.75-.57,1.65-.94,2.78-.94h0ZM25,18.38c3.25,0,4.9,2.78,5.89,5.89l.76,2.45c.14.42-.33.8-.8.8h-11.69c-.42,0-.94-.38-.8-.8l.75-2.45c.99-3.11,2.64-5.89,5.89-5.89h0ZM25,11.35c1.74,0,3.11,1.37,3.11,3.11s-1.37,3.11-3.11,3.11-3.11-1.41-3.11-3.11,1.41-3.11,3.11-3.11h0ZM17.27,19.27c1.08,0,1.98.38,2.73.94-.8,1.13-1.37,2.45-1.74,3.77l-.8,2.45c-.14.38-.05.75.09,1.08h-5.56c-.42,0-.9-.38-.75-.75l.71-2.17c.9-2.78,2.41-5.33,5.33-5.33h0ZM17.27,12.91c1.51,0,2.78,1.27,2.78,2.83s-1.27,2.83-2.78,2.83-2.83-1.27-2.83-2.83,1.27-2.83,2.83-2.83h0ZM32.78,12.91c1.56,0,2.78,1.27,2.78,2.83s-1.23,2.83-2.78,2.83-2.83-1.27-2.83-2.83,1.27-2.83,2.83-2.83h0ZM27.07,28.56v.09c0,.57-.24,1.08-.61,1.46h0v.05c-.38.33-.9.57-1.46.57s-1.08-.24-1.46-.61h0c-.38-.38-.61-.9-.61-1.46v-.09h1.41v.09c0,.19.05.38.19.47v.05c.09.09.28.19.47.19s.38-.09.47-.19v-.05c.14-.09.24-.28.24-.47t-.05-.09h1.41ZM30.99,28.56v.09c0,1.65-.66,3.16-1.74,4.24-1.08,1.08-2.59,1.79-4.24,1.79s-3.16-.71-4.24-1.79l-.05-.05c-1.04-1.08-1.7-2.55-1.7-4.2v-.09h1.41v.09c0,1.27.47,2.4,1.27,3.25h.05c.85.85,1.98,1.37,3.25,1.37s2.4-.52,3.25-1.37c.85-.8,1.37-1.98,1.37-3.25v-.09h1.37ZM34.99,28.56v.09c0,2.78-1.13,5.28-2.92,7.07-1.79,1.79-4.29,2.92-7.07,2.92s-5.23-1.13-7.07-2.92c-1.79-1.79-2.92-4.29-2.92-7.07v-.09h1.41v.09c0,2.4.94,4.53,2.5,6.08,1.56,1.56,3.72,2.5,6.08,2.5s4.52-.94,6.08-2.5c1.56-1.56,2.5-3.68,2.5-6.08v-.09h1.41Z'/%3e%3c/svg%3e)