
Open Access
Available online http://arthritis-research.com/content/11/1/R2
Page 1 of 9
(page number not for citation purposes)
Vol 11 No 1
Research article
MRI bone oedema scores are higher in the arthritis mutilans form
of psoriatic arthritis and correlate with high radiographic scores
for joint damage
Yu M Tan1,2, Mikkel Østergaard3, Anthony Doyle4, Nicola Dalbeth2, Maria Lobo2, Quentin Reeves4,
Elizabeth Robinson5, William J Taylor6, Peter B Jones1,7, Karen Pui2, Jamie Lee1,2 and
Fiona M McQueen1,2
1Department of Molecular Medicine and Pathology, University of Auckland, Park Road, Auckland 1010, New Zealand
2Department of Rheumatology, Auckland District Health Board, Greenlane West, Auckland 1051, New Zealand
3Department of Rheumatology, Copenhagen University Hospitals at Hvidovre and Gentofte, Kettegård alle 30, Hvidovre, DK-2650, Denmark
4Department of Radiology, Auckland City Hospital, Grafton Rd, Auckland 1010, New Zealand
5Department of Epidemiology and Biostatistics, University of Auckland, Morrin Road, Auckland 92019, New Zealand
6Department of Medicine, University of Otago Wellington, Mein St, Wellington 6021, New Zealand
7Department of Rheumatology, QE Health, Whakaue St, Rotorua 3010, New Zealand
Corresponding author: Fiona M McQueen, f.mcqueen@auckland.ac.nz
Received: 22 Sep 2008 Revisions requested: 23 Oct 2008 Revisions received: 4 Dec 2008 Accepted: 6 Jan 2009 Published: 6 Jan 2009
Arthritis Research & Therapy 2009, 11:R2 (doi:10.1186/ar2586)
This article is online at: http://arthritis-research.com/content/11/1/R2
© 2009 Tan et al.; licensee BioMed Central Ltd.
This is an open access article distributed under the terms of the Creative Commons Attribution License (http://creativecommons.org/licenses/by/2.0),
which permits unrestricted use, distribution, and reproduction in any medium, provided the original work is properly cited.
Abstract
Introduction The aim of this study was to investigate the
magnetic resonance imaging (MRI) features of bone disease in
the arthritis mutilans (AM) form of psoriatic arthritis (PsA).
Methods Twenty-eight patients with erosive PsA were enrolled
(median disease duration of 14 years). Using x-rays of both
hands and feet, 11 patients were classified as AM and 17 as
non-AM (erosive psoriatic arthritis without bone lysis)by two
observers. MRI scans (1.5T) of the dominant hand (wrist and
fingers scanned separately) were obtained using standard
contrast-enhanced T1-weighted and fat-saturated T2-weighted
sequences. Scans were scored separately by two readers for
bone erosion, oedema and proliferation using a PsA MRI scoring
system. X-rays were scored for erosions and joint space
narrowing.
Results On MRI, 1013 bones were scored by both readers.
Reliability for scoring erosions and bone oedema was high
(intraclass correlation coefficients = 0.80 and 0.77 respectively)
but only fair for bone proliferation (intraclass correlation
coefficient = 0.42). MRI erosion scores were higher in AM
patients (53.0 versus 15.0, p = 0.004) as were bone oedema
and proliferation scores (14.7 versus 10.0, p = 0.056 and 3.6
versus 0.7, p = 0.003 respectively). MRI bone oedema scores
correlated with MRI erosion scores and X-ray erosion and joint
space narrowing scores (r = 0.65, p = 0.0002 for all) but not the
disease activity score 28-C reactive protein (DAS28CRP) or pain
scores.
Conclusions In this patient group with PsA, MRI bone oedema,
erosion and proliferation were all more severe in the AM-form.
Bone oedema scores did not correlate with disease activity
measures but were closely associated with X-ray joint damage
scores. These results suggest that MRI bone oedema may be a
pre-erosive feature and that bone damage may not be coupled
with joint inflammation in PsA.
AM: arthritis mutilans; CI: confidence interval; CRP: C-reactive protein; DAS: disease activity score; DEXA: dual energy XRay absorptiometry; DIP:
distal interphalangeal; ESR: erythrocyte sedimentation rate; Gd-DTPA: gadolinium diethylenetriamine pentaacetic acid; HAQ: Health Assessment
Questionnaire; MCP: metacarpophalangeal; MRI: magnetic resonance imaging; non-AM: erosive psoriatic arthritis without bone lysis; OMERACT:
Outcome Measures in Rheumatology Clinical Trials; PAMRIS: Psoriatic arthritis MRI scoring system; PASI: Psoriasis Area and Severity Index; PF-SF-
36: Physical Function component of the Short form-36; PIP: proximal interphalangeal; PNSS: Psoriasis Nail Severity Score; PsA: psoriatic arthritis;
RA: rheumatoid arthritis; RAMRIS: Rheumatoid Arthritis Magnetic Resonance Imaging Scoring system; PsAMRIS: Psoriatic Arthritis Magnetic Reso-
nance Imaging Scoring system; SpA: spondyloarthropathies; STIR: short tau inversion recovery; TNF: tumour necrosis factor; 3D VIBE: three-dimen-
sional volumetric interpolated breath-hold examination; XR: plain radiography.

Arthritis Research & Therapy Vol 11 No 1 Tan et al.
Page 2 of 9
(page number not for citation purposes)
Introduction
Arthritis mutilans (AM) is the most severe and destructive of
the five clinical presentations of psoriatic arthritis (PsA) as
defined by Moll and Wright [1]. It is characterised by severe
radiographic erosion with bony osteolysis, often resulting in
digital shortening and the 'main en lorgnette' (opera-glass
hand) deformity [2]. Bone proliferation and arthrodesis may
coexist with erosion in PsA and both forms of bone disease
have been described in AM [3]. Magnetic resonance imaging
(MRI) can reveal more information about bone pathology in
inflammatory arthritis than conventional radiography (XR) as it
is a multiplanar technique with the capacity to depict bone ero-
sion and proliferation using three-dimensional imaging. MRI is
the only imaging modality capable of revealing bone oedema,
which in rheumatoid arthritis (RA) has been shown to be a pre-
erosive change and associated with osteitis [4-6]. MRI bone
oedema has also been described in PsA [7-10] where it may
be diaphyseal as well as subchondral [8] and is responsive to
anti-tumour necrosis factor (TNF) therapy [10]. In this study we
investigated the characteristics of bone disease in erosive PsA
using XR, contrast-enhanced MRI scanning and dual energy
X-Ray absorptiometry (DEXA). We sought to determine
whether the AM form differs from non-AM (erosive psoriatic
arthritis without bone lysis) PsA using these modalities, specif-
ically concentrating on MRI bone oedema in view of its poten-
tial role in the genesis of bone erosion.
Materials and methods
Patients and clinical assessments
With the approval of the New Zealand Multiregion Ethics
Committee, 28 patients with PsA (as defined by Vasey and
Espinzoa modified by Taylor and colleagues [11]) were
recruited from Auckland, Rotorua and Wellington in New Zea-
land from 2005 to 2007. These patients were enrolled as part
of a longitudinal study investigating the effects of zoledronic
acid on the progression of bone erosions in PsA (the
zoledronic acid in psoriatic arthritis or ZAPA study), but results
presented here pertain only to baseline findings in these
patients, before administration of the study drug or placebo.
All patients gave informed consent according to the require-
ments of the New Zealand Multiregion Ethics Committee.
Enrolment criteria included the presence of peripheral ero-
sions on XR confirmed by a radiologist. A total of 17 males and
11 females were enrolled and all underwent clinical assess-
ments including collection of demographic data, as well as dis-
ease activity scores (DAS) obtained from history, examination
and laboratory investigations including duration of early morn-
ing stiffness, swollen (n = 76) and tender (n = 78) joint counts,
visual analogue scores for pain and overall well-being, patient
and physician global assessments, erythrocyte sedimentation
rate (ESR) and C-reactive protein (CRP). DAS-28CRP (four var-
iable) and DAS-28ESR (four variable) scores were computed to
indicate overall disease activity [12]. Assessments of func-
tional disability were also obtained using the Health Assess-
ment Questionnaire (HAQ) score [13], which has been used
to assess functional limitations in PsA [14] and the Physical
Function component of the Short form-36 (PF-SF-36) score
[15]. Severity of psoriasis was assessed using the Psoriasis
Area and Severity Index (PASI) [16] and the Psoriasis Nail
Severity Score (PNSS) [17] was also used.
Radiography
Plain XRs of the hands, feet and sacroiliac joints were
obtained at enrolment. XRs were scored by a radiologist and
a rheumatologist (QR and ND) for erosions and joint space
narrowing according to the Sharp van der Heijde score modi-
fied for use in PsA [18]. Sacroiliitis was scored as present or
absent by another clinical radiologist.
Radiographic definition of arthritis mutilans
Patients were categorised as having AM or non-AM PsA on
the basis of XR features in the peripheral joints, using the def-
inition from Marsal and colleagues [19], which requires com-
plete erosion of bone on both sides of the joint(s). This was
performed by two readers (WT and QR) who reviewed digi-
tised films separately and, where there was disagreement by
consensus, blinded to clinical and MRI findings.
Clinical definition of arthritis mutilans
Clinical digitised photographs of the hands and feet were
obtained in 25 of the 28 patients. These were examined by a
rheumatologist (ND) blinded to the results of radiography and
MRI. Patients were classified as AM or non-AM according to
the presence of digital shortening in the fingers or toes.
Patients were also classified separately by their referring phy-
sicians as AM or non-AM.
MRI scans
MRI scans of the wrist (distal radius and ulna, carpal bones
and metacarpal bases 2 to 5) and fingers (metacarpals proxi-
mal to bases, metacarpophalangeal (MCP) joints, proximal
phalanges, proximal interphalangeal (PIP) joints, middle
phalanges, distal interphalangeal (DIP) joints, distal
phalanges) of the dominant hand were obtained using a Sie-
mens Magnetom Avanto 1.5 Tesla (T) scanner (Siemens, Pen-
rose, Auckland New Zealand) with a dedicated wrist coil
(small field of view at 11 cm for optimal signal-to-noise ratio).
Details of sequences and acquisitions are shown in Table 1.
The sequence of imaging was as follows: unenhanced imag-
ing of the fingers; the patient was repositioned so that the
wrist was within the coil; unenhanced imaging of the wrist;
contrast injection; enhanced imaging of the wrist; the patient
was repositioned so that the fingers were within the coil; and
then enhanced imaging of the fingers was performed. Bone
oedema was investigated using short tau inversion recovery
(STIR) sequences, whereas bone erosion and bone prolifera-
tion were assessed on axial and coronal T1-weighted
sequences. For all parameters a water-excitation volumetric
interpolated breath-hold examination (3D VIBE) sequence (a

Available online http://arthritis-research.com/content/11/1/R2
Page 3 of 9
(page number not for citation purposes)
gradient echo 3D T1-weighted sequence) was used as a sup-
plement. This sequence was obtained after intravenous admin-
istration of the contrast agent, gadolinium diethylenetriamine
pentaacetic acid (Gd-DTPA).
Scans were scored separately by two trained readers (MØ
and AD) for bone erosion and bone oedema using Rheuma-
toid Arthritis Magnetic Resonance Imaging Scoring system
(RAMRIS) [20] criteria modified for PsA (Psoriatic Arthritis
Magnetic Resonance Imaging Scoring System, PsAMRIS)
[21]. The following bones were scored for erosion (0 to 10)
and bone oedema (0 to 3): hamate, capitate, trapezoid, trape-
zium, triquetrum, pisiform, lunate, scaphoid, distal ulna, distal
radius, bases of metacarpals (2 to 5), MCP joint region (2 to 5
proximal and distal to the joint), PIP joint region (2 to 5 proximal
and distal to the joint) and DIP joint region, (2 to 5 proximal and
distal to the joint). Bone proliferation was also scored at each
bone site as present or absent (0 or 1). Scores were averaged
across readers to provide one data set for this analysis. Data
from the fingers were also analysed on the basis of individual
MCP, PIP and DIP joints. A mean score for both readers was
obtained at each joint for erosions, bone oedema and bone
proliferation: erosions were scored (0 to 20), bone oedema (0
to 6) and bone proliferation (0 to 2) to include bone involve-
ment on each side of the joint.
Bone densitometry
Bone densitometry was performed at L1 to L4 and at the fem-
oral neck using a Lunar Expert dual energy absorptiometer
(GE Lunar, Madison, WI). Results were expressed as T scores
representing the number of standard deviations below the
average for a young adult at peak bone density. For the pur-
poses of this analysis T scores for L1 to L4 were averaged.
Statistical analysis
Intraclass correlation coefficients (ICC) with 95% confidence
intervals (CI) were used to assess the interobserver reliability
of scoring of XR and MRI features. Mann Whitney U tests and
Chi squared tests were used to test differences between AM
and non-AM groups in terms of demographics, disease activ-
ity, XR measures and MRI measures. Medians with ranges or
interquartile ranges and percentages were used to describe
these differences. Spearman's correlations were used to
assess the association between MRI bone oedema scores
and other measures.
Results
In total, 11 of the 28 patients were classified by the XR defini-
tion as AM and 17 as non-AM. In six cases, opinions of the XR
readers differed and these were re-examined and a consensus
reached. Of the 11 patients with XR-AM, seven fitted the clin-
ical definition of AM with digital shortening (Figure 1). The fol-
lowing analysis has used the XR definition of AM. Table 2
shows demographic details for the AM group compared with
the non-AM group, as well as their medications, DAS and func-
tional measures.
Interobserver reliability for scoring XR and MRI features
XR features of erosion and joint space narrowing were
assessed at the hands and feet by two observers (ND and
QR). Interobserver reliability was high for each with ICCs and
95% confidence intervals (CI) as follows: erosions 0.79 (0.42
to 0.83), joint space narrowing 0.90 (0.80 to 0.95) and when
combined for a modified total Sharp score (including DIP
joints) 0.86 (0.74 to 0.93).
Table 1
MRI sequences and acquisitions
WRIST FOV SLICE TR TE MATRIX
AXIAL T1 110 mm 3.0 mm 473 ms 19 ms 192 × 320
AXIAL STIR 110 mm 3.0 mm 4500 ms 59 ms 192 × 256
CORONAL T1 110 mm 3.0 mm 453 ms 19 ms 224 × 320
CORONAL STIR 110 mm 3.0 mm 4600 ms 62 ms 192 × 256
VIBE (post-contrast) 110 mm 0.6 mm 16.4 ms 6.83 ms 192 × 192
FINGERS
CORONAL T1 110 mm 3.0 mm 453 ms 19 ms 224 × 320
AXIAL T1 110 mm 3.0 mm 633 ms 19 ms 230 × 320
SAGITTAL STIR 110 mm 3.0 mm 3140 ms 54 ms 192 × 256
VIBE (post-contrast) 110 mm 0.6 mm 16.4 ms 6.83 ms 192 × 192
FOV = field of view, STIR = short tau inversion recovery, T1 = T1-weighted, TR = repetition time, TE = echo time, VIBE = volumetric interpolated
breath-hold examination.
Arthritis Research & Therapy Vol 11 No 1 Tan et al.
Page 4 of 9
(page number not for citation purposes)
For the MRI analysis, a total of 1013 bones at the dominant
wrist and fingers were scored for bone erosion, oedema and
proliferation by two readers (MØ and AD) working separately
in two different institutions. Reliability for scoring MRI erosions
and bone oedema was high: 0.80 (0.62 to 0.90) and 0.77
(0.57 to 0.88) respectively. It was lower for bone proliferation:
0.42 (0.07 to 0.67).
Clinical disease activity in AM versus non-AM patients
There was no difference between AM and non-AM groups in
terms of DAS with respect to inflammatory markers (ESR and
CRP), clinical evidence of joint inflammation (pain score, ten-
der and swollen joints counts), joint function (HAQ score and
PF-SF-36) or indicators of the severity of skin and nail disease
(PASI and nail severity score) (Table 2).
MRI and XR scores in AM vs non-AM patients
MRI scans of the dominant fingers (including DIP joints) and
wrist were obtained in all patients. Table 3 summarises the
data for the AM group versus the non-AM group. As expected,
XR and MRI erosion scores (median) were higher in the AM
group (89.8 versus 21.0, p = 0.001 and 53.0 versus 15.0, p
= 0.004, respectively). When the analysis was performed on a
joint-by-joint basis at the fingers, AM patients were found to
have higher scores for erosions and bone proliferation (Table
3). MRI bone oedema scores were also higher in the AM group
(14.7 versus 10.0, p = 0.056) (Figure 2) as were bone prolif-
eration scores (3.6 versus 0.7, p = 0.003). Of the 304 bones
where erosions were scored, 131 (43.1%) also scored posi-
tive for bone oedema. There was no difference between AM
and non-AM groups in the frequency of sacroiliitis or T scores
from bone densitometry (lumbar spine or hip).
Correlations between MRI, XR and clinical scores
The MRI erosion and bone oedema scores correlated strongly
with the XR erosion score (r = 0.709, p < 0.0001 and r = 0.65,
p = 0.0002, respectively). The MRI bone oedema score also
correlated strongly with the MRI erosion score (r = 0.66, p =
0.0002) and XR total joint space narrowing score (r = 0.65, p
= 0.0002) (Figure 3). Interestingly, the MRI bone oedema
score did not correlate with clinical indicators of disease activ-
ity such as the DAS28CRP or pain scores (r = 0.18, p = 0.39
and r = 0.03, p = 0.87, respectively). Both readers scored dia-
physeal bone oedema as present in six bones in four patients
(one AM and three non-AM). An example is shown in Figure 4
where diaphyseal bone oedema was revealed on both STIR
and VIBE sequences.
Discussion
The MRI features of PsA have only recently begun to be
explored [22]. This disease differs radiographically from RA in
that bone erosion and bone proliferation are both recognised
(and sometimes coexist in the same joint), although the char-
acteristic features of spondyloarthropathies (SpA), such as
sacroiliiitis and enthesitis, may also occur [23]. MRI reflects
these findings and provides additional information through its
capacity to image synovitis, tenosynovitis, dactylitis and also
bone oedema, which has been described at subchondral,
entheseal and diaphyseal locations [7]. AM represents the
most severe end of the spectrum as far as bone disease is
concerned in PsA with extreme bony lysis and 'pencil-in-cup'
deformities resulting in digital shortening and the main en lor-
gnette deformity. In this study we have investigated bone dis-
ease in patients with AM and non-AM forms of erosive PsA
using three imaging modalities; contrast-enhanced MRI, XR
and DEXA. We defined AM in two ways using information from
several sources and chose to use the radiographic definition
of Marsal and colleagues [19] as verified by two observers.
Our first concern was that this did not completely coincide
with the clinical definition from digital photographs, which
were assessed separately. On further investigation it became
apparent that those patients fitting the clinical definition
formed a subset of those defined radiographically.
For the purposes of this study we used the Psoriatic Arthritis
Magnetic Resonance Imaging Scoring system (PsAMRIS)
currently being developed and validated by an ongoing Out-
come Measures in Rheumatology Clinical Trials (OMERACT)-
based project [21]. This involved scoring bone erosion,
oedema and proliferation at the sites dictated by the RAMRIS
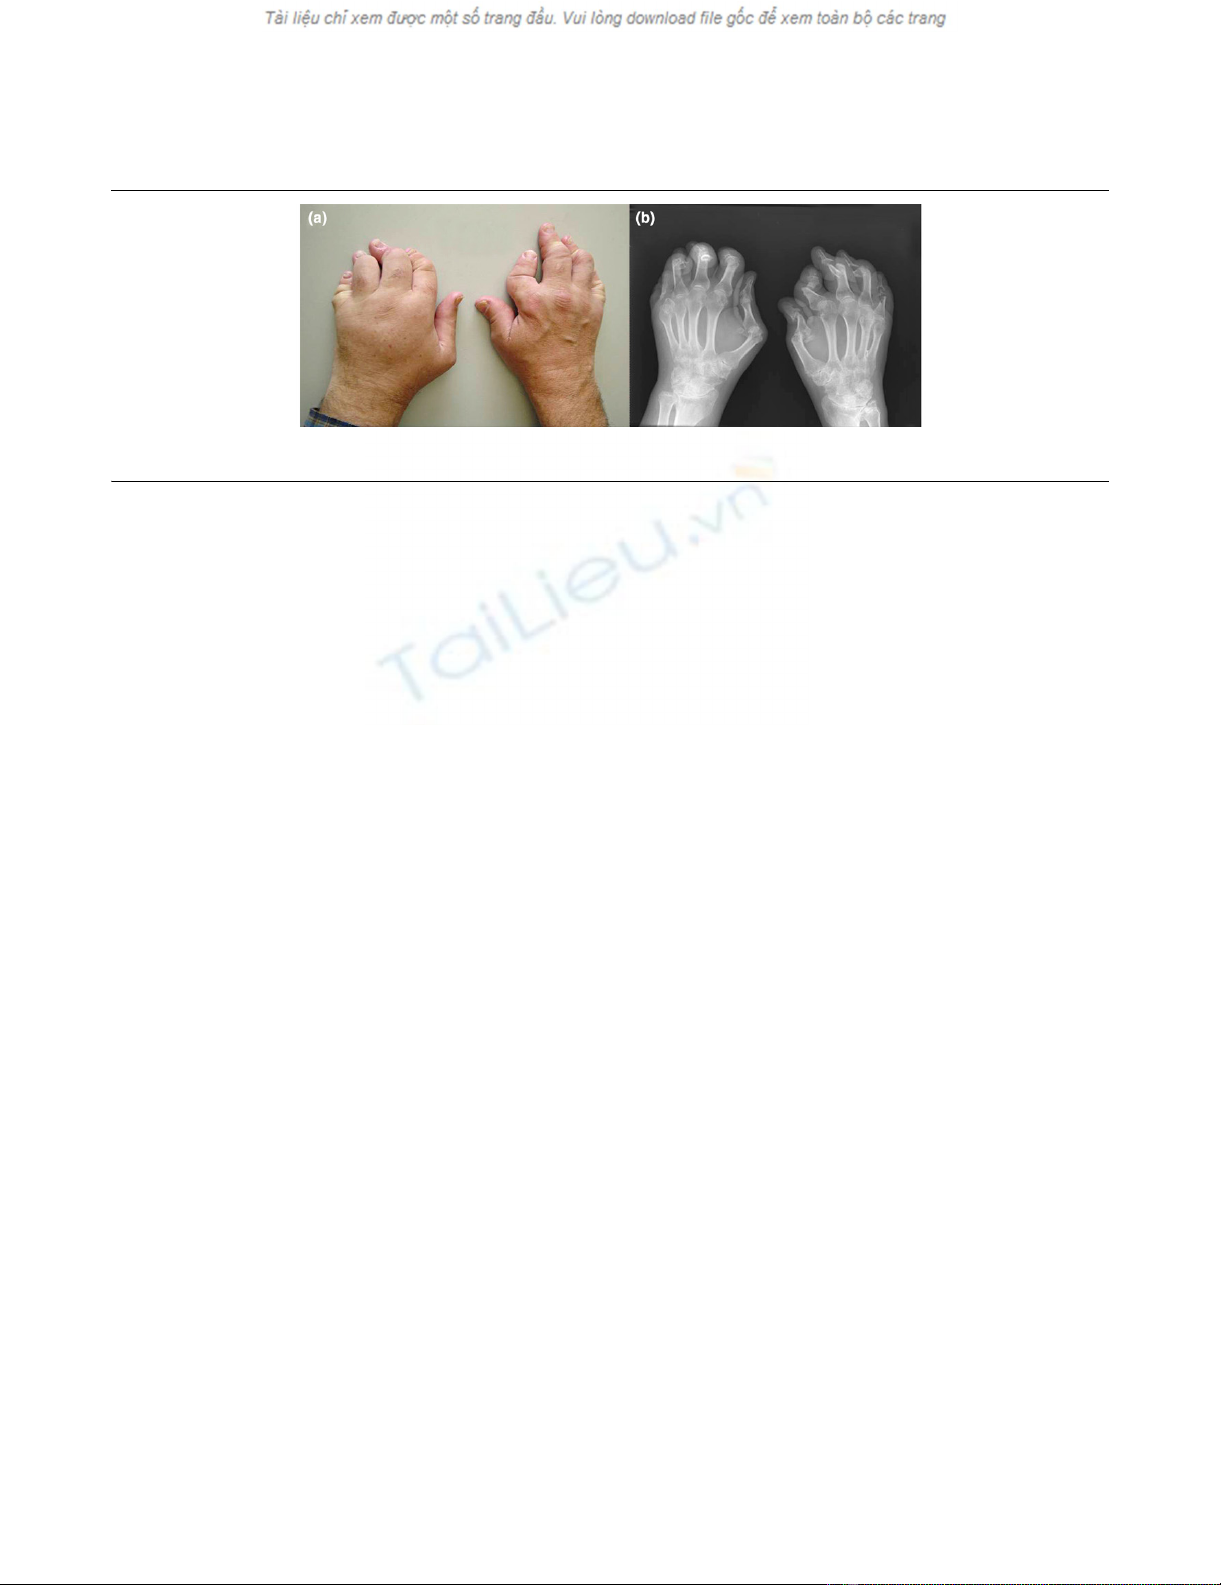
Figure 1
A patient with arthritis mutilans with digital shorteningA patient with arthritis mutilans with digital shortening. (a) Clinical photograph. (b) Radiograph of the hands.

Available online http://arthritis-research.com/content/11/1/R2
Page 5 of 9
(page number not for citation purposes)
Table 2
Demographics, medications and disease activity in AM and non-AM patients
Clinical features AM*(N = 11) Non AM (N = 17) p value
Median (range) Median (range)
Age (years) 52 (36 to 63) 50 (20 to 63) 0.56
Duration of PsA (years) 12 (5 to 35) 10 (5 to 25) 0.51
Duration of psoriasis (years) 22 (11 to 49) 20 (5 to 50) 0.24
Weight (kg) mean (range) 78 (65 to 107) 83 (68 to 111) 0.42
Female:Male 3:8 8:9 0.44
Ethnicity: European 91% 88% 0.94
Medications Number (%) Number (%)
Methotrexate 4 (36%) 11 (65%)
NSAIDs 7 (64%) 10 (10%)
Prednisone 5 to 20 mg/day 2 (18%) 2 (12%)
Sulphasalazine 2 to 3 g/day 3 (28%) 5 (29%)
Azathioprine 150 mg/day 0 1 (6%)
Hydroxychloroquine 400 mg/day 0 1 (6%)
Leflunomide 20 mg/day 1 (9%) 0
Cyclosporin 100 mg/day 0 1 (6%)
Disease activity Median (range) Median (range)
Tender joint count 17 (1 to 40) 11 (4 to 51) 0.98
Swollen joint count 6 (0 to 33) 4 (0 to 9) 0.20
Pain score 35 (16 to 78) 45 (6 to 82) 0.47
HAQ score (n = 27) 1.1 (0 to 3.5) 0.7 (0 to 3) 0.26
PF-SF-36 52.5 (5 to 85) 65 (10 to 90) 0.39
ESR (mm/hour) 14 (1 to 43) 13 (2 to 86) 0.61
CRP (mg/litre) (n = 25) 11.6 (3 to 59) 4.9 (< 1 to 46) 0.26
DAS28-CRP (n = 23) 3.91 (2.6 to 5.7) 4.2 (2.3 to 6.2) 0.64
DAS28-ESR (n = 28) 4.2 (1.7 to 6.1) 4.0 (1.9 to 6.9) 0.61
Psoriatic nail severity score 11 (0 to 47) 8 (0 to 22) 0.19
PASI (n = 26) 0.6 (0 to 12) 1.8 (0 to 10.3) 0.84
AM = arthritis mutilans, CRP = c-reactive protein, DAS28 – CRP = Disease Activity Score (28 swollen and tender joints, CRP, General Health
VAS), DAS28 – ESR = Disease Activity Score (28 swollen and tender joints, ESR, General Health VAS), ESR = Erythrocyte Sedimentation Rate,
HAQ = Health Assessment Questionnaire, non-AM = non-arthritis mutilans, NSAID = nonsteroidal anti-inflammatory drugs, PASI = Psoriasis Area
and Severity Index, PF-SF-36 = Physical Function component of the Short Form 36 Questionnaire, PsA = psoriatic arthritis.


