Open Access
Available online http://ccforum.com/content/12/2/R37
Page 1 of 7
(page number not for citation purposes)
Vol 12 No 2
Research
Ability of pleth variability index to detect hemodynamic changes
induced by passive leg raising in spontaneously breathing
volunteers
Geoffray Keller1, Emmanuel Cassar2, Olivier Desebbe1, Jean-Jacques Lehot1 and
Maxime Cannesson1
1Hospices Civils de Lyon, Groupement Hospitalier Est, Department of Anesthesiology and Intensive Care, Louis Pradel Hospital and Claude Bernard
Lyon 1 University, INSERM ERI 22, 28 avenue du doyen Lépine, 69500 Bron-Lyon, France
2Hospices Civils de Lyon, Groupement Hospitalier Est, Department of Cardiology, Louis Pradel Hospital and Claude Bernard Lyon 1 University, 28
avenue du doyen Lépine, 69500 Bron-Lyon, France
Corresponding author: Maxime Cannesson, maxime_cannesson@hotmail.com
Received: 14 Dec 2007 Revisions requested: 1 Feb 2008 Revisions received: 5 Feb 2008 Accepted: 6 Mar 2008 Published: 6 Mar 2008
Critical Care 2008, 12:R37 (doi:10.1186/cc6822)
This article is online at: http://ccforum.com/content/12/2/R37
© 2008 Keller et al.; licensee BioMed Central Ltd.
This is an open access article distributed under the terms of the Creative Commons Attribution License (http://creativecommons.org/licenses/by/2.0),
which permits unrestricted use, distribution, and reproduction in any medium, provided the original work is properly cited.
Abstract
Introduction Pleth Variability Index (PVI) is a new algorithm that
allows continuous and automatic estimation of respiratory
variations in the pulse oximeter waveform amplitude. Our aim
was to test its ability to detect changes in preload induced by
passive leg raising (PLR) in spontaneously breathing volunteers.
Methods We conducted a prospective observational study.
Twenty-five spontaneously breathing volunteers were enrolled.
PVI, heart rate and noninvasive arterial pressure were recorded.
Cardiac output was assessed using transthoracic
echocardiography. Volunteers were studied in three successive
positions: baseline (semirecumbent position); after PLR of 45°
with the trunk lowered in the supine position; and back in the
semirecubent position.
Results We observed significant changes in cardiac output and
PVI during changes in body position. In particular, PVI
decreased significantly from baseline to PLR (from 21.5 ± 8.0%
to 18.3 ± 9.4%; P < 0.05) and increased significantly from PLR
to the semirecumbent position (from 18.3 ± 9.4% to 25.4 ±
10.6 %; P < 0.05). A threshold PVI value above 19% was a
weak but significant predictor of response to PLR (sensitivity
82%, specificity 57%, area under the receiver operating
characteristic curve 0.734 ± 0.101).
Conclusion PVI can detect haemodynamic changes induced by
PLR in spontaneously breathing volunteers. However, we found
that PVI was a weak predictor of fluid responsiveness in this
setting.
Introduction
Hypovolaemia is among the most frequent causes of circula-
tory failure in the emergency medicine setting. Fluid loading is
often the first therapy to be applied to optimize cardiac output
(CO) in this situation. Static and the usual clinical variables
(central venous pressure, pulmonary capillary wedge pres-
sure, left ventricular end-diastolic area, mean arterial pressure
[MAP] and/or tachycardia) are known to be of little value in dis-
criminating between patients who will and those who will not
respond to volume expansion [1-5].
On the other hand, dynamic indices that rely on cardiopulmo-
nary interactions (variation in arterial pulse pressure (ΔPP) [3],
inferior vena cava diameter [6], superior vena cava diameter
[7], stroke volume [8] and aortic blood flow [4]), which are
based on variation in left ventricular stroke volume, have been
shown to be more accurate predictors of fluid responsiveness
in mechanically ventilated patients [2,3,6,8]. However, these
indices are invasive, not universally available, or operator
dependent.
Respiratory variation in pulse oximeter waveform amplitude
(ΔPOP) has been shown to be strongly related to ΔPP [9], to
AC = alternating current; CO = cardiac output; CVP = mean arterial pressure; DAP = diastolic arterial pressure; DC = direct current; ΔPOP = vari-
ation in pulse oximeter waveform amplitude; ΔPP = variation in arterial pulse pressure; HR = heart rate; PI = Perfusion Index; PLR = passive leg raising;
PVI = Pleth Variability Index; ROC = receiver operating characteristic; SAP = systolic arterial pressure.

Critical Care Vol 12 No 2 Keller et al.
Page 2 of 7
(page number not for citation purposes)
be sensitive to changes in ventricular preload [10] and to be
accurate predictors of fluid responsiveness [2]. Recently, a
study conducted in spontaneously ventilated volunteers [11]
showed that ΔPOP can reflect changes in ventricular preload
in spontaneously breathing volunteers. However, ΔPOP can-
not easily be calculated and continuously monitored at the
bedside
Pleth Variability Index (PVI; Masimo Corp., Irvine, CA, USA) is
new software that allows automatic and continuous monitoring
of respiratory variations in the pulse oximeter waveform ampli-
tude. This device has already been tested in our institution in
mechanically ventilated patients [12]. The aim of the present
study was to test the ability of PVI to detect changes in ven-
tricular preload in spontaneously breathing volunteers.
Materials and methods
This study was conducted in accordance with the ethical
standards of our institution and with the Helsinki Declaration
of 1975 and revised in 1983. After written informed consent
had been obtained, we studied 25 volunteers with no previous
arterial hypertension or known cardiac disease, active sepsis
and/or cardiac arrhythmias at the time of the study. Each
patient was equipped with a pulse oximeter probe (LNOP®
Adt; Masimo Corp.) attached at the index of the left hand and
wrapped to prevent outside light from interfering with the sig-
nal. This pulse oximeter was connected to a Masimo Radical 7
monitor (Masimo SET; Masimo Corp.) with PVI software (ver-
sion 7.0.3.3). Pulse oximeter plethysmographic waveforms
were recorded from this monitor on a personal computer using
PhysioLog software (PhysioLog V1.0.1.1; Protolink Inc., Rich-
ardson, TX, USA) and were analyzed by an observer who was
blinded to other haemodynamic data. An arterial pressure cuff
was positioned at the right arm in volunteers in order to meas-
ure systolic arterial pressure (SAP), diastolic arterial pressure
(DAP) and MAP, as well as heart rate (HR; Solar 6000; Gen-
eral Electric, Milwaukee, WI, USA). Breathing rate was meas-
ured clinically by one of the investigators (OD).
Cardiac output
Cardiac output was assessed using echocardiography (CV
70; Acuson-Siemens Corp., Mountain View, CA, USA). Aortic
blood flow was measured using a pulsed wave Doppler beam
directed at the level of the aortic valve such that the click of the
aortic closure could be observed. The aortic valve area was
calculated from the diameter of the aortic orifice (which was
considered as constant in all patients [2 cm]) as aortic valve
area = π × (aortic diameter/2)2. The stroke volume was calcu-
lated as stroke volume = aortic valve area × the velocity time
integral of aortic blood flow. The CO was calculated as CO =
stroke volume × heart rate. The mean of five measurements
performed at the end of the expiratory period were used for
statistical analysis.
Pleth Variability Index calculation
PVI is a measure of the dynamic change in perfusion index that
occurs during a complete respiratory cycle and has previously
been detailed [12]. For the measurement of pulse oximeter
oxygen saturation, red and infrared lights are used. A constant
amount of light (termed DC) from the pulse oximeter is
absorbed by skin, other tissues and nonpulsatile blood,
whereas a variable amount of blood (termed AC) is absorbed
by the pulsating arterial inflow. For Perfusion Index (PI) calcu-
lation, the infrared pulsatile signal is indexed against the non-
pulsatile infrared signal and expressed as a percentage (PI =
[AC/DC] × 100), reflecting the amplitude of the pulse oxime-
ter waveform. Then, PVI is calculated by measuring changes in
PI over a time interval sufficient to include one or more com-
plete respiratory cycles as follows: PVI = ([PImax - Pimin]/PImax)
× 100.
Other haemodynamic measurements
At each step of the protocol the following parameters were
recorded: SAP, MAP, DAP, HR, breathing rate, CO, and pulse
oximeter oxygen saturation.
Study protocol
The study protocol is summarized in Figure 1. A first set of
measurements was taken with volunteers in the semirecum-
bent position (45°; baseline1 position), when volunteers were
quietly and spontaneously breathing after 5 minutes of rest.
Then, the lower limbs were lifted while straight (45°) with the
trunk lowered in the supine position (passive leg raising [PLR]
position) and volunteers were left in this position for 5 minutes.
A second set of measurements was obtained 3 minutes after
leg elevation. We chose not to record data after 1 minute after
PLR because we observed significant artefacts in the pulse
oximeter waveforms that cast doubt on any interpretation. A
third set of measurements was recorded after 5 minutes of
rest in the semirecumbent position, as in the baseline1 posi-
tion (baseline2 position). Responders to volume expansion
induced by PLR were defined as volunteers presenting more
than 12.5% [13] increase in CO after PLR.
Statistical analysis
All data are presented as mean ± standard deviation. Changes
in haemodynamic parameters induced by changes in loading
conditions were assessed using a nonparametric Mann-Whit-
ney U-test or Wilcoxon rank sum test when appropriate.
Spearman rank method was used to test linear correlations.
Volunteers were divided into two groups according to the per-
centage increase in CO after PLR: responders were defined
as volunteers exhibiting at least a 12.5% [13] increase in CO,
and nonresponders were volunteers who exhibited under
12.5% increase in CO. Receiver operating characteristic
(ROC) curves was generated for PVI, varying the discriminat-
ing threshold of this parameter. P < 0.05 was deemed to rep-
resent statistical significance. All statistic analysis was

Available online http://ccforum.com/content/12/2/R37
Page 3 of 7
(page number not for citation purposes)
performed using SPSS 13.0 for Windows (SPSS, Chicago,
IL, USA).
Results
Twenty-five volunteers were included. This group consisted of
12 females and 13 males aged between 21 and 55 years
(mean age 30 ± 9 years).
Effects of changes in body position on haemodynamic
data
Data at baseline, in PLR position and back at the baseline
position are shown in Table 1. We observed no significant
changes in SAP, DAP, MAP, HR, and breathing rate during
changes in body position. In contrast, we observed significant
changes in CO, PI and PVI during changes in body position.
Specifically, CO was significantly increased from baseline1 to
the PLR position (from 4.2 ± 1.1 l/minute to 4.6 ± 1.3 l/minute;
P < 0.05) and was significantly decreased from PLR position
to baseline2 (from 4.6 ± 1.3 l/minute to 3.9 ± 1.1 l/minute; P
< 0.05). At the same time, we observed a significant increase
in PI (from 3.5 ± 2.4% to 4.9 ± 3.2%; P < 0.05) and a signif-
icant decrease in PVI (from 21.5 ± 8.0% to 18.3 ± 9.4%; P <
0.05) from baseline1 to the PLR position, and a significant
decrease in PI (from 4.9 ± 3.2% to 2.3 ± 1.7%; P < 0.05) and
a significant increase in PVI (fom 18.3 ± 9.4% to 25.4 ±
10.6%; P < 0.05) from PLR position to baseline2 (Figures 2
to 4).
Ability of PVI to predict fluid responsiveness in
spontaneously breathing patients
Of the 25 studied volunteers, 11 (44 %) were responders to
PLR. Responders exhibited significantly higher PVI values at
baseline1 compared with nonresponders (25.5 ± 7.9 versus
18.3 ± 6.9; P < 0.05). A threshold PVI value of >19% was a
weak but significant predictor of response to PLR (sensitivity
82%, specificity 57%, area under the ROC curve 0.734 ±
0.101). The relationship between PVI value at baseline and
percentage increase in CO after PLR was close to but did not
reach statistical significance (r = 0.385; P = 0.058; Figure 5).
Discussion
This study shows that PVI, an index that allows automatic and
continuous calculation of respiratory variations in the pulse oxi-
meter plethysmographic waveform amplitude, can detect
haemodynamic changes induced by passive leg raising in
spontaneously breathing volunteers. However, we found that
PVI was a weak predictor of fluid responsiveness in this
Figure 1
Study protocolStudy protocol. A first set of measurements was taken with volunteers
in the semirecumbent position (45°; baseline1 position), when volun-
teers were quietly and spontaneously breathing after 5 minutes of rest.
Then, the lower limbs were lifted straight (45°) with the trunk lowered in
the supine position (passive leg raising [PLR] position), and volunteers
were left in this position for 5 minutes. A second set of measurements
was obtained 3 minutes after leg elevation. We chose not to record
data after 1 minute after PLR because we observed significant arte-
facts in the pulse oximeter waveforms that cast doubt on any interpreta-
tion. A third set of measurements was recorded after 5 minutes rest in
the semirecumbent position, as in the baseline1 position (baseline2
position). Responders to volume expansion induced by PLR were
defined as those volunteers exhibited more than 12.5% [13] increase in
cardiac output after PLR.
Table 1
Haemodynamic data at baseline, after PLR and back at baseline
Parameter Baseline1 PLR position Baseline2
SAP (mmHg) 130 ± 12 125 ± 11 129 ± 11
DAP (mmHg) 73 ± 7 70 ± 6 72 ± 7
MAP (mmHg) 89 ± 8 85 ± 6 89 ± 7
HR (beats/minute) 69 ± 12 69 ± 11 71 ± 11
PP (mmHg) 57 ± 13 59 ± 13 57 ± 8
BR (breaths/minute) 15 ± 5 15 ± 5 15 ± 6
CO (l/min) 4.2 ± 1.1 4.6 ± 1.3* 3.9 ± 1.1†
PVI (%) 21.5 ± 8.0 18.3 ± 9.4* 25.4 ± 10.6†
PI (%) 3.5 ± 2.4 4.9 ± 3.2* 2.4 ± 1.7†
*P < 0.05 versus baseline1; †P < 0.05 versus passive leg raising (PLR) position. BR, breathing rate; CO, cardiac output; DAP, diastolic arterial
pressure; HR, heart rate; MAP, mean arterial pressure; PI, Perfusion Index; PP, arterial pulse pressure; PVI, Pleth Variability Index; SAP, systolic
arterial pressure.

Critical Care Vol 12 No 2 Keller et al.
Page 4 of 7
(page number not for citation purposes)
setting, as are most of the dynamic indicators of fluid respon-
siveness in spontaneously breathing patients.
Assessment of fluid responsiveness in mechanically ventilated
patients has now been extensively studied, and it is known that
dynamic indicators that rely on cardiopulmonary interactions
are the best predictors in this setting [2,3,14]. Recently,
ΔPOP has been shown to be a noninvasive and reliable pre-
dictor of fluid responsiveness in the operating room [2,15,16]
and in the intensive care unit [17] in mechanically ventilated
patients. Moreover, it has been demonstrated to decrease
significantly after PLR in spontaneously breathing volunteers,
suggesting that this parameter may be of value in assessment
of fluid responsiveness in this population [11]. However, this
index is difficult to measure at the bedside and cannot be
visually estimated from the monitor screen because of the gain
processing that is used by most of the monitors [2]. We
recently demonstrated that PVI could continuously and auto-
matically monitor ΔPOP in mechanically ventilated patients
[12]. In that study we found that a PVI value above 11.5%
could discriminate between ΔPOP above 13% and ΔPOP of
13% or less with a sensitivity of 93% and a specificity of 97%.
Area under the curve for PVI to predict ΔPOP above 13% was
0.990 ± 0.07 in this study. However, although we found PVI
to be of value in mechanically ventilated patients, its utility in
spontaneously breathing patients had never been investigated
[12].
The pulse oximeter waveform relies on light absorption. Briefly,
light absorption includes two components. The first compo-
nent is said to be constant and is due to light absorption by
bone, tissue, pigments, nonpulsatile blood and skin. Venous
blood is also responsible for some constant absorption, but
this is still under investigation [18,19]. The second component
is said to be pulsatile absorption, which is due primarily to arte-
rialized blood. The PI is defined as the ratio between constant
absorption (AC) and pulsatile absorption (DC), reflecting the
amplitude of the plethysmographic waveform. PVI can auto-
matically detect the maximal and minimal PI value over a period
of time sufficient to include at least one complete respiratory
cycle. PVI is then automatically and continuously calculated as
(PImax - PImin)/PImax, reflecting respiratory variations in PI. This
algorithm allows continuous monitoring of the respiratory vari-
ations in the pulse oximeter waveform amplitude.
Assessment of fluid responsiveness in spontaneously breath-
ing patients is difficult, and cardiopulmonary interactions in
this setting differ greatly from those observed in mechanically
ventilated patients [20-22]. Moreover, in this setting, fre-
quency and tidal volumes may vary from breath to breath.
However, further studies are required to explore this topic, as
suggested by recent published experimentations conducted
in this setting and focusing on ΔPOP [11]. PLR mimics a 'rapid
and transient' fluid loading of 300 ml by transferring a volume
of blood to the central compartment. In association with rapid
measurements of changes in aortic blood flow, it provides a
useful tool with which to evaluate fluid responsivness in
mechanically ventilated but also in spontaneously breathing
patients who are suspected of being hypovolaemic [13]. In
normotensive individuals, this manoeuvre not only increases
preload but also decreases peripheral vascular resistance
[13]. Our data, showing that PI significantly increases after
PLR (Figure 4), may support this hypothesis because PI is
related to vasomotor tone. In the present study, we applied a
modified form of PLR associated with trunk lowering, which
has previously been used and should amplify the transient
haemodynamic changes [13]. These changes occur maximally
Figure 2
Changes in perfusion index during changes in body positionChanges in perfusion index during changes in body position. PLR, pas-
sive leg raising.
Figure 3
Changes in PVI after changes in body positionChanges in PVI after changes in body position. PLR, passive leg rais-
ing; PVI, Pleth Variability Index.

Available online http://ccforum.com/content/12/2/R37
Page 5 of 7
(page number not for citation purposes)
during the first minute and disappear after a few minutes. We
performed measurements only during the third minute in order
to obtain a stable and reliable plethysmographic signal that
was not disturbed by changes in vasomotor tone.
Recently, Soubrier and coworkers [21] found ΔPP to be a
weak predictor of fluid responsiveness in spontaneously
breathing patients. In that study they showed that ΔPP above
12% was able to discriminate responders from nonrespond-
ers to volume expansion with 92% sensitivity and 63% specif-
icity. These data indicate slightly better performance than
suggested by our data obtained with PVI. In particular, area
under the ROC curve for ΔPP was 0.81 ± 0.08 in their study
as compared with 0.734 ± 0.101 in ours. This difference may
be related to the sensitivity of the pulse oximeter waveform to
changes in vasomotor tone observed in spontaneously
breathing volunteers and to the fact that PVI is unable to dis-
criminate between respiratory changes in PI from other
changes in PI. We can postulate that these changes are less
frequent and less important in mechanically ventilated
patients, as was suggested by a previous study conducted in
this setting in our institution and showing that PVI was an
accurate monitoring of ΔPOP [12]. Further studies investigat-
ing the ability of PVI to predict fluid responsiveness in mechan-
ically ventilated and spontaneously breathing patients are
warranted.
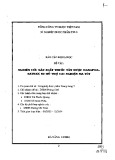
Figure 4
Evolution in PI and PVIEvolution in PI and PVI. Shown is the volution in Perfusion Index (PI) and Pleth Variability Index (PVI) during changes in body position over a 15-
minute period in an illustrative volunteer. Also shown (at the bottom of the figure) are the raw plethysmographic waveforms at baseline1, passive leg
raising (PLR), and baseline2. We observed an increase in PI after PLR and a decrease in PI as the volunteer was positioned in the semirecumbent
position (baseline 2; see arrows). At the same time, we observed inverse changes in PVI. Specifically, PVI exhibited a slight increase during PLR that
was related to a signal artefact in PI. Raw plethysmographic waveforms corroborate PVI values.
Figure 5
Relationship between PVI at baseline1 and percentage change in CO after PLRRelationship between PVI at baseline1 and percentage change in CO
after PLR. There was non significant relationship between Pleth Varia-
bility Index (PVI) at baseline and percentage change in cardiac output
(CO) after passive leg raising (PLR). Horizontal dashed line shows
increase in CO of 12.5%. Vertical dashed line shows PVI value of 19%,
which allowed discrimination between responders and nonresponders
to PLR with a sensitivity of 82% and a specificity of 57%.