
http://www.iaeme.com/IJM/index.asp 58 editor@iaeme.com
International Journal of Management (IJM)
Volume 9, Issue 1, Jan–Feb 2018, pp. 58–64, Article ID: IJM_09_01_010
Available online at
http://www.iaeme.com/ijm/issues.asp?JType=IJM&VType=9&IType=1
Journal Impact Factor (2016): 8.1920 (Calculated by GISI) www.jifactor.com
ISSN Print: 0976-6502 and ISSN Online: 0976-6510
© IAEME Publication
QUALITY PERCEPTION OF FOOD PRODUCTS
AMONG HOME MAKERS
Dr. Mamatha B
Associate Professor, Department of Resource Management and Research Centre,
Smt. VHD central Institute of Home Science, Bangalore, India
Pavithra Ghatke
Research Scholar, Department of Resource Management and Research Centre,
Smt. VHD central Institute of Home Science, Bangalore, India
ABSTRACT
Quality is one of the important characteristics of a product. To consumers, quality
means performance, durability, service, aesthetics, reliability, features of a product.
But purchasing of quality products is every one’s dream. In India there are many acts
to protect consumers when they face problems like food adulteration, misleading
advertisement, short weights spurious products and so on. Perceiving good quality of
products in today’s market situation is the main concern of the consumer. Hence this
study was taken to elicit information quality perception of food products among
homemakers in Bangalore city. Survey method and questionnaire was the tool used to
collect information. A sample of one hundred homemakers was selected through
simple random sampling technique. The objectives of the study includes: to ascertain
factors considered in the selection of food products, to find out the quality perception
towards food products among home makers and to assess the satisfaction of product
quality and purchase quality. The major findings of the study were that most of the
respondents preferred newspaper as a source of information on the food products. The
factors considered while purchasing food products by majority of the homemakers
were quality followed by price, availability and brand. It was further found that 96
percent of the respondents remarked purity as an important aspect for a quality food
product followed by taste, food hygiene and standardized marks. It was evident that,
57 percent of the respondents were highly satisfied with product quality and 43
percent of the respondents were moderately satisfied with product quality. Higher
percentages of the respondents were highly satisfied with purchase quality and only
47 percent of the respondents were moderately satisfied with purchase quality. There
exists a positive significant relationship between product quality and purchase quality
as remarked by the respondents regarding the level of satisfaction that was found to
be +0.0843. Higher the satisfaction of product quality better is the purchase quality.
Key words: Quality, purchase, purity, standardized marks, satisfaction.

Quality Perception of Food Products Among Home Makers
http://www.iaeme.com/IJM/index.asp 59 editor@iaeme.com
Cite this Article: Dr. Mamatha B and Pavithra Ghatke, Quality Perception of Food
Products Among Home Makers. International Journal of Management, 9 (1), 2018,
pp. 58–64. http://www.iaeme.com/IJM/issues.asp?JType=IJM&VType=9&IType=1
1. INTRODUCTION
Consumers play an important role in the growth and development of any country and
perceiving good quality products in today’s market situation is the major concern. In India
there are many acts that protect consumers when they face problems like food adulteration,
misleading advertisement, short weights spurious products and so on. Further there are
standardized marks like ISI, AGMARK, Hall mark, Eco mark, wool mark, silk mark that
assures the quality of the products for the consumers.
Product quality is a product feature matched with 8 dimensions namely, performance,
features, conformance, reliability, durability, serviceability, aesthetics, and customer-
perceived quality. Briefly, performance is the products primary operating characteristic,
features means additional features for the product, conformance is representing the extent in
which the product’s design and also its operating features met the established standards,
reliability specifies the probability that the product will be operating properly over a specified
period of time under the stated condition of usage, durability is the means of the overall
amount of the consumers get to use the product before the product physically deteriorates or
until it needs to be replaced, serviceability refers to the speed, competency , and courtesy
during repairs, aesthetics is how the product appeal to the five sense and lastly customer
perceived quality indicates the customer’s perception of a product’s quality, which it
basically on reputation of the firm( Garvin, 1988).
Consumer perception applies to the concept of sensory perception to marketing and
advertising. Just as sensory perception relates to how humans perceive and process sensory
stimuli through their five senses, consumer perception pertains to how individuals form
opinions about companies and the merchandise they offer through the purchases they make.
Merchants apply consumer perception theory to determine how their customers perceive
them. There are also consumer perception theories to develop marketing and advertising
strategies intended to retain current customers and attract new ones (Vikash and Vinod Kumar
2017).
Good quality products have been man's main endeavor from the earliest days of human
existence. Products ‘quality can be considered as a complex characteristic of food which
determines the value or acceptability by consumers. In India, marketing systems are not well
organized and developed as compared to other developed nations. This may be due to many
factors such as growing population, lack of resources to deal with the competition at the
international level and to meet the requirements of the customers and so on. Many countries
had taken the ISO 9001 taken seriously as the quality control system, to protect their
population against unsafe, adulterated, or otherwise poor quality products. In India we have
Food Act, AGMARK, and ISI and so on, to ensure quality food products. But still there are
many lacunae and also there exists lack of awareness about the international standard of
quality and the like among consumers (Hawa Singh and Hemlata Sharma, 2013). Hence this
study was taken to elicit information on Quality Perception of Food Products among Home
Makers.

Dr. Mamatha B and Pavithra Ghatke
http://www.iaeme.com/IJM/index.asp 60 editor@iaeme.com
2. OBJECTIVES
To ascertain factors considered in the selection of food products among home makers.
To find out the quality perception towards food products among home makers.
To assess the satisfaction of product quality and purchase quality.
3. METHODOLOGY
To elicit information on quality perception of food products among homemaker’s, Survey
method and questionnaire was the tool used. The questionnaire was divided into basic data
and specific data. The basic data consisted of name, age, address, occupation, religion,
educational qualification and family income.
Under specific data, the information such as sources of information on food product,
aspects on quality, perceived quality attributes of food products and satisfaction were asked to
the respondents to know their perception on food products. Likert scale was used to assess the
attitude on perceived quality attributes on food products. Five Points were assigned such as –
Very important- 5, Moderately important – 4, Important- 3, Fairly important – 2 and Not
important -1. Kuppuswamy’s socio economic status scale was used to collect basic
information of the respondents. To gather information on quality perception of food products
among home maker, a sample of 100 home makers were selected randomly. A pilot study
was conducted on ten percent of selected samples, to assess feasibility of the questionnaire.
Based on the result of the pilot study the questionnaire was modified accordingly for the main
study. The modified questionnaires were distributed and the data collected were then
complied and analyzed.
4. MAJOR FINDINGS
4.1. Background Information
Majority of the respondents were in the age range of 20-30 years, 38 percent of the
respondents were in the age range of 30-40 years and 12 percent of the respondents were in
the age group of 40-50years. Higher percentage of the respondents were professionals,
whereas 26 percent of the respondents were Post Graduate and 21 percent of them were
Graduates followed by 22 percent of the respondents education qualification was PUC.
Majority of the respondents worked in IT Sector, whereas 21 percent of the respondents
were home makers, tailors, and beauticians, 19 percent of the respondents belong to business
class, 15 percent of the respondents worked in Private Sectors and 7 percent of the
respondents worked in Public Sector.
Higher percent of the respondents belong to Nuclear family and only 14 percent of the
respondents belong to Joint family. Most of the respondents were Hindus, 14 percent of
them were Christians and a few were Muslims. Further, 74 percent of the respondents’
family income per month was more than Rs: 34,393 and only 26 percent family income per
month is Rs: 17,197 -34,392. Majority of the respondents’ family size fall under the
category of 2-3 members, 31 percent of the respondents family size fall under the category of
4-5 members, followed by 25 percent of the respondents family size is above 5 members.
Quality Perception of Food Products Among Home Makers
http://www.iaeme.com/IJM/index.asp 61 editor@iaeme.com
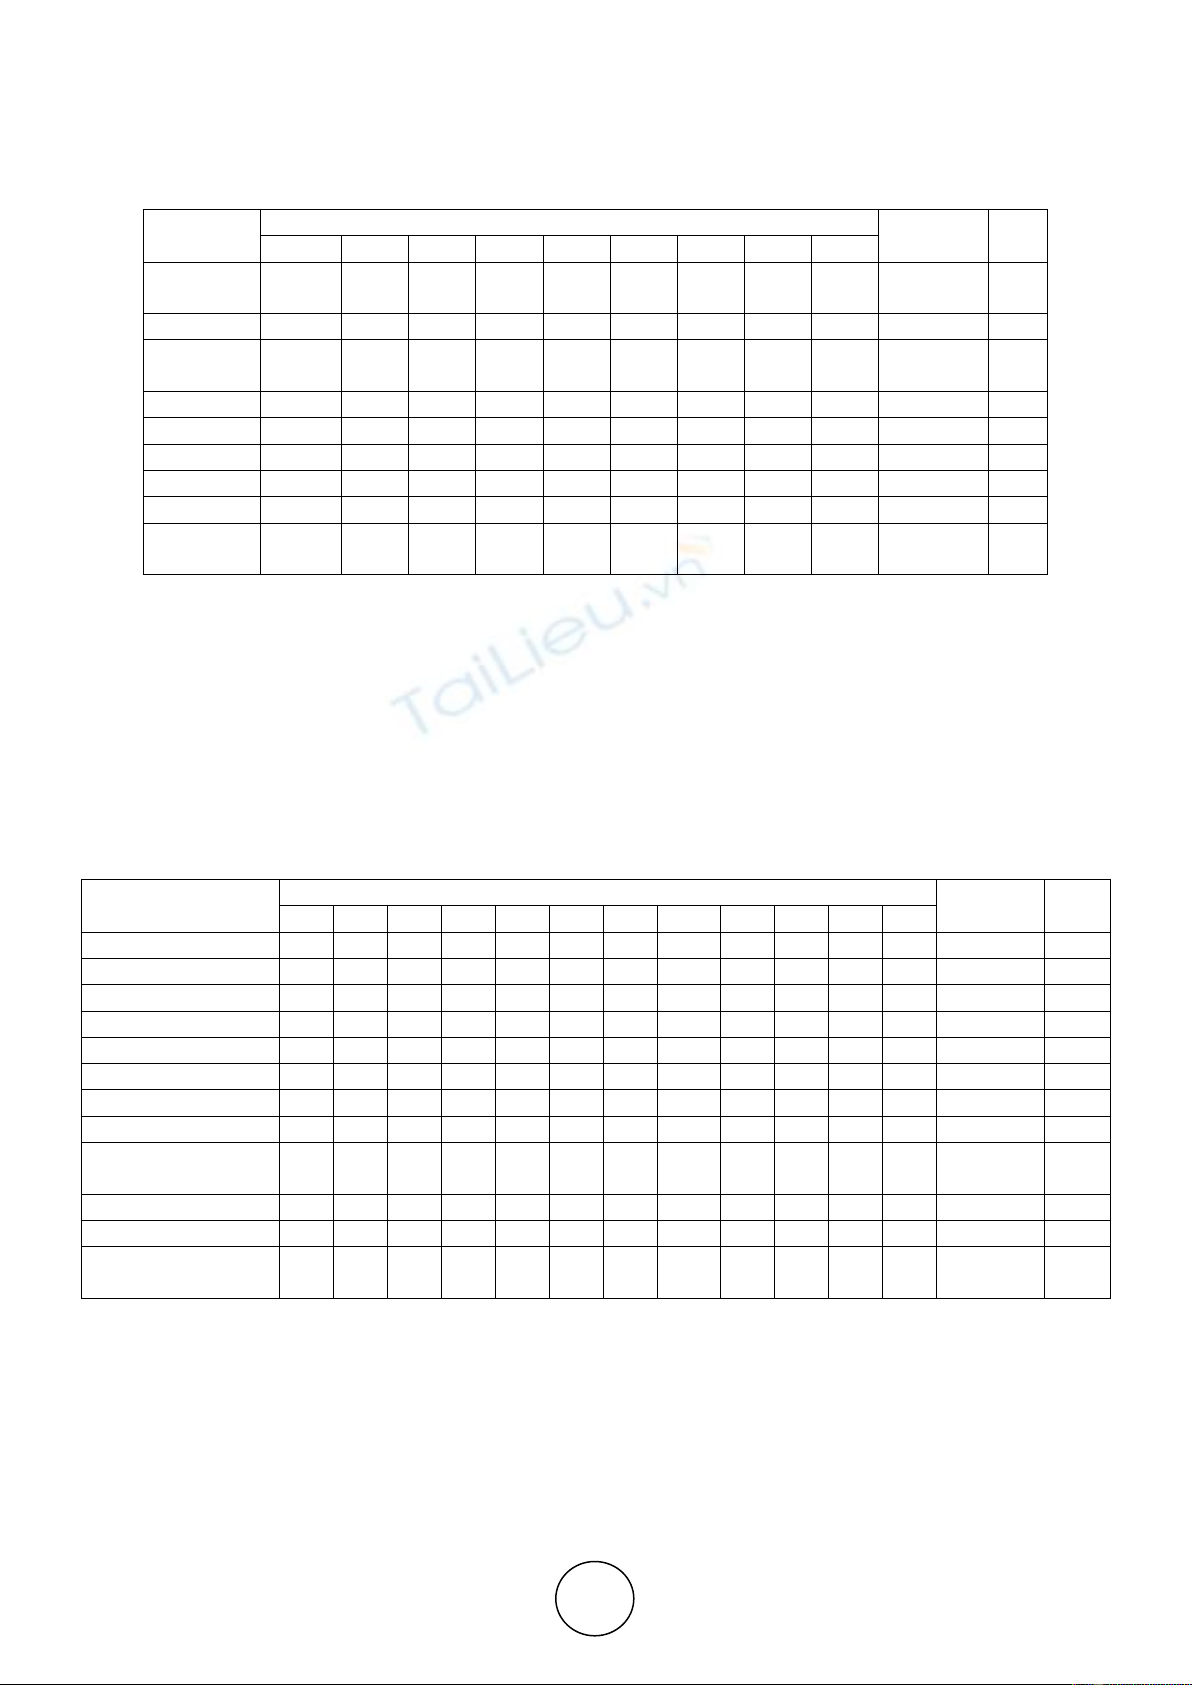
Table 1 Source of Information on the Food Products
N = 100
Sources
Preferential Ranking (%)
Ranking
Average
I
II
III
IV
V
VI
VII
VIII
IX
News
paper
37.0
25.0
5.0
1.0
2.0
5.0
9.0
12.0
4.0
3.41
I
Magazine
18.0
1.0
18.0
17.0
9.0
25.0
0.0
3.0
9.0
4.42
III
Cook
books
10.0
12.0
10.0
26.0
18.0
0.0
7.0
9.0
8.0
4.51
IV
Television
9.0
7.0
3.0
12.0
39.0
16.0
8.0
0.0
6.0
4.81
V
Radio
10.0
28.0
8.0
19.0
5.0
11.0
0.0
19.0
0.0
4.09
II
Internet
5.0
5.0
28.0
8.0
13.0
1.0
2.0
27.0
11.0
5.31
VI
Posters
0.0
17.0
0.0
15.0
4.0
2.0
39.0
3.0
20.0
6.03
VII
Pamphlets
1.0
0.0
26.0
1.0
0.0
28.0
7.0
8.0
29.0
6.25
IX
Word of
mouth
10.0
5.0
3.0
0.0
9.0
13.0
28.0
19.0
13.0
6.17
VIII
Source: Field Study
It is evident from table 1 that most of the respondents preferred News Paper as a source of
information on the food products and ranked first. Further from the average ranking it can be
noticed that the second preference was given to Radio, third preference to Magazine, fourth
preference to Cook Books, fifth preference to Television, sixth preference to Internet, seventh
to Posters, eighth preference to Word of mouth and ninth preference to Pamphlets as a source
of information on the food products.
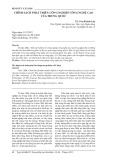
Table 2 Factors Considered While Selection of Food Products
N = 100
Factors
Preferential Ranking (%)
Ranking
Average
I
II
III
IV
V
VI
VII
VIII
IX
X
XI
XII
Quality
32
12
12
3
22
12
3
2
2
0
0
0
3.4
I
Price
7
26
6
27
13
18
0
0
2
1
0
0
3.9
II
Availability
2
3
30
30
3
7
1
3
6
0
0
15
5.4
III
Brands
4
14
12
3
19
10
20
5
0
1
1
11
5.7
IV
Package
5
0
0
10
8
24
12
1
17
5
6
12
7.3
VI
Nutritional label
11
3
1
0
18
1
11
15
0
28
7
5
7.3
VI
Standardized marks
6
21
20
1
0
9
0
14
10
5
13
1
5.7
IV
Advertisement
0
3
0
16
0
11
25
10
15
8
7
5
7.4
VII
Friends/relatives/fa
mily member
5
16
9
0
0
1
6
17
21
3
12
10
7.2
V
Discount
12
0
6
8
2
0
9
12
0
21
28
2
7.7
VIII
Free gifts
1
0
4
2
15
5
1
15
9
17
21
10
8.6
X
Source(local/import
ed)
15
2
0
0
0
2
12
6
18
11
5
29
8.4
IX
Source: Field Study
Table 2 shows that most of the respondents preferred Quality as an important factor on the
selection of food products. Further from the average ranking it can be noticed that second
importance was given to Price by the respondents, third to Availability, fourth to Brands, fifth
to Friends/relatives/family members, sixth to nutritional labels and standardized marks,
seventh to Advertisements, eight to Discounts, ninth to Free gifts and tenth to
Source(Local/Imported.

Dr. Mamatha B and Pavithra Ghatke
http://www.iaeme.com/IJM/index.asp 62 editor@iaeme.com
Table 3 Responses on Importance of Quality Food Products
N =100
Aspects
Response on Importance (%)
Average
Very
important
Moderately
important
Important
Fairly
Important
Not
important
Price
29.0
31.0
23.0
17.0
0.0
74.4
Purity
86.0
10.0
4.0
0.0
0.0
96.4
Food hygiene
78.0
14.0
8.0
0.0
0.0
94.0
Product safety
49.0
27.0
24.0
0.0
0.0
85.0
Appearance
29.0
45.0
22.0
4.0
0.0
79.8
Taste
78.0
22.0
0.0
0.0
0.0
95.6
Brand
43.4
56.6
0.0
0.0
0.0
88.8
Labels
39.0
37.0
24.0
0.0
0.0
83.0
Package
38.0
27.0
35.0
0.0
0.0
80.6
Standardized
quality marks
73.0
14.0
13.0
0.0
0.0
92.0
Source: Field Study
From table 3 it was found that 96 percent of the respondents remarked Purity as an
important aspect for a quality food product, 95 percent of them considered Taste as an
important aspect, 94 percent of them considered Food hygiene as an important aspect and 92
percent of the respondents considered Standardized Marks as an important aspect.
Further, 88 percent of the respondents considered Brand as an important aspect, 85
percent of the respondents considered Product Safety as an important aspect, 83percent for
Labels, and 80 percent for Package, 79 percent for Appearance and 74 percent for Price.
Table 4 Satisfied level on the Availability of Quality Food Products
N = 100
Satisfaction Level
Respondents
Product quality
Purchase quality
Number
Percent
Number
Percent
Highly satisfied
57
57.0
53
53.0
Moderately satisfied
43
43.0
47
47.0
Total
100
100.0
100
100.0
r = + 0.843*
Source: Field Study
It is evident from table 4 that, 57 percent of the respondents were highly satisfied with
product quality and 43 percent of the respondents were moderately satisfied with product
quality.
Higher percentages of the respondents were highly satisfied with purchase quality and
only 47 percent of the respondents were moderately satisfied with purchase quality.
There exists a positive significant relationship between product quality and purchase
quality as remarked by the respondents regarding the level of satisfaction that was found to be
+0.0843. Higher the satisfaction of product quality better is the purchase quality.


![Bài giảng Quản lý sản xuất cho kỹ sư: Chương 3 - Đường Võ Hùng [Chuẩn Nhất]](https://cdn.tailieu.vn/images/document/thumbnail/2025/20250812/oursky02/135x160/10441768298495.jpg)


