HPU2. Nat. Sci. Tech. Vol 03, issue 03 (2024), 20-26.
HPU2 Journal of Sciences:
Natural Sciences and Technology
Journal homepage: https://sj.hpu2.edu.vn
Article type: Research article
Received date: 23-7-2024 ; Revised date: 03-10-2024 ; Accepted date: 22-10-2024
This is licensed under the CC BY-NC 4.0
20
Stepwise grafting polyethyleneimine onto silica surface
for Cu(II) removal
Mahmoud Elsayed Hafez
a
, Thanh-Thuy Mai Thi
b
, Van-Tuan Mai
c
, Thuy-Tien Do
d
, Thu-Huyen
Dang Thi
d
, Phuong-Uyen Pham
d
, Hai-Yen Vu Thi
d
, Quynh-Mai Le
d
, The-Duyen Nguyen
d
*
a
Beni-Suef University, Beni-Suef, Egypt
b
Institute of Chemistry, Vietnam Academy of Science and Technology, Hanoi, Vietnam
c
Electric Power University, Hanoi, Vietnam
d
Hanoi Pedagogical University 2, Vinh Phuc, Vietnam
Abstract
Polyethyleneimine (PEI) is a novel polymer that contains multiple amine groups that are suitable for
chelation with many heavy metal ions (HMI). Anchoring PEI onto the surface of a solid substrate has
been widely adopted to develop adsorbent materials with the hope of combining the HMI chelating
ability of PEI with the heterogeneity of the substrate. Herein, the preparation of PEI grafted SiO2
(PEI/SiO2) has been demonstrated by a stepwise method in which SiO2 nanoparticles were
functionalized with 3-glycidoxypropyltrimethoxysilane (KH560) followed by refluxing with PEI. The
method could provide PEI/SiO2 material with 23.4% of PEI by weight. Studying the adsorption
properties of PEI/SiO2 with Cu(II) revealed that the adsorption of Cu(II) ions on PEI/SiO2 followed
Langmuir and Dubinin-Radushkevich models and included both chemisorption and physisorption. The
adsorption capacity was about 25.3-27.3 mg/g. The stepwise method demonstrated in this study may be
adopted to fabricated PEI based materials for HMI removal.
Keywords: Polyethyleneimine, PEI, silica, clean water, adsorption
1. Introduction
Heavy metal ions (HMI), microorganisms, and organic compounds are the main pollutants in
water. At the same time, organic and microorganism pollutants are biodegradable and can be removed
by aerobic or anaerobic processes. Meanwhile, HMI are indestructible and have to be removed
artificially. The presence of HMI in water arises from both industry and human activities, such as
*
Corresponding author, E-mail: nguyentheduyen@hpu2.edu.vn
https://doi.org/10.56764/hpu2.jos.2024.3.3.20-26

HPU2. Nat. Sci. Tech. 2024, 3(3), 20-26
https://sj.hpu2.edu.vn 21
plating, metal smelting, mining, and tanning industries [1]. Due to the toxic and non-biodegradable
properties, the concentration of HMI has to be detected and controlled at a proper limit [2]. Copper is a
typical example that its concentration in water needs to be controlled below 3 mg/L, although it is an
essential element to the human body [3]. Today, there are four main strategies for HMI removal
including adsorption, membrane, chemical, electric, and photocatalytic methods. Each method has
distinct advantages and is used in different scenarios, depending on the targeted wastewater. Among the
available methods, adsorption is advanced by low-costs, technical maturity, and environmentally
friendly [1]. Adsorption removal of HMI is based on the physicochemical interactions between an
adsorbent and HMI which could involve ion exchange, electrostatic attraction, complexation, and
precipitation [4]. Therefore, adding functional groups that could form coordination linkages to HMI
onto the surface of activated carbon or silica is a significant strategy to increase the removal capacity of
the adsorbent with high efficiency [5], [6].
Silica is a conventional substrate that can be fabricated in different forms including nanoparticles
and porous materials. Because native silica has inactive Si–O–Si groups and relatively active Si–OH
groups on the surface the post-functionalization of silica relies on the reactions of the silanol groups.
Conventionally, alkoxylsilane containing the target functional group, e.g. H2N-R-Si(OCH3)3, is
refluxed with silica to perform a condensation reaction between the as-formed R-Si-OH and the surficial
Si-OH [7], [8], equation (1)
3 2 2 2
3 3
2 2 2 2
3
CH O Si R NH H O HO Si R NH
SiO OH HO Si R NH SiO O Si R NH
(1)
Practically, due to the surface hindrance, the density of grafted functional groups is relatively low
so the absorption of HMI onto the surface of adsorbent depends on the individual groups. Alternatively,
grafting polymer chains that involve dense functional groups onto silica has emerged as an effective
method to enhance the adsorption capacity of silica-based materials [6]. To this strategy,
polyethyleneimine (PEI) has been used widely because it contains multiple amine groups in repeating (-
NHx-CH2-CH2-) units that could chelate to various HMI [6], [9]–[12]. Herein, we have demonstrated
the preparation of PEI grafted silica (PEI/SiO2) via a stepwise method using 3-
glycidoxypropyltrimethoxysilane (KH560) as a surficial linker. Cu(II) was selected as a typical HMI to
evaluate the adsorption properties of PEI/SiO2.
The results revealed that the adsorption of Cu(II) onto PEI/SiO2 involved both chemical and
physical adsorption with an adsorption maximum of 27.2 mg/g according to the Langmuir adsorption
isotherm.
2. Experimental section
2.1. Chemicals
Chemicals including PEI (99%, MW = 600 Dalton, Aladdin Chemials), KH560 (97%, Aladdin
Chemicals), silica particles (SiO2, Macklin), copper sulfate pentahydrate (99.9%, Xilong), and HPLC
grade solvents were purchased and used without purifications.
2.2. The stepwise synthesis of PEI/SiO2
A three-neck flask containing 5 g of freshly oxidized SiO2, 150 ml toluene, and 36 mmol of KH560
was connected to a Schlenk line system and a temperature-controlled heating stirrer. Under Ar (99.98)
atmosphere, the mixture was refluxed for 24 hours. After that, the solid was filtrated and washed with

HPU2. Nat. Sci. Tech. 2024, 3(3), 20-26
https://sj.hpu2.edu.vn 22
ethanol to remove unreacted KH560. The solid was dried at 60oC to obtain KH560 grafted SiO2, which
was then added to a flask containing 100 ml methylenechloride and 1 g of PEI. The mixture was
refluxed for 6 hours, filtrated, and washed with ethanol to obtain PEI/SiO2.
2.3. Characterizations
Thermogravimetric analysis (TG) was conducted on a Thermo Plus EV02 (Rigaku, Japan) while an
FT/IR-4600 spectrometer (Jasco, Japan) was used to perform infrared spectra. A nova touch 4xl was
used to conduct the nitrogen adsorption – desorption isotherm for PEI/SiO2 at -196oC.
2.4. Batch adsorption
In each Erlenmeyer flask, 0.1 g of PEI/SiO2 and 50 ml of Cu(II) solution having a concentration
ranging from 10 to 90 mg/L was added, closed, and shaken at a speed of 140 cycles per minute for 6
hours. The mixture was filtered by a syringe filter having a pore size of 0.21 μm to remove the
adsorbent. The concentration of Cu(II) before (Co) and after adsorption (Ce) was determined by a UV-
Vis absorption method that was described by D. Guspita [13]. The absorbance of samples at 615 nm
(Abs) was carried out on a UV-2450 spectrometer (Shimadzu, Japan). The correlation between Abs and
Cu(II) concentration (C) was determined to be as in equation (2) with an R2= 0.9998:
1320.8 36.334
C Abs
(mg/L) (2)
Cu(II) adsorption quantity (qe) was determined by equation (3):
3
0
50 10
0.1
e
e
C C
q
(mg/g) (3)
The adsorption of Cu(II) on PEI/SiO2 was studied using different models including Langmuir
(equation 4), Freundlich (equation 5), and Dubinin-Radushkevich (equation 6) [14].
max max
1 1
e
e
e
CC
q q q K
(4)
1
ln ln ln
e e F
q C K
n
(5)
2
1
ln ln ; ln 1
e m
e
q q RT
C
(6)
In the above equations, qmax is the maximum adsorption capacity (mg/g); K is Langmuir isotherm
constant (L/mg); KF is Freundlich isotherm constant (mg/g); n is adsorption intensity; β is Dubinin-
Radushkevich isotherm constant (mol2/kJ2); R is the gas constant (J/molK); and T is the temperature (K).
3. Results and discussion
3.1. The structural properties of PEI/SiO2 material
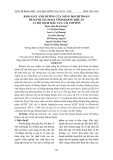
The stepwise synthesis of PEI/SiO2 is schematically illustrated in Figure 1. SiO2 was oxidized by a
piranha solution containing concentrated H2SO4 and H2O2 with a volumetric ratio of 7/3 at 80oC to
increase the density of surficial silanol groups. Upon refluxing in toluene, the methoxy (-OCH3) groups
of KH560 were slowly hydrolysis to form silanol groups which condensed with the surficial silanol to
graft KH560 onto the surface of SiO2. The bearing oxiranyl group of KH560 reacted with an amine
group of PEI to anchor PEI chains onto the surface of SiO2. The grafting of KH560 and PEI on the
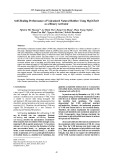
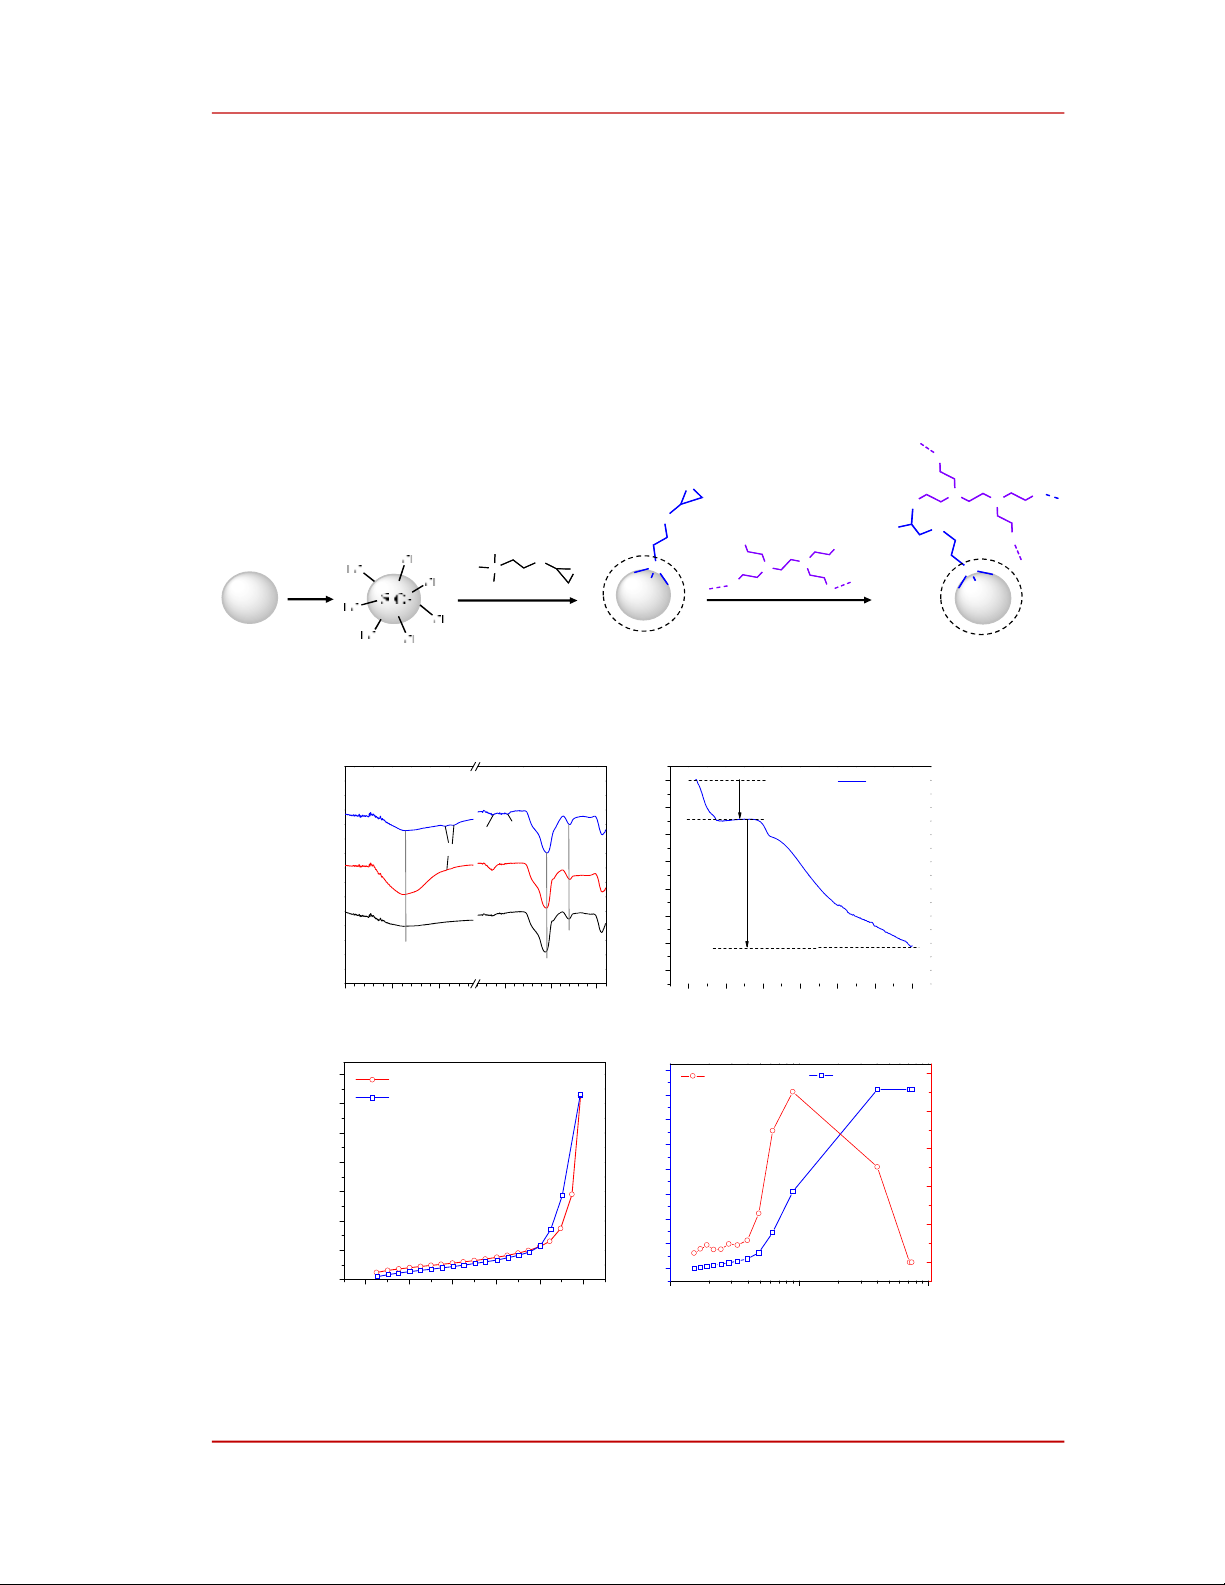
surface of SiO2 was validated by FTIR spectra shown in Figure 2a. Two characteristic absorption peaks
HPU2. Nat. Sci. Tech. 2024, 3(3), 20-26
https://sj.hpu2.edu.vn 23
of SiO2 are seen at 1060 and 800 cm-1 which are assigned to Si-O-Si anti-symmetric stretching and Si-O
bending vibrations, respectively [15]. Additionally, a broad absorption band around 3360 cm-1 is due to
the stretching of the O-H bond in adsorbed water or silanol groups. After KH560 grafting, an absorption
shoulder appeared at 2800-3000 cm-1, which is attributed to the stretching vibration of C-H bonds in the
methylene groups of the KH560. In the IR spectrum of KH560/SiO2 sample, the characteristic
absorption peaks originating from the C-O-C bond were not observed in the 1000-1200 cm-1- region
because they were likely overlapped by the vibrational absorption of Si-O-Si bonds. The existence of
PEI in PEI/SiO2 was confirmed by two characteristic peaks at 1640 and 1475 cm-1, which are attributed
to the bending vibration of N-H bonds in secondary amine groups and the stretching vibration of N-H
bonds in primary amine groups, respectively [16], [17].
Figure 1. The stepwise synthesis of PEI grafted silica (PEI/SiO2).
Figure 2. a) FTIR spectrum of PEI/SiO2 in comparison with SiO2 and KH560 grafted SiO2 (KH560/SiO2); b)
TGA curve of PEI/SiO2 in air conditions; c) nitrogen adsorption – desorption isotherm of PEI/SiO2; d) pore size
distribution of PEI/SiO2.
Si
MeO
MeO
OM e
O
O
SiO2
Si
O
O
SiO2
NH2
N
N
HN
NH
H2N
[O]
HN NN
NH
H
N
HN
SiO2
Si
O
HO
PEI/SiO
2
KH560 PEI
4000 3500 3000 1500 1000 500
C-H
Si-O
Si-O-Si
O-H
PEI/SiO2
Transmittance (a. u)
Wavenumber (cm-1)
SiO2
KH560/SiO2
-N(R)-H NH2
0 100 200 300 400 500 600
-35
-30
-25
-20
-15
-10
-5
0
Mass change (%)
Temperature (oC)
PEI/SiO2
7.2%
23.4%
1 10 100
0.0
0.1
0.2
0.3
0.4
0.5
0.6
0.7
0.8
Cumulative volume (cm
3
/g)
Pore size (nm)
B
0.0
0.2
0.4
0.6
0.8
1.0
F
dV(log r) (cm
3
/g)
0.0 0.2 0.4 0.6 0.8 1.0
0
5
10
15
20
25
30
35
Adsorbed volume (cm
3
/g)
Relative pressure
Adsorption
Desorption
a)b)
c)d)
HPU2. Nat. Sci. Tech. 2024, 3(3), 20-26
https://sj.hpu2.edu.vn 24
TGA curve of PEI/SiO2 conducted in air conditions, Figure 2b, involves two distinct mass-losing
regions. The first mass loss at 80oC could be attributed to the desorption of water. After this
temperature, PEI/SiO2 is stable to about 200oC. At higher temperatures, the mass decreased gradually
according to the thermal decomposition of organic components, which accounted for 23.4% by the mass
of PEI/SiO2. It is reasonable to take this value as the mass component of PEI in PEI/SiO2.
3.2. The adsorption of Cu(II) ions on PEI/SiO2 material
Nitrogen adsorption-desorption isotherm of PEI/SiO2 shown in Figure 2c could be classified as an
H3 type isotherm that has a narrow hysteresis loop and fast gradient changing in adsorption or
desorption at high relative pressure [18]. Based on the adsorption data, the Brunauer-Emmett-Teller
(BET) surface area of PEI/SiO2 was determined to be 6.9 m2/g, which is comparable to silica
nanoparticles [17]. Pore size distribution according to the Barrett-Joyner-Halenda (BJH) method of
PEI/SiO2 is shown in Figure 2d. The total volume of PEI/SiO2 was about 0.72 cm3/g. Pores in PEI/SiO2
were mesopores with a diameter ranging from 4 to 70 nm whereas pores of ~9 nm mostly accounted for
the volume of PEI/SiO2.
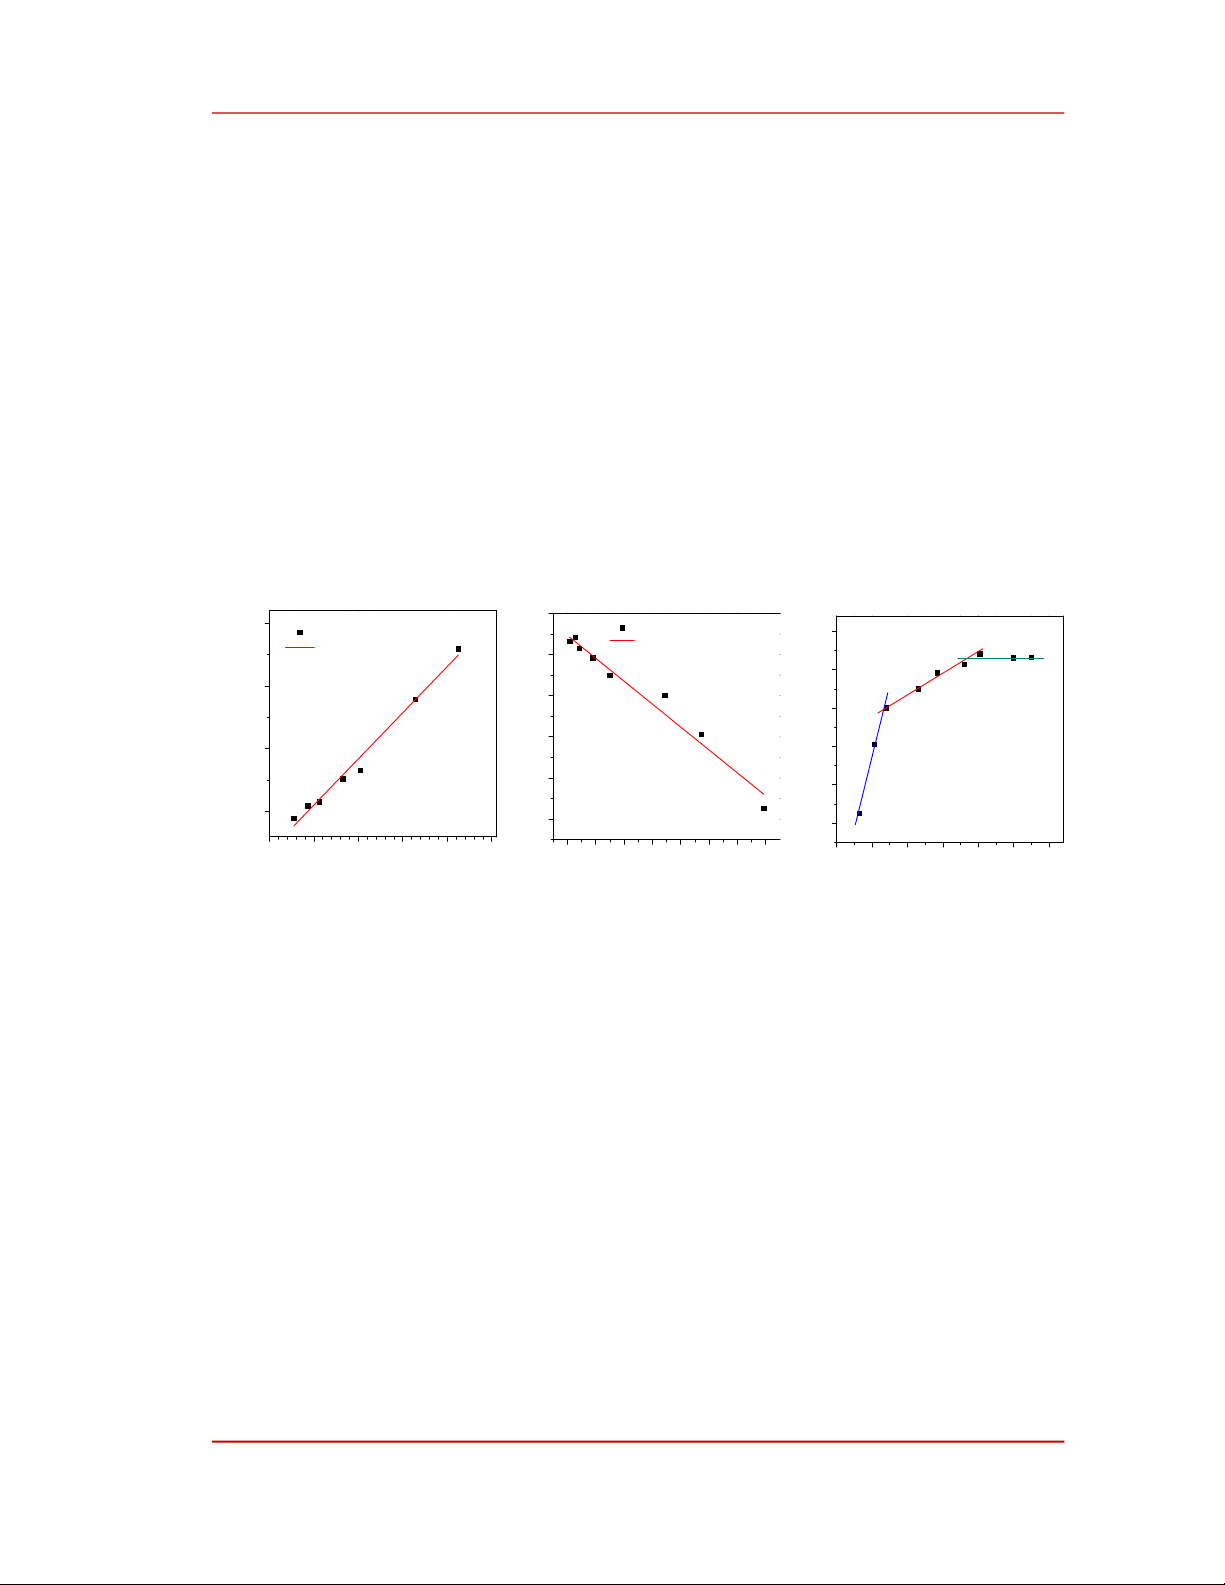
Figure 3. Fitting the Cu(II) adsorption of PEI/SiO2 using different models: a) Langmuir, b) Dubinin –
Radushkevich, and c) Freundlich.
To evaluate the HMI adsorption capability of the PEI/SiO2 we used Cu(II) as an HMI model and
the adsorption results were summarized in Figure 3. As shown in Figure 3a, the experiment data was
fairly fitted with the Langmuir adsorption isotherm according to equation (4) with an R2 value of 0.983.
Consequently, the maximum adsorption capacity was estimated to be 27.2 mg/g. Additionally, the
adsorption data was also well fitted with the Dubinin-Radushkevich model (equation 6) with an R2 value
of 0.967. The corresponding adsorption capacity was determined to be 25.3 mg/g, which is very close to
the Langmuir adsorption maximum. For comparison, the adsorption capacity of PEI/SiO2 in this study is
higher than that of 3-aminopropyltriethoxysilane (19.2 mg/g) [19] or triethylenetetramine (23.9 mg/g)
[20] functionalized mesoporous silica SBA-15) but it is relatively lower than PEI functionalized wheat
straw (48.6 mg/g) [21] or mesoporous silica KIT-6 (36.43 mg/g) [22]. As shown in Figure 3a the
adsorption data was well fitted by the Langmuir model revealing that the adsorption of Cu(II) ions onto
PEI/SiO2 was limited to a monolayer [23]. In addition, the adsorption energy was Gaussian distribution
because the adsorption data also followed the Dubinin-Radushkevich model [14]. To study the type of
adsorption, we plotted in Figure 3c the dependence of ln(qe) on ln(Ce) according to the Freundlich
model. In a low-concentration regime, the Freundlich adsorption intensity was 0.28, which is smaller
than 1, indicating that the adsorption of Cu(II) ions onto PEI/SiO2 was a chemisorption. When the
0 10 20 30 40 50
0.5
1.0
1.5
2.0
C
e
/q
e
(g/L)
Ce (mg/L)
Experiment
Langmuir Fit
1.0 1.5 2.0 2.5 3.0 3.5 4.0
1.0
1.5
2.0
2.5
3.0
3.5
n=1.90
Ln(q
e
)
Ln(C
e
)
n=0.28
0 50 100 150 200 250 300 350
1.0
1.5
2.0
2.5
3.0
3.5
Experiment
Dubinin - Radushkevich Fit
Ln(q
e
)
2
a)b)c)
n=ꚙ