Contents lists available at ScienceDirect
Measurement 63 (2015) 364–376
Measurement
j o u r n a l h o m e p a g e : w w w . e l s e v i e r . c o m / l o c a t e / m e a s u r e m e n t
Study of surface integrity and dimensional accuracy in EDM using Fuzzy TOPSIS and sensitivity analysis S. Dewangan a, S. Gangopadhyay a,⇑
, C.K. Biswas a,b
a Department of Mechanical Engineering, National Institute of Technology, Rourkela-769008, India b Department of Petroleum Engineering, Universiti Teknologi Petronas, Ipoh, Malaysia
a r t i c l e
i n f o
a b s t r a c t
Article history: Received 28 November 2013 Received in revised form 26 September 2014 Accepted 27 November 2014 Available online 8 December 2014
Surface integrity and dimensional accuracy remain critical concern in Electrical Discharge Machining (EDM). The current research work aims at investigating the influence of various EDM process parameters like pulse current (Ip), pulse-on time (Ton), tool work time (Tw) and tool lift time (Tup) on various aspects of surface integrity like white layer thickness (WLT), surface crack density (SCD) and surface roughness (SR). The dimensional accuracy, characterized by over cut (OC), has also been studied in the similar way. A response surface methodology (RSM) – based design of experiment has been considered for this purpose. The present study also recommends an optimal setting of EDM process parameters with an aim to improve surface integrity aspects after EDM of AISI P20 tool steel. This has been achieved by simultaneous optimization of multiple attributes (i.e. WLT, SCD, SR and OC) using Fuzzy-TOPSIS-based multi-criteria decision making (MCDM) approach. The optimal solution was obtained based on five decision makers’ preferences on the four responses (i.e. WLT, SCD, SR, and OC). From this analysis, an optimal condition of process parameters of Ip = 1 A, Ton = 10 ls, Tw = 0.2 s, and Tup = 1.5 s has been determined. Furthermore, sensi- tivity analysis was also carried out to study the sensitivity or robustness of five decision makers’ preference of optimal machining parameters. Form this study, decision makers’ preference for surface crack density has been found to be the most sensitive response and therefore should be chosen first and analyzed very carefully.
(cid:2) 2014 Elsevier Ltd. All rights reserved.
1. Introduction
Electrical Discharge Machining (EDM) is an erosion pro- cess, whereby rapidly recurring spark is generated between the tool and the workpiece in order to remove the materials form the later. EDM is the one of the most versatile non-conventional machining processes since the effectiveness of EDM process is absolutely independent of mechanical properties of the workpiece material. There- fore, very hard and difficult-to-cut materials can be effec- tively machined into desired complex shape, if the work
if
⇑ Corresponding author. Tel.: +91 9439096336; fax: +91 661 2472926.
piece materials are electrically conductive. During the pro- cess of EDM, material removal takes place due to melting and vaporization from the localized zone of the workpiece. Thermal energy liberated during EDM due to generation of spark leads to formation of thermally affected layers on the machined surface. The properties of such layers are differ- ent from parent workpiece material [1]. Therefore, surface integrity in EDM is an issue which requires considerable research attention. Surface integrity in EDM is usually characterized by surface roughness, formation of recast layer or white layer and surface cracks, residual stress and metallurgical modification of parent material [2]. the surface integrity is not adequately Therefore, addressed, the EDMed component would be more prone
Keywords: Electrical Discharge Machining (EDM) AISI P20 tool steel Fuzzy-TOPSIS Sensitivity analysis
E-mail address: soumya.mech@gmail.com (S. Gangopadhyay).
http://dx.doi.org/10.1016/j.measurement.2014.11.025 0263-2241/(cid:2) 2014 Elsevier Ltd. All rights reserved.
365 S. Dewangan et al. / Measurement 63 (2015) 364–376
Table 2 Linguistic variable for the important weight of each output. Fuzzy subset Respected fuzzy weight
thickness
(WLT) and induced residual
Tiny (T) Very Small (VS) Small (S) Medium (M) Large (L) Very Large (VL) Huge (H) (0.000, 0.000, 0.0769, 0.1538) (0.0769, 0.1538, 0.2307, 0.3076) (0.2307, 0.3076, 0.3845, 0.4612) (0.3845, 0.4614, 0.5383, 0.6152) (0.5383, 0.6152, 0.6921, 0.7690) (0.6921, 0.7690, 0.8459, 0.9228) (0.8459, 0.9228, 1.000, 1.000)
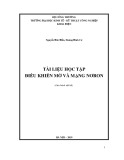
Fig. 1. Experimental setup.
stress layer appeared to increase at higher value of Ip and Ton. Cracks found on the transverse plane of machined component was quantified it terms of surface crack density (SCD) which increased at lower Ip and decreased as Ton was increased. Similar observation was also made on AISI 1045 steel [8] and AISI D2 tool steel [1]. Pradhan [9] deter- mined optimal setting of EDM parameters using RSM com- bined with grey relation analysis (GRA) as multi-objective optimization technique with an aim to achieve improved surface integrity during EDM of AISI D2 tool steel.
Table 1 Machining parameters and their levels. Parameters Symbol Level Unit 1 2 3
Control parameters Pulse current Pulse on Time Tool work time Tool lift time 3 80 0.6 0.75 5 150 1.0 1.5 A ls s s 1 10 0.2 0.0 Ip Ton Tw Tup
% V Kg f/cm2
lm
Another issue of concern during EDM is overcut phe- nomenon due to sparking from lateral surface or corner of bottom surface of the tool electrode. This leads to dimensional inaccuracy of EDMed component. Pulse cur- rent and pulse-on time have been found to be major parameters in influencing overcut. Increase in both Ip and Ton resulted in rise in overcut [10–12] owing to higher amount of discharge energy associated with them. How- ever, inverse relationship between Ip and overcut has also been reported during micro-EDM of Ti–6Al–4V alloy [13]. It is evident that EDM is always characterized by multi- ple output responses. Therefore, multi-objective optimiza- tion has become one of the major areas of research in EDM for determining optimal process condition. In the recent years, fuzzy logic-based multi-criteria decision making approaches have become very popular in optimization of different manufacturing processes. Sivapirakasam et al. [14] applied Fuzzy-TOPSIS technique to optimize various responses like process time, relative electrode wear rate, process energy and consumption of dielectric fluid during EDM of tool steel. Grey-fuzzy logic-based optimization technique was utilized to optimize MRR, TWR and SR dur- ing EDM of SKD11 alloy steel [15]. Puhan et al. [16] inte- grated principal component analysis (PCA) and fuzzy inference system coupled with Taguchi method to find out optimal condition of EDM parameters.
to failure during its intended application. Surface finish in EDM attracted significant research interest. Different mathematical models have been developed to correlate surface roughness with various EDM parameters like dis- charge current (Ip), pulse-on time (Ton), pulse-off time (Toff), duty cycle (Tau), polarity, input power, and thermal physical and electrical properties of workpiece and tool [3,4]. It has been found that process parameters like Ip and Ton played a major role in influencing EDMed surface roughness. For better surface finish, Ip and Ton should pref- erably be low [5,6]. Effect of EDM parameters on white layer and surface crack formation for D2 and H13 tool steel was studied by Lee and Tai [7]. It was observed that white
Fixed parameters Duty cycle Voltage Flashing pressure Sensitivity Inter electrode gap f V Fp SEN IEG 70 45 0.3 6 90
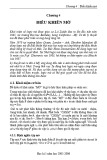
Fig. 2. Membership function of responses.
366 S. Dewangan et al. / Measurement 63 (2015) 364–376
Table 3 Decision maker for responses with aggregated fuzzy weight. Responses Decision Maker (DM) Aggregated fuzzy weight DM-1 DM-2 DM-3 DM-4 DM-5
WLT SCD SR OC VS S S M S VS M S S VS S S T S M VS S T M S (0.1538, 0.2153, 0.2922, 0.3691) (0.1230, 0.1846, 0.2615, 0.3348) (0.3230, 0.3999, 0.4768, 0.5537) (0.2307, 0.3076, 0.3845, 0.4612)
Table 4 Design matrix and the normalized response value. Run no. Pt type Ip OC (mm) WLT (lm) SCD (lm/lm2) SR (lm) Ton Tw Tup Rij WLT SCD SR OC
Fuzzy-TOPSIS-based multi criteria decision making (MCDM) approach by simultaneously considering surface integrity and dimensional accuracy aspects. Sensitivity analysis would also be carried out to study the sensitivity or robustness of five decision makers’ preference on opti- mal machining parameters.
2. Experimental details
2.1. Equipment, machining process and workpiece material
From the study of past literature, it is evident that some research work has been carried out to examine the influ- ence of EDM parameters on surface integrity aspects and overcut phenomenon separately. However, it is also very essential to determine optimal parametric combination in order to achieve maximum dimensional accuracy (i.e. min- imum overcut) as well as improved surface integrity. Although AISI P20 tool steel has wide industrial applica- tions in the manufacturing of plastic molds, frames for plastic pressure dies, hydro forming tools and many more, surface integrity and dimensional accuracy during EDM of AISI P20 tool steel has hardly been reported so far.
Therefore, the current study aims at investigating the influence of different EDM process parameters on different surface integrity aspects like surface roughness (SR), white layer thickness (WLT) and surface crack density (SCD) and dimensional accuracy in terms of overcut (OC) phenome- non. The second major objective of the current study is to determine optimal setting of EDM parameters using
The experiments were conducted on Electronica Elec- traplus PS 50ZNC die sinking EDM equipment. Commercial grade EDM oil (with specific gravity of 0.763 and flash point of 94 (cid:3)C) is used as dielectric fluid. The selected EDM parameters for the current research work include pulse current (Ip), pulse-on time (Ton), tool work time (Tw) and tool lift time (Tup). The sparking cycle consists of Tw and Tup. Tw is made up of multiple sparks each of which
1 2 3 4 5 6 7 8 9 10 11 12 13 14 15 16 17 18 19 20 21 22 23 24 25 26 27 28 29 30 0 1 1 1 1 0 1 1 1 1 (cid:2)1 (cid:2)1 (cid:2)1 (cid:2)1 0 (cid:2)1 (cid:2)1 0 (cid:2)1 (cid:2)1 1 1 1 0 1 0 1 1 1 1 2 3 1 1 3 2 3 1 3 1 2 2 2 3 2 2 1 2 2 2 1 3 3 2 1 2 1 3 3 1 2 3 1 3 1 2 3 3 1 1 2 2 1 2 2 3 2 2 2 2 3 3 1 2 1 2 3 3 1 1 2 3 3 3 3 2 1 1 1 1 2 1 2 2 2 2 2 2 2 3 3 3 3 2 3 2 1 1 1 1 2 3 3 1 1 2 1 3 3 1 1 2 2 2 2 2 2 2 3 2 3 1 3 2 1 2 1 3 1 3 12.452 28.379 3.755 7.479 15.633 15.209 26.882 10.271 17.469 6.954 18.243 13.717 7.299 23.166 14.66 17.302 4.972 17.993 16.305 13.001 9.595 29.842 16.553 16.435 3.146 18.275 9.267 24.615 19.594 6.684 0.0210 0.0078 0.0662 0.0703 0.0210 0.0066 0.0066 0.0605 0.0004 0.0202 0.0093 0.0110 0.0011 0.0009 0.0096 0.0186 0.0637 0.0134 0.0031 0.0156 0.0690 0.0092 0.0370 0.0027 0.0730 0.0071 0.0650 0.0069 0.0010 0.0230 4.86 7.13 1.73 1.73 3.40 5.20 5.86 2.00 3.66 2.06 4.66 5.26 3.20 6.06 5.06 5.06 2.89 5.40 4.66 4.80 1.73 5.53 3.26 4.80 1.66 4.96 1.86 6.60 3.00 1.82 0.1775 0.1950 0.0067 0.2100 0.0935 0.1684 0.1934 0.0180 0.2667 0.1017 0.1650 0.1450 0.1885 0.1650 0.1734 0.1955 0.0267 0.1409 0.1850 0.1217 0.1267 0.1934 0.1550 0.1617 0.1134 0.1610 0.1246 0.1950 0.1734 0.0417 0.138 0.316 0.042 0.083 0.174 0.169 0.299 0.114 0.194 0.077 0.203 0.153 0.081 0.258 0.163 0.192 0.055 0.200 0.181 0.145 0.107 0.332 0.184 0.183 0.035 0.203 0.103 0.274 0.218 0.074 0.111 0.041 0.349 0.371 0.111 0.035 0.035 0.319 0.002 0.107 0.049 0.058 0.006 0.005 0.051 0.098 0.336 0.071 0.016 0.082 0.364 0.049 0.195 0.014 0.385 0.037 0.343 0.036 0.005 0.121 0.206 0.302 0.073 0.073 0.144 0.220 0.248 0.085 0.155 0.087 0.197 0.223 0.135 0.256 0.214 0.214 0.122 0.228 0.197 0.203 0.073 0.234 0.138 0.203 0.070 0.210 0.079 0.279 0.127 0.077 0.205 0.226 0.008 0.243 0.108 0.195 0.224 0.021 0.309 0.118 0.191 0.168 0.218 0.191 0.201 0.226 0.031 0.163 0.214 0.141 0.147 0.224 0.179 0.187 0.131 0.186 0.144 0.226 0.201 0.048
367 S. Dewangan et al. / Measurement 63 (2015) 364–376
+ and Sj (cid:2)
tempered for better toughness. A commercially pure (99.9% purity) and cylindrical shaped copper with 12 mm diameter was used as tool electrode. The workpiece (+ve polarity) and tool ((cid:2)ve polarity) are shown in Fig. 1.
Table 5 Positive and negative ideal value. Sj
2.2. Measurement of responses
(0.0510, 0.0714, 0.0970, 0.1225) (0.0054, 0.0075, 0.0102, 0.0129)
(0.0473, 0.0711, 0.1007, 0.1303) (0.0003, 0.0004, 0.0006, 0.0007) WLT (cid:2) S1 + S1 SCD (cid:2) S2 + S2 SR
(cid:2) S3 + S3
(0.0974, 0.1206, 0.1438, 0.1670) (0.0227, 0.0281, 0.0335, 0.0389) OC
(cid:2) S4 + S4
In the current study, surface integrity was characterized by machined surface roughness, formation of white layer and surface cracks. While formation of white layer was investigated in the form of white layer thickness (WLT), surface cracks were quantified by means of surface crack density (SCD). Dimensional accuracy was characterized by overcut (OC) phenomenon. The measurement tech- niques for these output responses have been described briefly in the following section.
(0.0712, 0.0949, 0.1187, 0.1423) (0.0018, 0.0024, 0.0030, 0.0035)
2.2.1. White layer thickness
(cid:2)
+ di
For the measurement of recast or white layer, each specimen was sectioned vertically followed by polishing of each specimen with different grades of polishing papers with deceasing grit size. The polished surface was then etched with Nital solution to reveal microstructure along with white layer. Images were then captured on five differ- ent locations of each specimen using optical microscope (with model: SCD313 BPD and make: Radical Instrument) with a magnification of 400X. These images were then used to determine white layer thickness (WLT). Recast area was measured using software (PDF X-change viewer) and then the area was divided by total length of optical micro- scopic images to get the average height of white layer (i.e. WLT).
2.2.2. Surface crack density
In order to measure density of surface cracks, the top surface morphology of the EDMed surface was studied using scanning electron microscopy (SEM) at a magnifica- tion of 1000X. Randomly five sample areas were selected on each specimen and the length of cracks was measured using same software. The average crack length on each specimen was divided by area of each micrograph (10649.072 lm2) to measure the SCD. Similar measure- ment of SCD has been reported elsewhere [1,16].
Table 6 Closeness coefficient. Run no. di CCi
2.2.3. Surface roughness
The measurement of surface roughness (Ra value) of the EDMed surface was made with portable style type profi- lometer, Talysurf (Model: Taylor Hobson, Surtronic 3+), with cut-off length (Lc) of 0.8 mm, sample length (Ln) of 4 mm, and filter CR ISO.
2.2.4. Overcut
The over cut which is a measure of dimensional accu- racy is calculated by half the difference between the sizes of the cavity and the diameter of the tool after EDM pro- cess. The OC was measured on a tool makers microscope (Make: Carl Zeiss) with an accuracy of 0.001 mm using fol- lowing equation.
OC ¼
ð1Þ
Djt (cid:2) Dt 2
is associated with pulse-on time (Ton) and pulse-off time (Toff). Tw is followed by Tup i.e. duration for which the tool will be lifted up to facilitate effective flushing of dielectric fluid across the spark gap. Obviously, there is no sparking during the period of Tup. Flushing was intermittent and car- ried out through a solenoid valve that is synchronized with the lifting of tool. The values of control parameters along with their levels and those of fixed parameters are pro- vided in Table 1. The work piece material is AISI P20 tool steel with semi-circular shape (100 mm diameter and 10 mm thickness). The composition of AISI P20 tool steel is 0.4% C, 1% Mn, 0.4% Si, 1.2% Cr, 0.35% Mo, 0.25% Cu, 0.03% P, 0.03% S. The work piece is first heated to the tem- perature range of 843–898 (cid:3)C in a controlled furnace and held for half an hour. Then, it is oil quenched and later
0.3821 0.2268 0.5684 0.3755 0.4825 0.3968 0.2854 0.5260 0.3765 0.5767 0.3945 0.4109 0.5123 0.3364 0.3936 0.3384 0.5101 0.3783 0.4053 0.4387 0.4324 0.2735 0.3939 0.4190 0.4731 0.3922 0.4412 0.2699 0.4601 0.6275 0.3554 0.5107 0.1692 0.3620 0.2550 0.3407 0.4521 0.2116 0.3611 0.1608 0.3430 0.3266 0.2252 0.4011 0.3439 0.3991 0.2274 0.3592 0.3322 0.2988 0.3051 0.4640 0.3437 0.3185 0.2644 0.3453 0.2963 0.4676 0.2774 0.1100 0.5181 0.3075 0.7707 0.5092 0.6543 0.5380 0.3869 0.7132 0.5104 0.7819 0.5349 0.5572 0.6946 0.4561 0.5337 0.4588 0.6916 0.5130 0.5495 0.5948 0.5864 0.3709 0.5340 0.5681 0.6415 0.5317 0.5983 0.3660 0.6239 0.8508 1 2 3 4 5 6 7 8 9 10 11 12 13 14 15 16 17 18 19 20 21 22 23 24 25 26 27 28 29 30
368 S. Dewangan et al. / Measurement 63 (2015) 364–376
where Dj is the diameter of hole produced in the workpiece and Dt is the diameter of tool.
3. Analysis methods
3.1. Experimental design using RSM
environment. Fuzzy numbers such as triangular and trape- zoidal are primarily used for modeling the uncertainty under multiple engineering environments. While triangu- lar fuzzy numbers have been widely studied, trapezoidal numbers are sometimes preferred due to its computational simplicity [22]. The advantage is that trapezoidal fuzzy number of the form (a, b, c, d) presents most fundamental class of fuzzy numbers with linear membership function over the triangular fuzzy number (a, b, c) [22–24]. There- fore, this technique can be utilized for modeling linear uncertainty in various engineering applications [24–26]. The fuzzy linguistic variable is designated using trapezoi- dal fuzzy number that is shown in Fig. 2. According to this figure, the value of fuzzy weight numbers are denoted by linguistic values that are shown in Table 2. The similar type of calculation in triangular fuzzy number is described by Sivapirakasam et al. [14]. The five decision makers give their decisions of responses for each attribute weight in linguistic term that are shown in Table 3. The average fuzzy weight of the decision makers for each response parameter is shown in same table. The experimental design matrix along with normalized response (Rij) is shown in Table 4. Rij is the normalized value and this nor- malized matrix can be calculated by Eq. (2).
ð2Þ
Rij ¼
q
Response surface methodology (RSM) consists of math- ematical and statistical techniques that can be utilized for modeling and analysis of problems. This methodology is of particular interest when output is influenced by several variables and the goal is to determine relationship between the output and the input variables [17,18]. More- over, RSM helps to extract significant amount of informa- tion from small number of experimental runs. Since EDM involves a large number of process variables, in the current study, experiment has been designed using RSM using face-centered central composite design (CCD) with four variables (Ip, Ton, Tw and Tup). This scheme of design yields a total of 30 runs (as shown in Table 4) in three blocks, where the cardinal points used are sixteen cube points, eight axial points and six center points [19]. RSM-based design of experiment helps to conveniently study the influ- ence of different process parameters on output responses (i.e. SR, WLT, SCD and OC) in the form of mean effect of plot.
xij ffiffiffiffiffiffiffiffiffiffiffiffiffiffiffiP30 i¼1x2
ij
3.2. Fuzzy TOPSIS
where xij is the experimental value of the ith attribute of the jth experimental run.
After studying the influence of different machining parameters on surface integrity and dimensional accuracy aspects, further attempt would be made to determine an optimal setting of EDM parameters using technique for order of preference by similarity to ideal solution (TOPSIS) method. TOPSIS method for multiple attribute optimiza- tion was proposed by [20]. This method was used in fuzzy environments [21] and fits human thinking under actual
In the next step, all attributes of normalized matrix (Rij’s) are multiplied by fuzzy weights. Then resultant matrix is called weighted performance matrix which is denoted by Sij (for ith experimental run and jth response). Similar methodology was adopted by different researchers [14,27,28]. Now positive ideal solution (S+) and negative ideal solution are expressed by the following equations and their values are provided in Table 5.
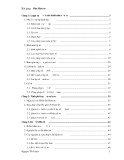
Fig. 3. Main effect plots for WLT.
(a) Run no.=4
(b) Run no.=8
(d) Run no.=13
(c) Run no.=12
(f) Run no.=29
(e) Run no.=21
369 S. Dewangan et al. / Measurement 63 (2015) 364–376
½minðSijÞ j 2 J0(cid:3);
(cid:4)
5 X
;
i ¼ 1; 2; . . . 30
ð5Þ
(cid:3) d Sij; Sþ j
dþ i ¼
Sþ ¼ ½maxðSijÞ(cid:3) j 2 J or j ¼ 1; 2; . . . 30 i ¼ 1; . . . ; 4
ð3Þ
i¼1
(cid:4)
5 X
;
i ¼ 1; 2; . . . 30
ð6Þ
d(cid:2) i ¼
(cid:3) d Sij; S(cid:2) j
ð4Þ
S(cid:2) ¼ ½minðSijÞ(cid:3) j 2 J or
½maxðSijÞ j 2 J0(cid:3)
i¼1
r
ð7Þ
dðx; yÞ ¼
ffiffiffiffiffiffiffiffiffiffiffiffiffiffiffiffiffiffiffiffiffiffiffiffiffiffiffiffiffiffiffiffiffiffiffiffiffiffiffiffiffiffiffiffiffiffiffiffiffiffiffiffiffiffiffiffiffiffiffiffiffiffiffiffiffi 1 ½ðx1 (cid:2) y1Þ2 þ (cid:4) (cid:4) (cid:4) þ ðx4 (cid:2) y4Þ2(cid:3) 4
where J is related to the higher-the-better performances characteristics and J0 is related to the lower-the better per- formances characteristics. In the present case, all the responses (i.e. SR, WLT, SCD and OC) are of lower-the-bet- ter type, hence J0 is considered. The attributes of Sij is the normalized positive trapezoidal fuzzy numbers, with the range of zero to one.
After calculating the Sij matrix, the next step is to find the distance of positive and negative ideal solutions by using Eqs. (5) and (6).
where d(x, y) is the distance between two fuzzy numbers. This distance of two trapezoidal number fuzzy number is calculated using Eq. (7), and value of d+ and d(cid:2) are shown in Table 6. After calculating the distance between the posi- tive and negative ideal solution, the final step is to deter- mine closeness coefficient (CCi), which is calculated by Eq. (8). This CCi value indicates the closeness of each the
Fig. 4. Representative optical microscopic images of WLT obtained with different parametric combinations.
370 S. Dewangan et al. / Measurement 63 (2015) 364–376
Table 7 Abridged ANOVA table. Source WLT SCD SR OC CCI F P F P F P F P F P
a Insignificant factor.
experimental value to the ideal solution that is shown in the same table.
ð8Þ
CCi ¼
d(cid:2) i i þ d(cid:2) dþ
i
4. Results and discussion
4.1. Influence of EDM parameters on different performance Measures
thickening of white layer since more energy associated with high pulse-on time causes increase in thickness of molten material which cannot be entirely removed by flushing [1]. Fig. 3 also clearly indicates WLT is hardly influ- enced by tool work time and tool lift time. Larger number of pulses per cycle associated with higher tool work time (Tw) might be compensated by flushing of dielectric since other parameters are held constant. WLT could not also be signif- icantly reduced by increasing tool lift time (Tup). Therefore, it can be concluded that Ip and Ton are more influencing parameters compared to Tw and Tup.
The effect of different EDM parameters like Ip, Ton, Tw and Tup has been studied on the following performance measures in EDM operation.
This observation has also been confirmed by ANOVA (ANalysis Of VAriance) results provided in Table 7. Due to space and easy comparison with other paucity of responses, an abridged ANOVA is shown including F and P values.
4.1.1. Influence of machining parameters on white layer thickness
4.1.2. Influence of machining parameters on surface crack density
During EDM, high temperature of the sparking zone causes the workpiece material to melt during pulse-on time. During pulse-off time, part of the molten metal gets re-solidified and quenched due to rapid cooling. Thermal residual stress produced due to such rapid heating and cooling cycle results in the formation of surface cracks in the recast layer [31,2]. Fig. 5 depicts SEM images of surface cracks formed on the surfaces machined with different that parametric combinations. Figure clearly shows increase in Ip leads to reduction in surface crack density (SCD). However, very high Ton (i.e. 150 ls) combined with lower value of Ip (i.e. 1 A) (Fig. 5e), results in severe forma- tion of cracks. The influence of various machining parame- ters like Ip, Ton, Tw and Tup on SCD is presented in Fig. 6 in the form of main effect plots. It is evident that the pulse cur- rent is inversely proportional to SCD. The decrease in SCD can be attributed to the fact that increase in Ip results in layer thickness of the molten material, which has a ten- dency to fill the voids thereby decreasing the chance of
During machining, the discharge energy develops very high temperature at the point of spark on workpiece sur- face resulting in melting and vaporization. Part of this mol- ten metal is flushed away and rest of molten material gets is re-solidified and quenched. This unflushed material heated up to molten state but is not removed. This re-solid- ified or recast layer is called white layer [1]. This layer is naturally very fine grained and hard, and may be alloyed with carbon leading to formation of cracks and other sur- face irregularities [29]. The influence of various machining parameters like pulse current (Ip), pulse on time (Ton), tool work time (Tw) and tool lift time (Tup) on white layer thick- ness (WLT) is shown through main effect plots in Fig. 3. This plot indicates that pulse current (Ip) is directly proportional to WLT because the more pulse current causes more dis- charge energy at the sparking zone and as a consequence, more recast layer is produced on the machined surface [30]. Increase in WLT with rise in Ip is also evident from Fig. 4 which depicts optical images of transverse plane of the machining zone. Pulse-on time (Ton) also results in
33.85 110.37 359.00 81.10 1.19 0.21 2.58 0.17 4.11 1.12 6.36 3.69 12.26 2.51 1.45 5.19 0.00 0.70 0.000 0.000 0.000 0.000 0.295a 0.652a 0.087 0.689a 0.064a 0.309a 0.025 0.023 0.004 0.137a 0.250a 0.040 0.971a 0.417a 22.14 54.93 182.92 5.22 31.57 0.00 12.61 24.78 0.01 0.71 0.49 6.63 14.46 2.88 0.68 21.32 0.39 0.08 0.000 0.000 0.000 0.040 0.000 0.959a 0.000 0.000 0.927a 0.414a 0.495a 0.002 0.002 0.114a 0.424a 0.000 0.544a 0.778a 99.19 251.59 792.27 203.98 1.44 8.69 49.09 13.22 36.79 0.07 5.44 30.98 168.55 1.45 10.20 0.10 5.54 0.06 0.000 0.000 0.000 0.000 0.252a 0.011 0.000 0.003 0.000 0.790 0.036 0.000 0.000 0.250a 0.007 0.754a 0.035 0.803a 18.56 31.22 106.16 13.86 0.28 4.56 9.03 23.96 8.32 3.47 2.28 16.47 2.63 21.14 42.68 26.93 4.92 0.49 0.000 0.000 0.000 0.003 0.607a 0.052a 0.001 0.000 0.013 0.085a 0.155a 0.000 0.129a 0.000 0.000 0.000 0.045 0.495a 32.29 98.95 210.26 175.24 9.89 0.42 1.80 0.73 0.99 0.92 0.57 8.18 4.06 10.95 31.73 0.97 1.30 0.04 0.000 0.000 0.000 0.000 0.008 0.527a 0.189a 0.409a 0.337a 0.354a 0.465a 0.001 0.065a 0.006 0.000 0.342a 0.274a 0.836a Regression Linear Ip Ton Tw Tup Square Ip ⁄ Ip Ton ⁄ Ton Tw ⁄ Tw Tup ⁄ Tup Interaction Ip ⁄ Ton Ip ⁄ Tw Ip ⁄ Tup Ton ⁄ Tw Ton ⁄ Tup Tw ⁄ Tup
(b) Run no.=4
(a) Run no.=1
(d) Run no.=8
(c) Run no.=7
(f) Run no.=27
(e) Run no.=21
371 S. Dewangan et al. / Measurement 63 (2015) 364–376
which can be explained by the formation of deeper cracks due to high spark energy associated with high pulse cur- rent. Similar observation was also noted when pulse-on duration was increased.
crack propagation. It is also evident that SCD first decreases with pulse on time (Ton) up to an optimum level and then starts increasing. Similar observation was also noted for Tw and Tup. At higher pulse-on time (150 ls), WLT is more and the induced stress gets more severe [2] resulting in increase in SCD. ANOVA results (Table 7) indicate that the tool lift time is not significant parameter as far as formation of surface cracks is concerned.
However, at high pulse-on duration of 150 ls, flattening of the craters might occur possibly due to expansion of plasma [30]. Similar trend was also observed for tool work time (Tw) and tool lift time (Tup) as evident from Fig. 7. Sur- face roughness increases with increase in Tup up to a max- imum level and then starts decreasing. This is because increase in Tup results in better flushing, which in turn yields good surface finish. Tw has no significant effect on the surface roughness, as substantiated by ANOVA (Table 7).
4.1.3. Influence of machining parameters on surface roughness Surface roughness in EDM is primarily characterized by the depth of the craters formed during sparking [32]. The influence of different process parameters on SR is shown in Fig. 7. It is evident that SR increases with pulse current
Fig. 5. Representative SEM images of SCD obtained with different parametric combinations.
372 S. Dewangan et al. / Measurement 63 (2015) 364–376
Fig. 6. Main effect plots for SCD.
4.1.4. Influence of machining parameters on overcut
during tool lift time, material removal from the lateral sur- face of the tool also reduces. This in turn improves dimen- sional accuracy in EDM.
4.2. Optimization of multiple attributes using Fuzzy-TOPSIS method
During EDM, minimum OC has always been the require- ment for better dimensional accuracy of EDMed product. The effect of the different EDM parameters on overcut is depicted in Fig. 8. It clearly shows that higher pulse current as well pulse duration have detrimental influence on the dimensional accuracy resulting in higher amount of over- cut. Since over cut is related to material removal due to sparking form the lateral surface of the tool electrode, higher Ip or Ton would enhance total discharge energy dur- ing EDM leading to increase in overcut. No clear trade was found between Tw and overcut. However, increase in Tup exhibits decrease in OC. Since no sparking takes place
After studying the influence of EDM parameters, attempt was further made for optimal selection of process parameters in order to achieve both improved surface integrity and dimensional accuracy using Fuzzy-TOPSIS- based MCDM methodology. After determining distances of positive and negative ideal solution, the closeness coef-
Fig. 7. Main effect plots for SR.
373 S. Dewangan et al. / Measurement 63 (2015) 364–376
Fig. 8. Main effect plots for OC.
Table 8 Response table for mean of CCi. Level Ip Ton Tw Tup
According to the main effect plots for closeness coefficient (shown in Fig. 9), the following factor settings, have been identified to be the best combination of process parame- ters: Ip = 1 A (level ‘1’), Ton = 10 ls (level ‘1’), Tw = 0.2 s (level ‘1’), and Tup = 1.5 s (level ‘3’). In the response table of mean of closeness coefficient in Table 8, the maximum and minimum value of closeness coefficient of EDM parameters are separated by 0.2148, 0.1961, 0.0466 and 0.0096 for Ip, Ton, Tw and Tup respectively. According to these values, the most influencing parameter is Ip followed by Ton, Tw and Tup, respectively.
ficient value for each experimental run is calculated and provided in Table 6 as per the methodology described in the earlier Section 3.2. The closeness coefficient values des- ignate higher-the-better quality characteristic. Therefore, run number 30 (with a value of CCi = 0.8508) has the best settings of machining parameters for the desirable output responses among all the 30 experimental runs.
In this section, five decision makers (DM) give their preferences on the responses (WLT, SCD, SR and OC) and the optimal results were computed based on their judg- ment. A sensitivity analysis is performed in the next sec- tion to find out how DMs’ change in their preferences would affect the optimal parametric combination.
4.3. Sensitivity analysis
The response table for CCi for each level of the machin- ing parameters with respective mean value of machining parameters is shown in Table 8. Since higher closeness coefficient value indicates the better performances, the machining parameters with the greatest closeness coefficient values would indicate optimal combination.
The exploration of sensitivity of DMs’ preferences on the optimal parameters will be of paramount interest. In
0.6826 0.5605 0.4678 0.2148 0.6736 0.5597 0.4775 0.1961 0.5987 0.5599 0.5521 0.0466 0.5669 0.5696 0.5765 0.0096 1 2 3 Max (cid:2) min
Fig. 9. Mean graph of CCI.
374 S. Dewangan et al. / Measurement 63 (2015) 364–376
Table 9 Sensitivity analysis result. S. no. Pre WLT Pre SCD Pre SR Pre OC Optimum level Ip Ton Tw Tup
1 2 3 4 5 6 7 8 9 10 11 12 13 14 15 16 17 18 19 20 21 22 23 24 25 26 27 28 29 30 31 32 33 34 35 36 37 38 39 40 41 42 43 44 45 46 47 48 49 50 51 52 53 54 T T T T T T T T T T T T T T T T T T VS VS VS VS VS VS VS VS VS VS VS VS VS VS VS VS VS VS S S S S S S S S S S S S S S S S S S T T T T T T VS VS VS VS VS VS S S S S S S T T T T T T VS VS VS VS VS VS S S S S S S T T T T T T VS VS VS VS VS VS S S S S S S S S S M M M S S S M M M S S S M M M S S S M M M S S S M M M S S S M M M S S S M M M S S S M M M S S S M M M VS S M VS S M VS S M VS S M VS S M VS S M VS S M VS S M VS S M VS S M VS S M VS S M VS S M VS S M VS S M VS S M VS S M VS S M 1 1 1 1 1 1 1 1 1 1 1 1 2 2 1 1 1 1 1 1 1 1 1 1 1 1 1 1 1 1 2 1 1 1 1 1 1 1 1 1 1 1 1 1 1 1 1 1 1 1 1 1 1 1 1 1 1 1 1 1 1 1 1 1 1 1 1 1 1 1 1 1 1 1 1 1 1 1 1 1 1 1 1 1 1 1 1 1 1 1 1 1 1 1 1 1 1 1 1 1 1 1 1 1 1 1 1 1 1 1 1 1 1 1 1 1 1 1 1 1 1 1 1 1 1 1 1 1 1 1 1 1 1 1 1 1 1 1 1 1 1 1 1 1 1 1 1 1 1 3 1 1 1 1 1 1 1 1 1 1 1 1 3 3 3 1 3 3 3 3 3 3 3 3 2 2 2 1 3 3 3 3 3 1 3 3 3 3 3 3 3 3 2 2 2 2 3 3 3 3 3 1 3 3 3 3 3 3 3 3 2 2 2 2 3 3
Table 10 ANOVA for CCI value of center point. Source DF Seq SS Adj MS F P % Contribution
1.91 649.05 34.12 38.61 0.150 0.000 0.000 0.000 0.23 77.49 2.04 4.61 0.000776 0.263681 0.01386 0.015687 0.000406 Pre-WLT Pre-SCD Pre-SR Pre-OC Error Total 2 2 1 2 262 269 0.001552 0.527361 0.01386 0.031373 0.10644 0.680586
and to finally recommend an optimal parametric combination for best performance in terms of sur- face integrity and dimensional accuracy during EDM of AISI P20 grade tool steel.
References
375 S. Dewangan et al. / Measurement 63 (2015) 364–376
[1] B. Bhattacharyya, S. Gangopadhyay, B.R. Sarkar, Modelling and analysis of EDMed job surface integrity, J. Mater. Process. Technol. 189 (2007) 169–177.
[2] S.H. Lee, X. Li, Study of the surface integrity of the machined workpiece in the EDM of tungsten carbide, J. Mater. Process. Technol. 139 (2003) 315–321.
[3] K.M. Tsai, P.J. Wang, Semi-empirical model of surface finish on electrical discharge machining, Int. J. Mach. Tools Manuf 41 (2001) 1455–1477.
[4] K. Chiang, Modeling and analysis of the effects of machining parameters on the performance characteristics in the EDM process of Al2O3+TiC mixed ceramic, Int. J. Adv. Manuf. Technol. 37 (2008) 523–533.
[5] Y.C. Lin, Y.F. Chen, C.T. Lin, H.J. Tzeng, Electrical Discharge Machining (EDM) characteristics associated with electrical discharge energy on machining of cemented tungsten carbide, Mater. Manuf. Processes 23 (2008) 391–399.
order to reduce the complexity of the test, it is assumed that all the five DMs’ give the same preferences for each of the response from among the fuzzy linguist values shown in Table 2. A full factorial experimental design is considered that yields a total of 54 combinations of possi- ble decision makers’ judgments which are summarized in Table 9. Fuzzy-TOPSIS technique is applied on all of these 54 combinations of DMs’ judgments and the optimal levels of Ip, Ton, Tw and Tup are obtained, which are shown in the same table. In Table 4, ‘0’ value in column ‘pt type’ indi- cates the central points. The responses WLT, SCD, SR and OC of these experimental runs are used to calculate close- ness coefficient values for all 54 combinations of decision makers’ judgments. The ANOVA of closeness coefficient values in central point is tabulated in Table 10, which con- firms that 77.49% contribution of closeness coefficient val- ues is due to the DMs’ preferences on SCD (Pre-SCD). The contributions of DMs’ preferences on other responses are 4.61%, 2.04% and 0.23% for overcut, surface roughness and white layer thickness, respectively. According to this result, for any change in Pre-SCD, the optimal solution is more vulnerable as compared to other decision makers’ preferences. Therefore, decision makers should choose the preferences of SCD very carefully.
5. Conclusions
[6] Sameh S. Habib, Study of the parameters in electrical discharge machining through response surface methodology approach, Appl. Math. Model. 33 (2009) 4397–4407.
[7] H.T. Lee, T.Y. Tai, Relationship between EDM parameters and surface crack formation, J. Mater. Process. Technol. 142 (2003) 676–683. [8] H. Lee, F. Hsu, T. Tai, Study of surface integrity using the small area EDM process with a copper–tungsten electrode, Mater. Sci. Eng. 364 (1–2) (2004) 346–356.
Int. [9] M.K. Pradhan, Estimating the effect of process parameters on surface integrity of EDMed AISI D2 tool steel by response surface methodology coupled with grey relational analysis, J. Adv. Manuf. Technol. (2013) 1–12.
The present study investigates the effect of different EDM process parameters on surface integrity and dimen- sional accuracy of AISI P20 grade tool steel and recommends an optimal parametric combination using Fuzzy-TOPSIS- based MCDM methodology. The following conclusions may be drawn from the current study:
(1) Both Ip and Ton are directly proportional to WLT. Tw
[10] S. Dhar, R. Purohit, N. Saini, A. Sharma, G.H. Kumarb, Mathematical modeling of electric discharge machining of cast Al–4Cu–6Si alloy– 10 wt.% SiCP composites, J. Mater. Process. Technol. 194 (2007) 24– 29.
and Tup have no significant influence on WLT.
[11] M.Y. Lin, C.C. Tsao, H.H. Huang, C.Y. Wu, C.Y. Hsu, Use of the grey- Taguchi method to optimise the micro-electrical discharge machining (micro-EDM) of Ti–6Al–4V alloy, Int. J. Comput. Integr. Manuf. (2014) 1–9.
[12] N. Natarajan, R.M. Arunachalam, R. Thanigaivelan, Experimental study and analysis of micro holes machining in EDM of SS 304, Int. J. Mach. Machinability Mater. 13 (2013) 1–16.
[13] A.P. Tiwary, B.B. Pradhan, B. Bhattacharyya, Study on the influence of micro-EDM process parameters during machining of Ti–6Al–4V superalloy, Int. J. Adv. Manuf. Technol. (2014).
[14] S.P. Sivapirakasam, J. Mathew, M. Surianarayanan, Multi attribute decision making for green electrical discharge machining, Expert Syst. Appl. 38 (2011) 8370–8374.
(2) The pulse current is inversely proportional to SCD. With increase in Tw, the SCD decreases up to an opti- mum level and then it starts increasing. Ton should also be selected so as to achieve minimum SCD. However, Tup has no significant effect on SCD. (3) SR initially increases with Tup up to a particular level then starts decreasing with further increase in Tup, whereas Tw has been found to be an insignificant parameter under the given operating condition. (4) Higher pulse current and pulse on time have detri- mental influence on the dimensional accuracy (OC). (5) The optimum setting of process parameters of Ip = 1 A, Ton = 10 ls, Tw = 0.2 s and Tup = 1.5 s based on the decision makers’ preferences on the four responses has been achieved.
[15] J.L. Lin, C.L. Lin, The use of the grey-fuzzy logic for the optimization of the manufacturing process, J. Manuf. Process Technol. 160 (2005) 9–14. [16] D. Puhan, S.S. Mahapatra, J. Sahu, L. Das, A hybrid approach for multi- response optimization of non-conventional machining on AlSiCp MMC, Meas.: J. Int. Meas. Confederation 46 (2013) 3581–3592. [17] S. Rajendran, K. Marimuthu, M. Sakthivel, Study of crack formation and re-solidified layer in EDM process on T90Mn2W50Cr45 tool steel, Mater. Manuf. Processes 28 (2013) 664–669. [18] D.C. Montgomery, Design and Analysis of Experiments, Wiley, New York, 2001.
(6) The decision makers’ preferences of SCD is most important and should be chosen first and very care- fully followed by the preferences of OC and SR, whereas preference of WLT has no consequence on the optimal values of the parameters.
[19] T. Rajmohan, K. Palanikumar, Application of the central composite design in optimization of machining parameters in drilling hybrid metal matrix composites, Meas.: J. Int. Meas. Confederation 46 (2013) 1470–1481. [20] C.L. Hwang, K. Yoon, Multiple Attribute Decision Making: Methods and Applications, Springer-Verlag, New York, 1981.
(7) Therefore, the Fuzzy-based TOPSIS has been found to be an effective technique for simultaneous optimiza- tion of multiple attributes among contradicting inter relationship between input and output parameters
[21] F. Uysal, O. Tosun, Fuzzy TOPSIS-based computerized maintenance management system selection, J. Manuf. Technol. Manage. 23 (2012) 212–228. [22] A. Kaufmann, M.M. Gupta, Introduction to Fuzzy Arithmetic: Theory and Applications, Van Nostand Reinhold, New York, 1991. [23] A. Bansal, Trapezoidal fuzzy numbers (a, b, c, d): arithmetic behavior, Int. J. Phys. Math. Sci. (2011) 39–44.
376 S. Dewangan et al. / Measurement 63 (2015) 364–376
[24] C. Samantra, S. Datta, S.S. Mahapatra, Risk assessment [29] H. Ramasawmy, L. Blunt, K. Rajurkar, Investigation of
in IT outsourcing using fuzzy decision-making approach: an Indian perspective, Expert Syst. Appl. 41 (8) (2014) 4010–4022. [25] F. Uysal, O. Tosun, the relationship between the white layer thickness and 3d surface texture parameters in the die sinking EDM process, Prec. Eng. 29 (2005) 479–490. Fuzzy TOPSIS-based on computerized J. Manuf. Technol. [30] A. Hascalik, U. Caydas, Electrical discharge machinings of titanium maintenance management system selection, Manage. 23 (2) (2012) 212–228. alloy (Ti–6Al–4V), Appl. Surf. Sci. 253 (2007) 9007–9016. [26] M. Santhi, R. Ravikumar, R.
[31] G.K.M. Rao, S. Satyanarayana, M. Praveen, Influence of machining parameters on Electric Discharge Machining of managing steels an experimental investigation, in: Proceedings of the World Congress on Engineering, vol. 2, 2008, pp. 2–4. Jeyapaul, Optimization of process parameters in electro chemical machining (ECM) using DFA-fuzzy set theory-TOPSIS for titanium alloy, Multidiscipline Model. Mater. Struct. 9 (2) (2013) 243–255.
[32] Y.H. Guu, H. Hocheng, C.Y. Chou, C.S. Deng, Effect of electrical discharge machining on surface characteristics and machining damage of AISI D2 tool steel, Mater. Sci. Eng. 358 (2003) 37–43. [27] E.A. Dadzie, S. Nabareseh, A.A. Dadzie, Z.K. Oplatkova, A fuzzy TOPSIS framework for selecting fragile states for support facility, Qual. & Quant. Int. J. Methodol. (2014), http://dx.doi.org/10.1007/s11135- 014-0062-3.
[28] S. Rouhani, M. Ghazanfari, M. Jafari, Evaluation model of business intelligence for enterprise systems using fuzzy TOPSIS, Expert Syst. Appl. 39 (3) (2012) 3764–3771.


%20--%3e%3cdefs%3e%3cstyle%3e%20.st0%20{%20fill:%20%23fff;%20}%20.st1%20{%20fill:%20%237800fa;%20}%20%3c/style%3e%3c/defs%3e%3cpath%20class='st1'%20d='M117.78,12.18H43.11c2.9,3.47,4.65,7.94,4.65,12.82,0,5.6-2.3,10.66-6.01,14.29h76.02l7.22-13.56-7.22-13.56Z'/%3e%3cg%3e%3cpath%20class='st0'%20d='M53.58,26.17h-.59v-1.46h.59v-4.96h2.83c1.78,0,2.67.94,2.67,2.82v5.76c0,1.87-.89,2.81-2.67,2.81h-2.83v-4.96ZM55.36,21.37v3.34h1.1v1.46h-1.1v3.34h1.01c.61,0,.91-.37.91-1.1v-5.93c0-.74-.3-1.1-.91-1.1h-1.01Z'/%3e%3cpath%20class='st0'%20d='M65.99,31.14h-1.8l-.31-2.07h-2.19l-.31,2.07h-1.64l1.82-11.39h2.62l1.82,11.39ZM65.28,18.04c-.25.46-.51.77-.75.94-.21.15-.47.22-.79.22-.26,0-.57-.07-.92-.22l-.38-.15c-.14-.05-.26-.07-.37-.07-.3,0-.53.18-.71.54l-.91-.68c.25-.46.51-.77.75-.94.21-.14.48-.21.79-.21.26,0,.57.07.92.21l.38.15c.14.05.26.07.37.07.3,0,.53-.18.71-.54l.91.68ZM61.91,27.52h1.73l-.87-5.76-.87,5.76Z'/%3e%3cpath%20class='st0'%20d='M74.53,26.89v1.52c0,1.91-.89,2.86-2.67,2.86s-2.67-.95-2.67-2.86v-5.93c0-1.91.89-2.86,2.67-2.86s2.67.95,2.67,2.86v1.11h-1.69v-1.22c0-.75-.31-1.12-.93-1.12s-.93.37-.93,1.12v6.15c0,.74.31,1.11.93,1.11s.93-.37.93-1.11v-1.63h1.69Z'/%3e%3cpath%20class='st0'%20d='M81.4,31.14h-1.8l-.31-2.07h-2.19l-.31,2.07h-1.64l1.82-11.39h2.62l1.82,11.39ZM75.9,19.2l1.52-1.91h1.71l1.51,1.91h-1.61l-.76-.95-.75.95h-1.61ZM77.32,27.52h1.73l-.87-5.76-.87,5.76ZM83.1,15.99l-1.76,1.91h-1.26l1.17-1.91h1.86Z'/%3e%3cpath%20class='st0'%20d='M84.86,19.75c1.78,0,2.67.94,2.67,2.82v1.48c0,1.87-.89,2.81-2.67,2.81h-.85v4.28h-1.79v-11.39h2.64ZM84.01,21.37v3.86h.85c.58,0,.87-.36.87-1.08v-1.71c0-.71-.29-1.07-.87-1.07h-.85Z'/%3e%3cpath%20class='st0'%20d='M93.51,19.75c1.78,0,2.67.94,2.67,2.82v1.48c0,1.87-.89,2.81-2.67,2.81h-.85v4.28h-1.79v-11.39h2.64ZM92.66,21.37v3.86h.85c.58,0,.87-.36.87-1.08v-1.71c0-.71-.29-1.07-.87-1.07h-.85Z'/%3e%3cpath%20class='st0'%20d='M98.8,31.14h-1.79v-11.39h1.79v4.88h2.03v-4.88h1.83v11.39h-1.83v-4.88h-2.03v4.88Z'/%3e%3cpath%20class='st0'%20d='M105.36,24.55h2.46v1.62h-2.46v3.34h3.09v1.63h-4.88v-11.39h4.88v1.63h-3.09v3.18ZM108.17,17.29l-1.76,1.91h-1.26l1.17-1.91h1.86Z'/%3e%3cpath%20class='st0'%20d='M112.2,19.75c1.78,0,2.67.94,2.67,2.82v1.48c0,1.87-.89,2.81-2.67,2.81h-.85v4.28h-1.79v-11.39h2.64ZM111.35,21.37v3.86h.85c.58,0,.87-.36.87-1.08v-1.71c0-.71-.29-1.07-.87-1.07h-.85Z'/%3e%3c/g%3e%3ccircle%20class='st1'%20cx='25'%20cy='25'%20r='20'/%3e%3cpath%20class='st0'%20d='M32.78,19.27c2.92,0,4.43,2.55,5.28,5.33l.71,2.17c.14.38-.33.75-.71.75h-5.61c.19-.33.24-.71.09-1.08l-.75-2.45c-.43-1.32-.99-2.64-1.79-3.77.75-.57,1.65-.94,2.78-.94h0ZM25,18.38c3.25,0,4.9,2.78,5.89,5.89l.76,2.45c.14.42-.33.8-.8.8h-11.69c-.42,0-.94-.38-.8-.8l.75-2.45c.99-3.11,2.64-5.89,5.89-5.89h0ZM25,11.35c1.74,0,3.11,1.37,3.11,3.11s-1.37,3.11-3.11,3.11-3.11-1.41-3.11-3.11,1.41-3.11,3.11-3.11h0ZM17.27,19.27c1.08,0,1.98.38,2.73.94-.8,1.13-1.37,2.45-1.74,3.77l-.8,2.45c-.14.38-.05.75.09,1.08h-5.56c-.42,0-.9-.38-.75-.75l.71-2.17c.9-2.78,2.41-5.33,5.33-5.33h0ZM17.27,12.91c1.51,0,2.78,1.27,2.78,2.83s-1.27,2.83-2.78,2.83-2.83-1.27-2.83-2.83,1.27-2.83,2.83-2.83h0ZM32.78,12.91c1.56,0,2.78,1.27,2.78,2.83s-1.23,2.83-2.78,2.83-2.83-1.27-2.83-2.83,1.27-2.83,2.83-2.83h0ZM27.07,28.56v.09c0,.57-.24,1.08-.61,1.46h0v.05c-.38.33-.9.57-1.46.57s-1.08-.24-1.46-.61h0c-.38-.38-.61-.9-.61-1.46v-.09h1.41v.09c0,.19.05.38.19.47v.05c.09.09.28.19.47.19s.38-.09.47-.19v-.05c.14-.09.24-.28.24-.47t-.05-.09h1.41ZM30.99,28.56v.09c0,1.65-.66,3.16-1.74,4.24-1.08,1.08-2.59,1.79-4.24,1.79s-3.16-.71-4.24-1.79l-.05-.05c-1.04-1.08-1.7-2.55-1.7-4.2v-.09h1.41v.09c0,1.27.47,2.4,1.27,3.25h.05c.85.85,1.98,1.37,3.25,1.37s2.4-.52,3.25-1.37c.85-.8,1.37-1.98,1.37-3.25v-.09h1.37ZM34.99,28.56v.09c0,2.78-1.13,5.28-2.92,7.07-1.79,1.79-4.29,2.92-7.07,2.92s-5.23-1.13-7.07-2.92c-1.79-1.79-2.92-4.29-2.92-7.07v-.09h1.41v.09c0,2.4.94,4.53,2.5,6.08,1.56,1.56,3.72,2.5,6.08,2.5s4.52-.94,6.08-2.5c1.56-1.56,2.5-3.68,2.5-6.08v-.09h1.41Z'/%3e%3c/svg%3e)