
BioMed Central
Page 1 of 9
(page number not for citation purposes)
Journal of Translational Medicine
Open Access
Methodology
Whole blood assessment of antigen specific cellular immune
response by real time quantitative PCR: a versatile monitoring and
discovery tool
Elke Schultz-Thater†1, Daniel M Frey†1, Daniela Margelli2, Nermin Raafat1,
Chantal Feder-Mengus1, Giulio C Spagnoli1 and Paul Zajac*1
Address: 1Institute of Surgical Research and Hospital Management, Dept. of Biomedicine, University Hospital of Basel, Basel, Switzerland and
2Personnel Medical Service, University Hospital of Basel, Basel, Switzerland
Email: Elke Schultz-Thater - eschultz@uhbs.ch; Daniel M Frey - dfrey@uhbs.ch; Daniela Margelli - dmargelli@uhbs.ch;
Nermin Raafat - nraafat@uhbs.ch; Chantal Feder-Mengus - cfeder@uhbs.ch; Giulio C Spagnoli - gspagnoli@uhbs.ch;
Paul Zajac* - pzajac@uhbs.ch
* Corresponding author †Equal contributors
Abstract
Background: Monitoring of cellular immune responses is indispensable in a number of clinical research areas, including
microbiology, virology, oncology and autoimmunity. Purification and culture of peripheral blood mononuclear cells and
rapid access to specialized equipment are usually required. We developed a whole blood (WB) technique monitoring
antigen specific cellular immune response in vaccinated or naturally sensitized individuals.
Methods: WB (300 μl) was incubated at 37°C with specific antigens, in the form of peptides or commercial vaccines for
5–16 hours. Following RNAlater addition to stabilize RNA, the mixture could be stored over one week at room
temperature or at 4°C. Total RNA was then extracted, reverse transcribed and amplified in quantitative real-time PCR
(qRT-PCR) assays with primers and probes specific for cytokine and/or chemokine genes.
Results: Spiking experiments demonstrated that this technique could detect antigen specific cytokine gene expression
from 50 cytotoxic T lymphocytes (CTL) diluted in 300 μl WB. Furthermore, the high sensitivity of this method could be
confirmed ex-vivo by the successful detection of CD8+ T cell responses against HCMV, EBV and influenza virus derived
HLA-A0201 restricted epitopes, which was significantly correlated with specific multimer staining. Importantly, a highly
significant (p = 0.000009) correlation between hepatitis B surface antigen (HBsAg) stimulated IL-2 gene expression, as
detectable in WB, and specific antibody titers was observed in donors vaccinated against hepatitis B virus (HBV) between
six months and twenty years before the tests. To identify additional markers of potential clinical relevance, expression
of chemokine genes was also evaluated. Indeed, HBsAg stimulated expression of MIP-1β (CCL4) gene was highly
significantly (p = 0.0006) correlated with specific antibody titers. Moreover, a longitudinal study on response to influenza
vaccine demonstrated a significant increase of antigen specific IFN-γ gene expression two weeks after immunization,
declining thereafter, whereas increased IL-2 gene expression was still detectable four months after vaccination.
Conclusion: This method, easily amenable to automation, might qualify as technology of choice for high throughput
screening of immune responses to large panels of antigens from cohorts of donors. Although analysis of cytokine gene
expression requires adequate laboratory infrastructure, initial antigen stimulation and storage of test probes can be
performed with minimal equipment and time requirements. This might prove important in "field" studies with difficult
access to laboratory facilities.
Published: 16 October 2008
Journal of Translational Medicine 2008, 6:58 doi:10.1186/1479-5876-6-58
Received: 15 September 2008
Accepted: 16 October 2008
This article is available from: http://www.translational-medicine.com/content/6/1/58
© 2008 Schultz-Thater et al; licensee BioMed Central Ltd.
This is an Open Access article distributed under the terms of the Creative Commons Attribution License (http://creativecommons.org/licenses/by/2.0),
which permits unrestricted use, distribution, and reproduction in any medium, provided the original work is properly cited.

Journal of Translational Medicine 2008, 6:58 http://www.translational-medicine.com/content/6/1/58
Page 2 of 9
(page number not for citation purposes)
Introduction
Routine monitoring of immune responses is usually lim-
ited to the detection of humoral responsiveness and the
capability of inducing adequate antibody titers represents
the gold standard for virtually all vaccines of current use
for the prevention of infectious diseases. In contrast, mon-
itoring of cellular immune responses following natural or
vaccine induced immunization is far less standardized. A
number of different techniques have been developed.
They include limiting dilution analysis of specific T cell
precursors, multimer staining of antigen specific T cells,
intracellular staining with cytokine specific antibodies,
ELISPOT or ELISA assays for antigen driven cytokine pro-
duction, antigen specific cytotoxicity and lymphoprolifer-
ation assays or quantitative real-time polymerase chain
reaction (qRT-PCR) for the detection of cytokine gene
expression [1-3].
These methods generally require gradient purification of
peripheral blood mononuclear cells (PBMC), culture for
different time periods in sterile CO2 incubators or rapid
access to highly specialized lab equipment and the use of
biologicals, e.g. FCS or human serum from different
sources. Furthermore, professional skills are also required.
As a result, monitoring of cellular immune responses is
difficult to standardize, and a high variability of results
from different laboratories is frequently observed, hinder-
ing the performance of multi centre comparative studies
[4-6].
Detection of cytokine (CK) gene expression by quantita-
tive RT-PCR (qRT-PCR) has been successfully applied to
the monitoring of immune responses in PBMC [7], in
tumor specimens [8,9] or to the identification of antigenic
epitopes [10-12].
We sought to further develop these methods into a simple
technique, easily amenable to automation, allowing accu-
rate monitoring of antigen specific cellular immune
responsiveness in whole blood (WB) of individuals
undergoing vaccinations or naturally sensitized to specific
antigens.
Similar techniques have been described in the past. How-
ever, most of these studies mainly focused on responsive-
ness to endotoxins, did not explore correlations with
protection against infectious challenges or adequate sur-
rogate markers, or addressed only a limited variety of
genes thereby potentially failing to identify specific gene
expression profiles associated with clinical manifestations
[13-16].
Here we show that WB monitoring of cellular immune
responses by qRT-PCR, represents a sensitive and specific
method capable of efficiently unravelling gene expression
profiles associated with vaccination or natural immuniza-
tion.
Materials and methods
Reagents
Antigenic peptides encompassing HLA-A*0201 restricted
human cytomegalovirus (HCMV) pp65495–503, Epstein-
Barr virus (EBV) BMLF-1259–267, EBV LMP-2426–434 and
influenza matrix (IM) 58–66 virus derived epitopes [17,18]
used to assess specific T cell responses were obtained from
Neosystem (Strasbourg, France). Corresponding peptide
specific PE labelled HLA-A*0201 multimers were from
Proimmune (Abingdon, UK). Hepatitis B virus (HBV)
(Engerix, Glaxo Smith Kline, Münchenbuchsee, Switzer-
land) and influenza (Inflexal, Berna Biotech, Bern, Swit-
zerland) commercial vaccine preparations were used to
monitor T-cell responses to vaccination.
Cell cultures
PBMC were isolated from peripheral blood of healthy
donors by Ficoll gradient centrifugation. When indicated,
specific PBMC subpopulations were purified by magnetic
cell separation (Miltenyi Biotech, Bergisch Gladbach, Ger-
many) according to producers' protocols. Cells were then
cultured in RPMI 1640 supplemented with 100 μg/ml
Kanamycin, 10 mM Hepes, 1 mM sodium pyruvate, 1 mM
Glutamax and non-essential amino acids (all from
GIBCO Paisley, Scotland), thereafter referred to as com-
plete medium, and 5% (v/v) human serum (Blutspend-
ezentrum, University Hospital Basel, Switzerland).
For proliferation assays cells were cultured in presence of
antigenic preparations or in the absence of stimuli in 96-
well flat bottom tissue culture plates (Becton Dickinson,
Le Pont de Claix, France), at 2 × 10⁵ cells per well, in trip-
licates. On day six, cultures were pulsed with 1 μCi per
well of [3H] thymidine (Amersham, Little Chalfont, UK)
for 18 h and then harvested. Tracer incorporation was
measured by β-counting.
Phenotypic characterization of cells
PBMC were phenotyped by staining with FITC- or PE-con-
jugated mouse monoclonal antibodies (mAb) to human
CD8 and CD4 (Becton Dickinson, San Diego, CA). CD8+
lymphocytes bearing specific T cell receptors were identi-
fied by staining with HLA-A0201 multimers containing
the desired peptide (Proimmune, Oxford, UK) [19]. Data
were reported as total number of MHC-multimer+/CD8+
cells obtained from volumes of WB equal to those utilized
for RNA extraction.
ELISA and Elispot assays
Antibody response to HBs Ag was evaluated by ELISA
assays (Architect System, Abbott, Sligo, Ireland) in sera
from naïve or vaccinated donors.

Journal of Translational Medicine 2008, 6:58 http://www.translational-medicine.com/content/6/1/58
Page 3 of 9
(page number not for citation purposes)
Elispot assays for the enumeration of IFN-γ or IL-2 pro-
ducing cells were performed as described previously [20].
WB monitoring of cellular immune responses
Appropriate concentrations of specific antigens, in the
form of peptides or commercial vaccine preparations (see
above) were added to 0.3 ml of heparinized peripheral
blood in 2 ml tubes. Samples were then centrifuged for
ten seconds in a minifuge to bring cells in close contact
and incubated for 5 h or 16 h, for peptide or vaccine prep-
arations, respectively, at 37°. Three volumes of RNAlater
(Ambion, no. AM7020, Austin TX) were then added to
stabilize RNA. The mixture was then either stored at differ-
ent temperatures (see below) or treated immediately for
RNA extraction. Sterile hoods, incubators or ≤-20°C
refrigerators were not required.
RNA processing and Real Time PCR
Total cellular RNA was extracted by using Ribo Pure-
Blood kit (Ambion Inc., no. AM1928, Austin, TX, USA)
and eluted in 75 μl of elution buffer. Reverse transcription
was done with 11 μl of total RNA by priming it with 1 μl
(200 μg/ml) of Oligo dT (Roche Diagnostics, Mannheim,
Germany) at 65°C for 10 minutes and quick chilling on
ice. This mixture was supplemented with 1 μl 10 mM
dNTP mix, 4 μl 5× first-strand buffer, 2 μl 0.1 M DTT and
1 μl (200 units) M-MLV reverse transcriptase (all by Invit-
rogen Ltd., Paisley, UK) and incubated at 37°C for 1 hour.
Two μl of cDNA were used for each PCR amplification by
"real time" technology (7300 Real Time PCR system,
Applied Biosystems, Rotkreuz, Switzerland) according to
manufacturer's recommendation in the presence of prim-
ers and probes specific for genes encoding IFN-γ, IL-2, IL-
6, IL-10 and TNF-α as already described [21] or MIP-1β
(Assays-on-demand, Applied Biosystems, Rotkreuz, Swit-
zerland). Antigen driven cytokine gene expression (tripli-
cate average) was normalized to the detection level of the
internal control β-actin house-keeping gene (Pre-devel-
oped assays, PDAR, Applied Biosystems, Rotkreuz, Swit-
zerland). Expression data were calculated, as referred to β-
actin gene expression in each sample, by using the
method [22]. For all genes analysed, dynamic linear range
of expression-detection was consistent at least up to Ct
value of 35 which was therefore considered as the cut-off
of significant values. A threshold of 2-fold increase in spe-
cific gene expression over control values was considered as
cut-off for the definition of positive responses.
Statistical analysis
All statistical analyses were performed by using SPSS 15.0
software for Windows (SPSS Inc. Chicago, IL, USA). Cor-
relations between the expression of different cytokine
genes and MHC-multimer staining or antibody titres were
evaluated by the Kendall's tau correlation coefficient (r)
and data were considered statistically significant in the
presence of p < 0.05. The significance of differential gene
expression in paired samples at different days after influ-
enza vaccination was analyzed by the non parametric Wil-
coxon signed rank test.
Results
Detection of antigen specific responses from limiting
numbers of T cells in whole blood by qRT-PCR
In initial studies we addressed the possibility of using
qRT-PCR technology coupled with RNA extraction from
WB samples to magnify antigen specific immune
responses from low numbers of T cells. To provide reliable
quantitative assessments, we spiked cells from a HLA-
A0201 restricted CD8+ CTL clone recognizing gp100280–
288 melanoma associated epitope in allogenic WB from a
HLA-A0201+ healthy donor and we incubated the mix-
ture for 5 hours in the presence of a 10 μg/ml final con-
centration of specific or control (Melan-A/MART-127–35)
peptide. Total cellular RNA was then extracted, reverse
transcribed and amplified in the presence of primers and
probes specific for β-actin house keeping gene and genes
encoding different cytokines.
Expression of IFN-γ and IL-2 genes was significantly (p <
0.05) increased in cultures performed in the presence of
specific, as compared to control peptides (figure 1, panel
A), thus ruling out the possibility of a prevailing allospe-
cific responsiveness from host WB T cells. In line with
these data, the extent of the increased expression of these
genes was strictly dependent on the number of spiked
gp100280–288 specific CTL. Most importantly, these results
indicate that specific antigen stimulation provides an acti-
vation signal detectable 4.8-fold and 2-fold above back-
ground for IFN-γ and IL-2, respectively, in WB down to a
minimum concentration ≤50 CTL in a 300 μl sample, thus
suggesting that qRT-PCR monitoring of antigen specific
immune responses in WB is feasible with a sensitivity
comparable to that of qRT-PCR monitoring in ficoll iso-
lated PBMC [8].
Stability of WB RNA preparations
RNA stability might of decisive relevance in the perform-
ance of qRT-PCR and critically affect immune monitoring
methods based on the analysis of cytokine gene expres-
sion, particularly in the context of field studies. Thus, we
stored antigen stimulated WB samples supplemented
with "RNAlater" at room temperature, at 4°C or at -20°C
for one week prior to gene expression analysis. We
2−ΔCt
Journal of Translational Medicine 2008, 6:58 http://www.translational-medicine.com/content/6/1/58
Page 4 of 9
(page number not for citation purposes)
observed that no significant variations of specific signal
were detectable in whole blood samples stored in the dif-
ferent conditions under investigation (data not shown).
Responsiveness to virus derived HLA-class I restricted
epitopes in whole blood
Based on these studies we attempted the detection of cel-
lular immune responses directed against HLA-class I
restricted epitopes derived from viral antigens. WB from
two different HLA-A0201+ seropositive donors was incu-
bated in the presence of HCMV pp65495–503, or EBV LMP-
2426–434 and EBV MLF-1259–267 virus derived epitopes at a
10 μg/ml final concentration. A well characterized HLA-
A0201 restricted influenza matrix (IM) 58–66 peptide was
also used at the same concentration. Moreover, in order to
further support the specificity of the WB assays, we com-
paratively evaluated in the same amounts of WB multimer
staining and cytokine gene expression upon peptide stim-
ulation.
Data from the two donors are reported in figure 2, panels
A and B. In both cases a highly significant correlation was
observed between the level of IL-2 and IFN-γ gene expres-
sion (r = 0.854 p = 0.001 and r = 0.629, p = 0.012 respec-
tively) induced by HCMV pp65495–503, EBV BMLF-1259–
267, EBV LMP-2426–434 and IM58–66 HLA-A0201 restricted
peptides and the numbers of CD8+ T cells stained by spe-
cific multimers in the same amount of WB (300 μl). Nota-
bly, a 4.5-fold increase in IFN-γ gene expression in IM58–
66 stimulated, as compared to control WB from the donor
depicted in figure 2 panel A, was observed in the presence
of only 41 CD8+ cells staining positive for the specific
multimer, thus confirming spiking data (see above).
WB monitoring of HBsAg specific cytokine gene expression
in healthy donors vaccinated against HBV
Data regarding cytokine gene expression in WB from spik-
ing experiments or upon stimulation with peptides
derived from viral antigens suggested the feasibility of a
sensitive WB monitoring of cellular immune responses.
Validation of this technology, however, requires compar-
ison with known clinical end points or accepted surrogate
markers. Thus, we comparatively analyzed cytokine gene
expression induced in WB by hepatitis B virus surface anti-
gen (HBsAg) and specific antibody titers in healthy
donors (n = 29 for a total of n = 39 samples) vaccinated
against Hepatitis B virus. Samples from naïve, seronega-
tive donors were also studied (n = 9). WB specimens were
cultured o/n in the presence of a commercial vaccine prep-
aration (see "materials and methods") diluted to a final
HBsAg concentration of 2 μg/ml. We found a highly sig-
nificant correlation between antigen stimulated expres-
sion of IL-2 gene as detectable by the WB assay and
specific antibody titers (r = 0.50, p = 0.000009) (figure 3,
panel A) in donors vaccinated between six months and
twenty years before the tests. Expression of IFN-γ and TNF-
α genes was also significantly, albeit not as strikingly, cor-
related with specific antibody titers (r = 0.29, p = 0.012
and r = 0.28 p = 0.013, respectively) (figure 3, panels B
and C). HBsAg induced IL-2 gene expression was also
highly significantly correlated with IFN-γ and TNF-α gene
expression (r = 0.50, p = 0.0000085 and r = 0.44 p =
0.0001, respectively). Confirmative tests performed on
purified T cells showed that the expression of these
cytokine genes was mainly due to CD4+ T cell activation
(data not shown).
In contrast, expression of IL-6 or IL-10 genes upon HBsAg
stimulation was modest and neither correlated with spe-
cific antibody titers nor with each other, nor with IL-2,
IFN-γ and TNF-α gene expression (figure 3, panels D and
E).
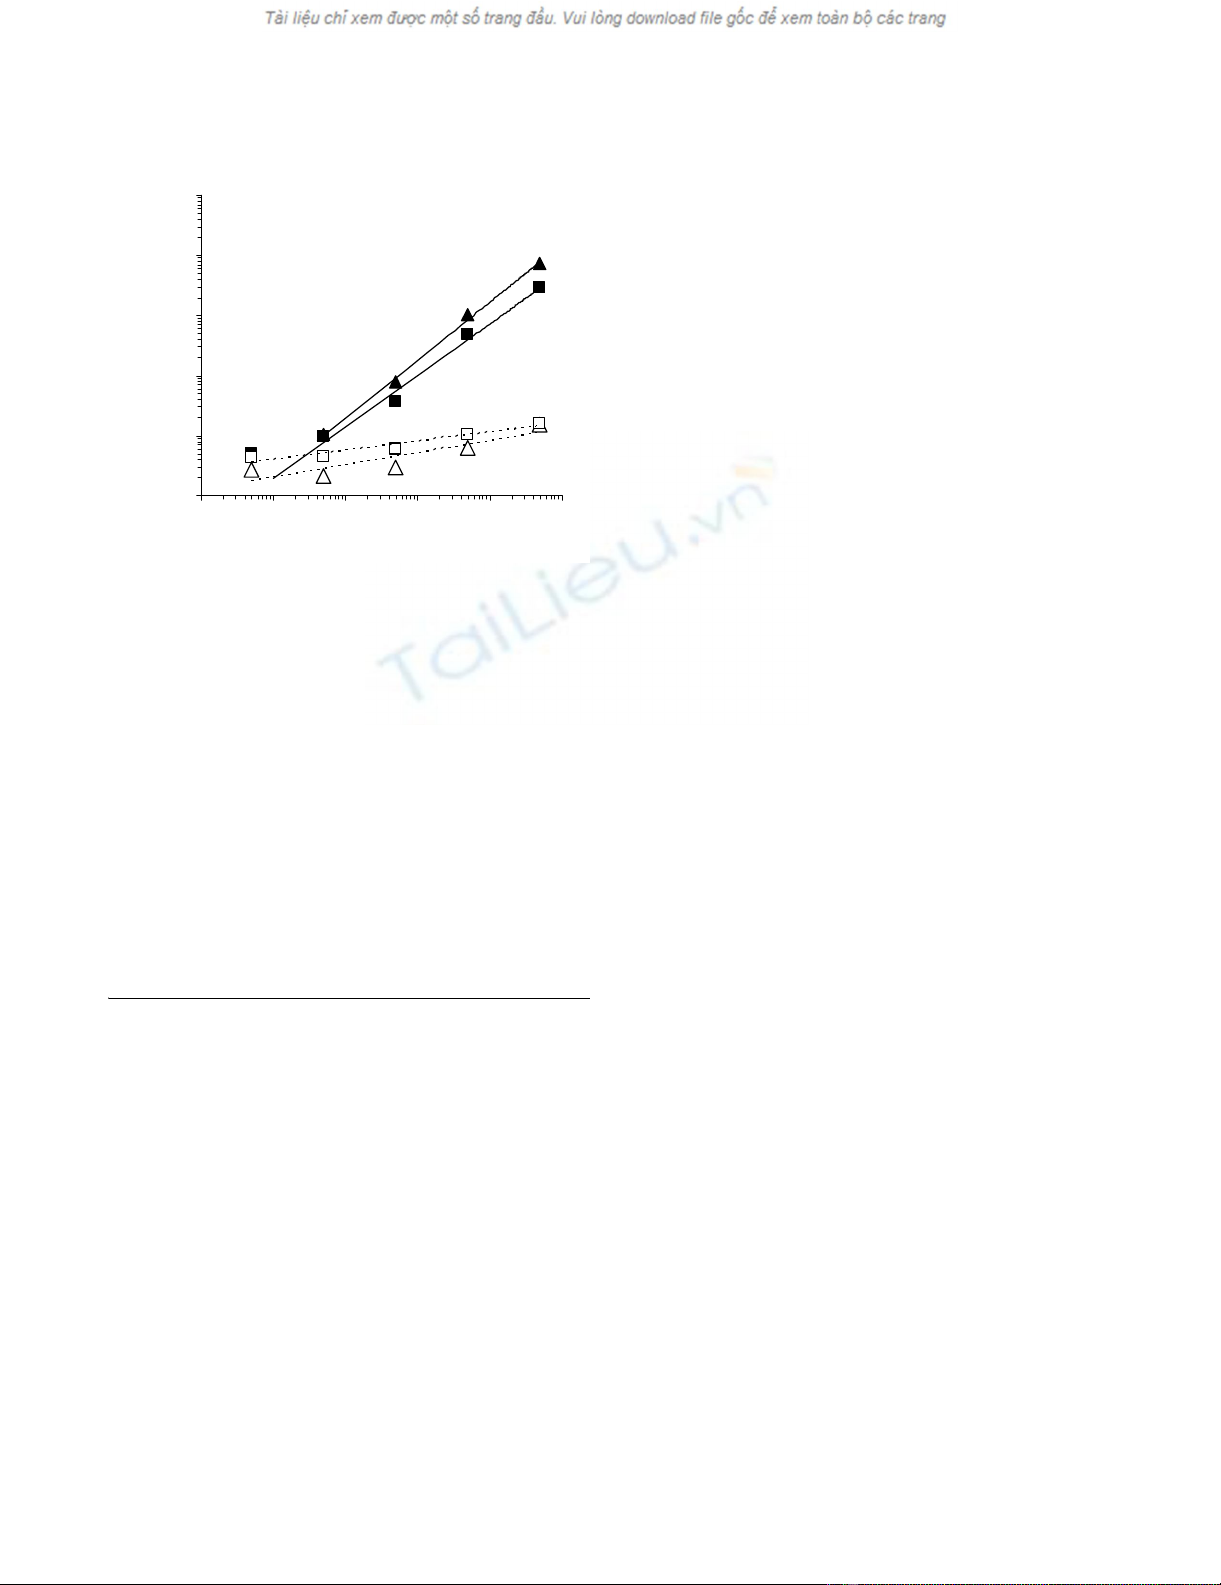
Monitoring of CTL spiking by WB technologyFigure 1
Monitoring of CTL spiking by WB technology. CD8+
T cells from an HLA-A0201 restricted gp100280–288 specific
CTL clone were added to 300 μl WB from an unrelated
donor in the presence of the specific or a control (Melan-A/
MART-127–35) peptide at a 10 μg/ml concentration. Following
5 hour incubation at 37°C, RNAlater was added to the sam-
ples and total cellular RNA was extracted, reverse tran-
scribed and amplified in the presence of primers and probes
specific for IL-2, IFN-γ. The expression of the indicated genes
from triplicate samples was analyzed by using, as reference,
the expression of β-actin house keeping gene (y axes). Stand-
ard deviations, never exceeding 5% of the reported values
were omitted. A threshold of 2-fold increase in specific gene
expression over control values was considered as cut-off for
the definition of positive responses. Numbers of CTL spiked
into WB were reported on x axes. (triangles = IFN-γ gene;
squares = IL-2 gene; filled symbols = specific peptide stimula-
tion; empty symbols = control peptide stimulation).
1.E-05
1.E-04
1.E-03
1.E-02
1.E-01
1.E+00
1 10 100 1000 10000 100000
number of gp100 specific CTL per sample
gene exp. relative to b-act.
Journal of Translational Medicine 2008, 6:58 http://www.translational-medicine.com/content/6/1/58
Page 5 of 9
(page number not for citation purposes)
Comparative assays were performed with samples from
two seropositive and one seronegative donor. HBsAg was
able to induce IL-2 and IFN-γ gene expression in cells from
seropositive donors only. However, no antigen specific
lymphoproliferation or cytokine production, as detecta-
ble by ELISPOT could be observed in any of the donors
under investigation, suggesting that WB qRT-PCR moni-
toring may be endowed with a higher sensitivity, as com-
pared to these techniques.
In an effort to identify additional markers of cellular
immune response in WB correlating with HBsAg specific
antibody titers, expression of chemokine genes was also
evaluated. We observed that HBsAg stimulated expression
of MIP-1β (CCL4) gene was highly significantly correlated
with specific antibody titers (r = 0.39, p = 0.0006) (figure
3, panel F). Notably, the extents of IL-2 and MIP-1β gene
expression induced by HBsAg were also highly signifi-
cantly correlated with each other (r = 0.48, p = 0.00002).
Furthermore, MIP-1β gene expression was highly signifi-
cantly correlated with IFN-γ and TNF-α gene expression as
well (r = 0.37, p = 0.001 and r = 0.48, p = 0.00001, respec-
tively, figure 3, panels G-I). Thus, WB monitoring tech-
nique helped defining a novel gene expression profile
significantly correlated with protection against HB infec-
tion.
WB monitoring of cellular immune response to influenza
vaccine: a longitudinal study
These results stemmed from experiments performed at
single time points. In order to further validate the WB pro-
tocol proposed here, a prospective longitudinal study
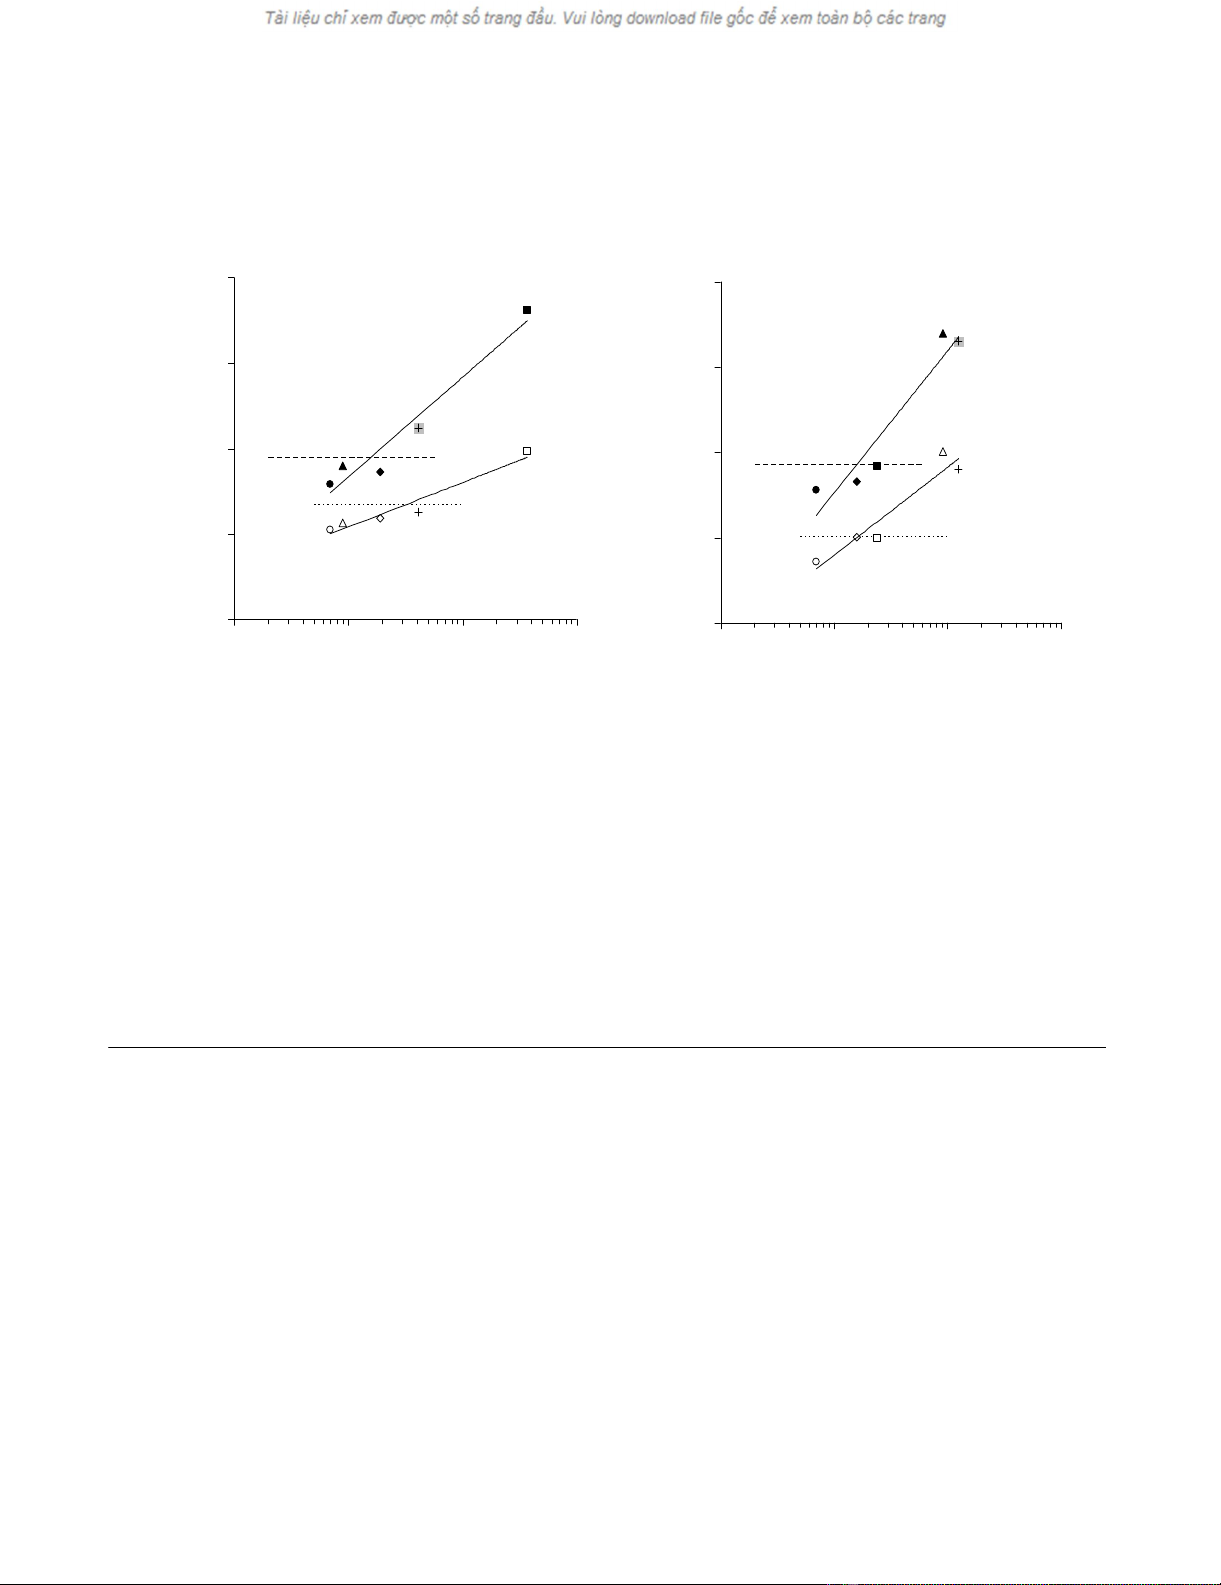
Cytokine gene expression induced by HCMV, EBV and influenza virus derived HLA class I restricted antigenic peptides in WB of healthy donorsFigure 2
Cytokine gene expression induced by HCMV, EBV and influenza virus derived HLA class I restricted antigenic
peptides in WB of healthy donors. WB from two HLA-A0201+ healthy donors (panels A and B), seropositive for HCMV
and EBV (300 μl) was incubated for 5 hours in the presence of HCMV pp65495–503 (triangles), EBV LMP-2426–434 (diamonds),
BMLF-1259–267 (squares) and IM58–66 virus (crosses) derived peptides at 10 μg/ml final concentration. Melanocyte derived
GP100280–288 peptide (circles) was used as negative control. RNAlater was then added and total cellular RNA was purified,
reverse transcribed and amplified in the presence of primers and probes specific for IFN-γ (full symbols) or IL-2 (empty sym-
bols). Specific gene expression was analyzed by using, as reference, the expression of β-actin house keeping gene (y axes). A
threshold of 2-fold increase in specific gene expression over control values was used as cut-off (dashed lines for IFN-γ and dot-
ted lines for IL-2 gene expression, respectively). WB specimens of the same size (300 μl) from the same donors were simulta-
neously stained with the corresponding multimers and the number of antigen specific T cells (x axes) was evaluated and
correlated with antigen driven gene expression data.
AB
R
2
= 0.95
R
2
= 0.94
1.E-06
1.E-05
1.E-04
1.E-03
1.E-02
1 10 100 1000
MHC multimer+ cell nb in 300ul WB
gene relative exp. in 300ul WB
R2= 0.91
R2 = 0.92
1.E-06
1.E-05
1.E-04
1.E-03
1.E-02
1 10 100 1000
MHC multimer+ cell nb in 300ul WB
gene relative exp in 300ul WB


![Vaccine và ứng dụng: Bài tiểu luận [chuẩn SEO]](https://cdn.tailieu.vn/images/document/thumbnail/2016/20160519/3008140018/135x160/652005293.jpg)


