
RESEARCH Open Access
Variability and seasonality of active transportation
in USA: evidence from the 2001 NHTS
Yong Yang
1*
, Ana V Diez Roux
1
and C Raymond Bingham
2
Abstract
Background: Active transportation including walking and bicycling is an important source of physical activity.
Promoting active transportation is a challenge for the fields of public health and transportation. Descriptive data on
the predictors of active transportation, including seasonal patterns in active transportation in the US as a whole, is
needed to inform interventions and policies.
Methods: This study analyzed monthly variation in active transportation for the US using National Household
Travel Survey 2001 data. For each age group of children, adolescents, adults and elderly, logistic regression models
were used to identify predictors of the odds of active transportation including gender, race/ethnicity, household
income level, geographical region, urbanization level, and month.
Results: The probability of engaging in active transportation was generally higher for children and adolescents
than for adults and the elderly. Active transportation was greater in the lower income groups (except in the
elderly), was lower in the South than in other regions of the US, and was greater in areas with higher urbanization.
The percentage of people using active transportation exhibited clear seasonal patterns: high during summer
months and low during winter months. Children and adolescents were more sensitive to seasonality than other
age groups. Women, non-Caucasians, persons with lower household income, who resided in the Midwest or
Northeast, and who lived in more urbanized areas had greater seasonal variation.
Conclusions: These descriptive results suggest that interventions and policies that target the promotion of active
transportation need to consider socio-demographic factors and seasonality.
Keywords: Active transportation, seasonality, NHTS
Introduction
Regular physical activity is important for the health and
well being of people of all ages [1]. It reduces the risk of
chronic diseases and enhances mental health [2]. Active
transportation including walking and bicycling is not
only an important source of physical activity, but also has
positive effects on climate change and air pollution [3].
Unfortunately, walking and bicycling for transportation
have declined over the past few decades in the US [4].
This trend has been observed in all age groups including
children and adolescents, adults and the elderly [5,6].
Promoting active transportation is a challenge for the
fields of public health and transportation [7].
Environmental effects on active transportation have
received increasing attention because of their relevance
for policy [8-12]. Most research has focused on the built
environment such as land use mix, land use density,
street connectivity, and access to transportation, while
the effects of seasonality and weather conditions, have
been relatively neglected [13]. Humans’physical activity
including active transportation, are undoubtedly influ-
enced by seasonality [14]. People have evolved different
physical activity patterns to cope with geographically
varying seasonal climate changes [15]. In the short-term,
changes in weather conditions such as the amount of
daylight, temperature and precipitation, can impede or
promote both the desire for and the feasibility of active
transportation [16].
Generally, levels of physical activity are higher in
spring and summer and lower in winter [13,15-19].
* Correspondence: yongyang@umich.edu
1
Department of Epidemiology, Center for Social Epidemiology and
Population Health, University of Michigan, Ann Arbor, Michigan, USA
Full list of author information is available at the end of the article
Yang et al.International Journal of Behavioral Nutrition and Physical Activity 2011, 8:96
http://www.ijbnpa.org/content/8/1/96
© 2011 Yang et al; licensee BioMed Central Ltd. This is an Open Access article distributed under the terms of the Creative Commons
Attribution License (http://creativecommons.org/licenses/by/2.0), which permits unrestricted use, distribution, and reproduction in
any medium, provided the original work is properly cited.

However this seasonal variation can be modified by geo-
graphic region as well as by demographic, cultural and
social factors. For example, in contrast to the northern
states, in southern states of the US where the summer
months are hot and humid, children have lower physical
activity in summer than in winter [20]. The impact of
season may also be modified by economic and cultural
factors: in developing countries opportunities for hunt-
ing and crop cultivation determine seasonal activity
while temperature and rainfall are key determinants in
developed countries [21]. Seasonal differences in physi-
cal activity may also vary by age and gender, for exam-
ple, in Norway children were found to be more sensitive
to seasonality than adolescents [22] while in the Nether-
lands seasonal variation was greater in males than in
females [23].
Although the impact of seasonal variations on physical
activity has been systematically reviewed [13,24], most stu-
dies included in these reviews were conducted in relatively
small regions with little climate variation. Only a small
number of studies covered the whole US [19,25-29], and
differences in patterns across population subgroups were
infrequently investigated [18]. Studies which cover a range
of climate regions and which investigate variations across
socio-demographic groups are needed to assist in the
design of more effective physical activity promotion
policies.
This study used 2001 data from a large national sample
to describe monthly variation in active transportation in
the US by selected demographic and regional factors
including age, gender, race/ethnicity, household income
level, geographical region and urbanization level. In addi-
tion to overall patterns, we examined seasonal variations
as well as the extent to which seasonal variations differed
by demographic, and regional characteristics that could
be useful in planning intervention.
Methods
The National Household Travel Survey (NHTS) 2001
http://nhts.ornl.gov/ is a survey of personal transporta-
tion in the US. The NHTS 2001 updated information
gathered in prior Nationwide Personal Transportation
Surveys (NPTS) conducted in 1969, 1977, 1983, 1990,
and 1995. This survey was conducted by computer-
aided telephone interviews from March 2001 through
July 2002. The target population was the US civilian
population from infancy through 88 years of age. List-
assisted random-digit dialing was used to sample house-
holds. The sampling frame consisted of all telephone
numbers in 100-banks of numbers in which there was at
least one listed residential number. Telephone numbers
were sorted according to geographic and population
variables and a systematic sample was then selected
from the sorted list. For the national sample, all
telephone numbers in the frame of 100-banks had an
equal probability of selection. The national sample was
increased in several add-on areas: New York State, Wis-
consin, Texas, Kentucky, Hawaii, Lancaster Pennsylva-
nia, Baltimore Maryland, Des Moines, Ohio and Oahu
Hawaii. An adult proxy was required for individuals less
than 14 years old, and 14- and 15-year-olds responded
for themselves if their parent approved. The survey
included 160,758 people (with written informed con-
sents) in 69,817 households and collected information
on 642,292 daily trips including the purpose, transporta-
tion mode, travel time, and time of the day. For this
study, data were weighted by personal weights (provided
by NHTS) to adjust for the selection probabilities at the
individual level.
In this study, active transportation was defined to
include walking and bicycling. The population was
grouped by age into four groups: children (5-10 years old,
denoted by C), adolescents (11-17 years old, denoted by T
for teenagers), adults (18-64 years old, denoted by A) and
elderly (65 years and above, denoted by E). Respondents
were also classified based on gender, race/ethnicity, house-
hold income level, region, and urbanization level. Race/
ethnicity was classified as White, Black, Asian and Hispa-
nic. Household income level was categorized as (1) less
than 20,000 dollars per year; (2) 20,000-40,000; (3) 40,000-
80,000; and (4) more than 80,000. The US was divided
into four sections based on US Census Region: West, Mid-
west, Northeast and South [30]. Level of urbanization was
classified as (1) rural; (2) town; (3) suburban; (4) second
city, and (5) urban based on population density [31]. Of
the 160,758 NHTS respondents, 30,536 were excluded
because they were of race/ethnic groups too small for reli-
able analysis (races/ethnicities other than the four men-
tioned above) or because they were missing data on key
variables (12,329 for household income level, 12,142 for
age, 9,384 race/ethnicity, 48 urbanization level and 21 gen-
der), leaving 130, 222 persons for analysis. Characteristics
of the population used for this study were described in
Table 1.
Four variables were used to describe the monthly var-
iation of transportation: (1) the mean number of all
trips per person per day; (2) the mean number of active
trips per person per day; (3) the percentage of people
who take at least one active trip in a day; and (4) the
percentage of active trips amongst all trips less than one
mile. Subsequent analyses focused on percentage of peo-
ple who take at least one active trip in a day (denoted
by PAT), because the percent of active trips among all
trips was unstable due to small numbers of daily trips
among some individuals. For each age group, logistic
regression was used to identify predictors of PAT
including gender, race/ethnicity, household income
level, region, urbanization level and travel month.
Yang et al.International Journal of Behavioral Nutrition and Physical Activity 2011, 8:96
http://www.ijbnpa.org/content/8/1/96
Page 2 of 9

Results
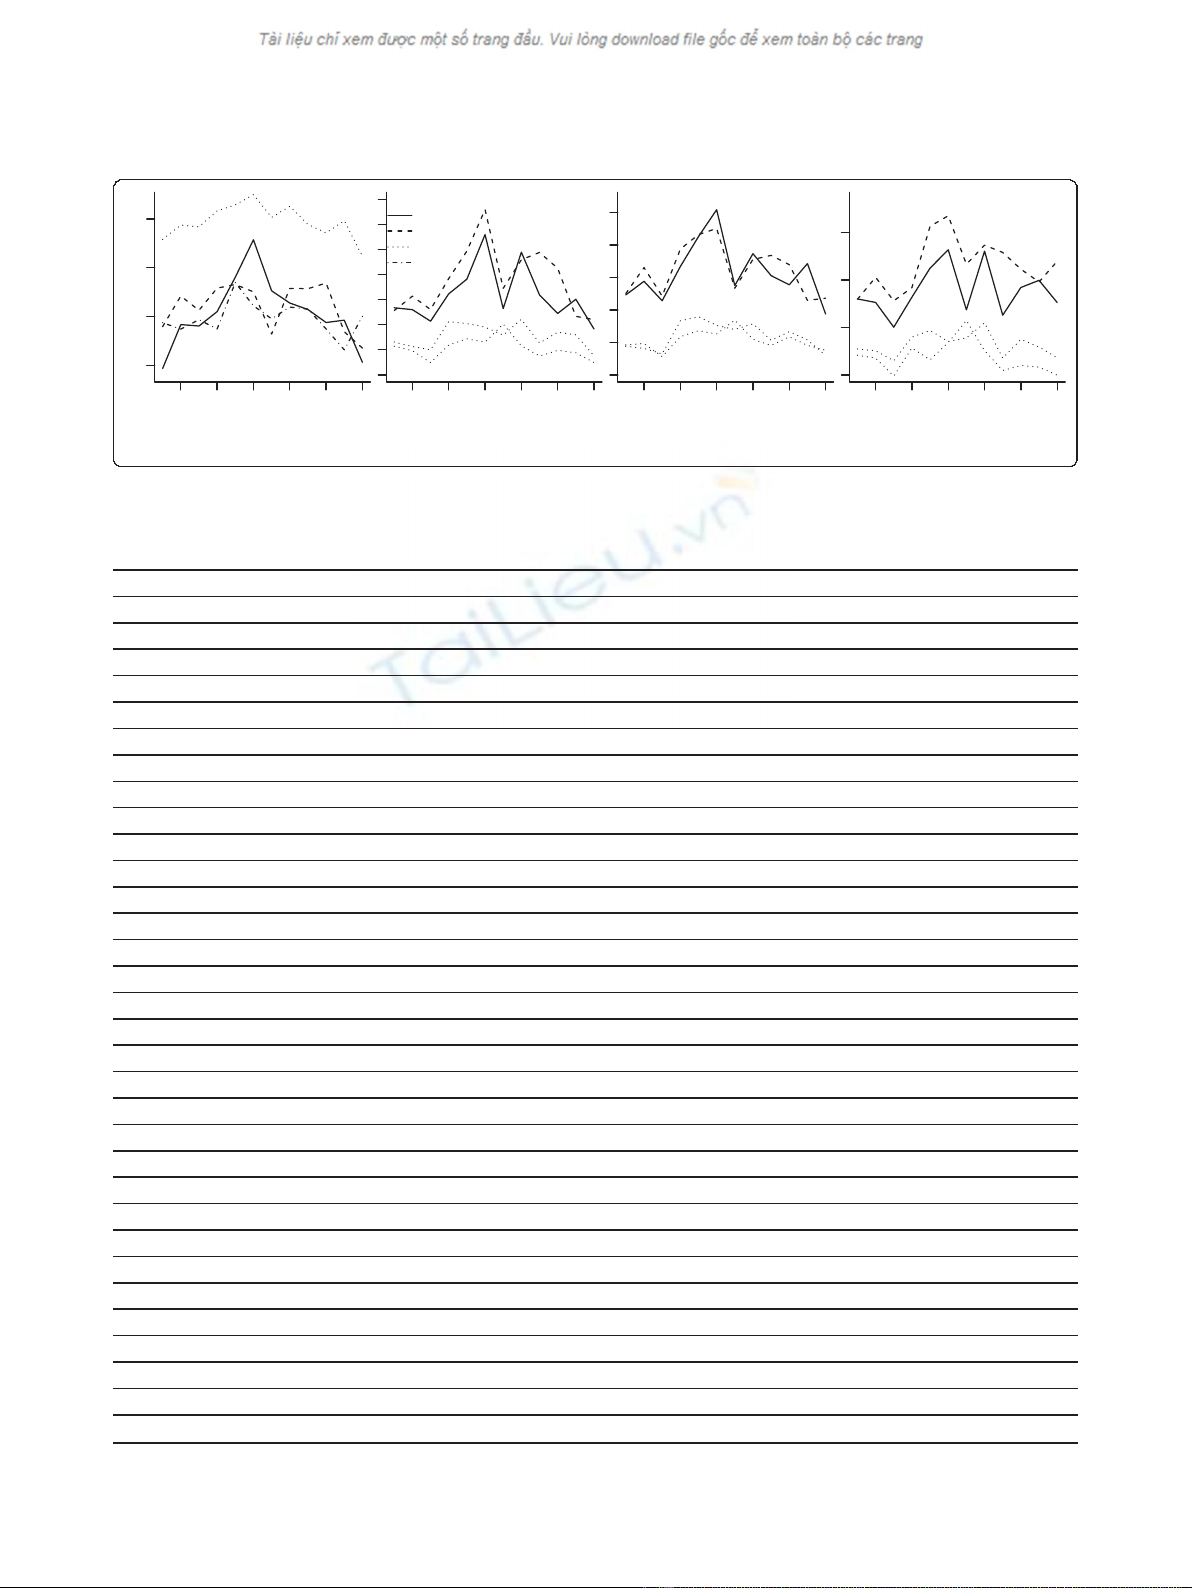
Figure 1 shows monthly variations in the four measures
of active transportation by age group. The mean number
of total trips was higher for adults than for the other
three age groups: on average in a year, each adult had
4.47 trips per day, while for the other three groups the
mean number of trips ranged between 3.49 and 3.60 per
day. Children had a clear seasonal pattern with a strong
peak in June, while the other three groups had a weaker
but still clear seasonal pattern with higher values in sum-
mer than winter generally, but with a trough in July.
In contrast to total trips, active trips were more fre-
quent in adolescents and children, and least frequent in
the adults and elderly. Adolescents had a mean of 0.58
active trips per day, 26% had at least one active trip per
day, and 43% of all trips less than one mile were active
trips; the elderly had a mean of 0.31 active trips per day,
15% had at least one active trip per day, and 24% of all
trips under a mile were active. Active trips also varied
seasonally: adolescents and children were most sensitive
to seasonality. Adolescents and children had two peak
periods: June and August/September. Less clear seasonal-
ity was observed in adults and the elderly.
Table 2 shows independent associations of each of the
socio-demographic predictors and month with the odds
of having at least one daily active trip for each age group.
Sample sizes were very large so confidence limits were
homogeneously tight and are not shown. Female adults
had higher odds of active trips than male adults, while
forallotherthreeagegroups,malesweremoreactive
Table 1 Characteristics of the study population
Age group 5-10 years 11-17 years 18-64 years 65+ years All
Percentage (%) 9.8 (n = 12723) 11.1 (n = 14442) 66.9 (n = 87053) 12.3 (n = 16004) 100
Sex Male 51.8 51.3 49.2 42.6 48.9
Female 48.2 48.7 50.8 57.4 51.1
Race/ethnicity White 70.9 73.9 77.1 86.2 77.3
Black 14.3 16.6 12.5 10.5 12.9
Asian 2.6 2.1 2.9 1.1 2.5
Hispanic 12.2 7.4 7.6 2.2 7.3
Household income level <20k 15.7 13.0 12.6 30.6 15.2
20-40 k 23.6 21.8 23.8 36.3 25.1
40-80 k 36.9 39.0 38.0 24.4 36.4
>80k 23.9 26.2 25.5 8.6 23.4
Region Northeast 18.1 18.9 18.7 20.7 18.9
Midwest 24.3 24.6 23.3 24.5 23.7
South 34.7 35.3 36.2 36.5 36.0
West 22.9 21.2 21.9 18.2 21.5
Urbanization level Rural 21.8 24.0 20.5 21.6 21.1
Town 24.1 23.2 22.3 21.3 22.4
Suburban 23.0 24.3 24.3 22.7 24.0
Second city 17.4 15.8 17.7 21.0 17.9
Urban 13.8 12.7 15.2 13.3 14.6
Month January 8.5 8.7 8.7 7.7 8.5
February 8.0 7.3 7.8 7.2 7.7
March 9.0 9.0 8.5 8.1 8.6
April 8.4 8.2 8.2 8.0 8.2
May 8.2 8.8 8.1 9.4 8.4
June 8.0 8.1 8.1 8.4 8.1
July 8.3 8.1 8.2 9.8 8.4
August 7.8 8.0 8.4 9.7 8.5
September 8.3 8.1 8.2 8.5 8.3
October 8.8 8.0 9.0 7.0 8.6
November 8.0 8.5 8.2 8.1 8.2
December 8.8 9.2 8.6 8.1 8.6
Yang et al.International Journal of Behavioral Nutrition and Physical Activity 2011, 8:96
http://www.ijbnpa.org/content/8/1/96
Page 3 of 9
24
68
1
0
12
3.0 3.5 4.0 4.5
1
24
68
1
0
12
0.2 0.4 0.6 0.8
2
C
T
A
E
24
68
1
0
12
0.10 0.20 0.30
3
24
68
1
0
12
0.2 0.3 0.4 0.5
4
Figure 1 Monthly variation of the four variables for age groups (1: total trip; 2: active trip; 3: percentage of people who took active
trip; 4: percentage of active trips amongst trips less than one mile). Note: for X axis, 1 means January, 2 means February, and so on.
Table 2 Odds ratios for the association between PAT and selected variables within four age groups
Age groups 5-10 years 11-17 years 18-64 years 65+ years
Number 11556 13651 84712 20303
Sex Male 1111
Female 0.84 0.87 1.12 0.87
Race/ethnicity White 1.00 1.00 1.00 1.00
Black 0.98 1.50 0.880 0.96
Asian 0.67 0.79 0.82 0.70
Hispanic 0.99 0.95 0.83 1.15
Household income level <20k 1.00 1.00 1.00 1.00
20-40 k 0.81 0.93 0.67 0.91
40-80 k 0.68 0.76 0.69 1.13
>80k 0.64 0.53 0.86 1.36
Region Northeast 1.00 1.00 1.00 1.00
Midwest 0.70 0.85 0.67 0.84
South 0.58 0.58 0.56 0.68
West 0.93 0.93 0.73 1.07
Urbanization level Rural 1.00 1.00 1.00 1.00
Town 1.46 1.16 1.24 1.00
Suburban 1.61 1.52 1.39 1.31
Second city 1.59 1.63 1.84 1.38
Urban 2.43 1.91 3.00 1.99
Month January 1.00 1.00 1.00 1.00
February 1.13 1.22 0.98 1.02
March 0.95 0.92 0.90 0.85
April 1.33 1.38 1.35 1.09
May 1.67 1.54 1.46 1.19
June 2.02 1.54 1.33 1.12
July 1.09 1.06 1.27 1.36
August 1.48 1.36 1.37 1.10
September 1.20 1.31 1.10 1.02
October 1.18 1.22 1.20 1.10
November 1.39 0.95 1.08 0.99
December 0.86 0.95 0.91 0.94
Note: confidence intervals are not shown because the very large sample size resulted in very tight confidence intervals.
Yang et al.International Journal of Behavioral Nutrition and Physical Activity 2011, 8:96
http://www.ijbnpa.org/content/8/1/96
Page 4 of 9

than females. Asians had lower odds of active transporta-
tion than other race/ethnic groups across all age groups.
Thelargestrace/ethnicdifferencewasobservedamong
adolescents, with black adolescents having more than
50% higher odds of active trips than other racial groups.
Among children and adolescents, higher income level
was associated with lower odds of active trips. In adults,
those with incomes less than 20 k per year had the
highest odds of active trips and those earning more than
80 k per year the second highest. Among the elderly all
income groups had similar odds of active transportation,
with those earning more than 80 k per year having the
highest odds of active trips. In terms of regional differ-
ences, all age groups displayed similar patterns, that is,
people living in the West and Northeast had the highest
odds of active trips, people in the South had the lowest
odds, and people in Midwest had intermediate levels.
People who lived in areas with higher levels of urbaniza-
tion had higher odds of active trips than those living in
less urban areas.
With respect to seasonal variation, children, adoles-
cents and adults had similar patterns: April, May and
June corresponded to peaks in active trips. For the
elderly, the peak time was July. Generally, younger peo-
ple were more sensitive to seasonal variation than older
people.
Seasonal differences in active trips by gender are
shown in Figure 2. Very similar patterns were observed
for males and females across age groups. For children
and adolescents, females were relatively less sensitive to
seasonality compared to males.
Figure 3 shows monthly PAT by race/ethnicity group.
White respondents had lower PAT and were less sensi-
tive to seasonality than other groups. Among Black,
Asian and Hispanic respondents, adolescents and chil-
dren were more sensitive to seasonality than adults and
the elderly with the possible exception of Asian children.
Figure 3 shows monthly PAT by household income
level. Generally, the lower the household income, the
higher PAT. Children and adolescents with higher
household income levels were more sensitive to
seasonality.
Figure 3 shows monthly variation in active trips in four
regions of US. The South had the lowest PAT amongst
all four age groups and was least sensitive to seasonality,
whereas seasonal changes were most pronounced in the
Midwest. In all regions, children and adolescents were
the most sensitive groups to seasonality.
Figure 4 shows monthly PAT for areas with different
levels of urbanization. PAT increased in a dose response
fashion from rural to urban area. Increases from rural to
urban areas were more pronounced for younger groups
than for the elderly. People in rural areas had the lowest
PAT with the smallest differences among age groups.
Discussion
This study examined factors associated with variations in
active transportation and seasonal patterns in active
transportation by different subgroups. The probability of
engaging in active transportation was generally higher for
children and adolescents than for adults and the elderly.
There were also important overall differences in active
transportation by income, region, and level of urbaniza-
tion: in general active transportation was greater in the
lower income groups (except in the elderly), was lower in
the South than in other regions of the US, and was
greater in areas with higher urbanization. There was also
evidence of important seasonality, with high percentages
24
68
1
0
12
0
.
10 0
.
20 0
.
30 0
.4
0
Male
24
68
1
0
12
Female
C
T
A
E
Figure 2 Gender difference of the monthly PAT.
Yang et al.International Journal of Behavioral Nutrition and Physical Activity 2011, 8:96
http://www.ijbnpa.org/content/8/1/96
Page 5 of 9


![Báo cáo seminar chuyên ngành Công nghệ hóa học và thực phẩm [Mới nhất]](https://cdn.tailieu.vn/images/document/thumbnail/2025/20250711/hienkelvinzoi@gmail.com/135x160/47051752458701.jpg)


