
BioMed Central
Page 1 of 9
(page number not for citation purposes)
BMC Plant Biology
Open Access
Methodology article
A high-density collection of EMS-induced mutations for TILLING in
Landsberg erecta genetic background of Arabidopsis
Beatriz Martín, Mercedes Ramiro, José M Martínez-Zapater and
Carlos Alonso-Blanco*
Address: Departamento de Genética Molecular de Plantas, Centro Nacional de Biotecnología (CNB), Consejo Superior de Investigaciones
Científicas (CSIC), Madrid-28049, Spain
Email: Beatriz Martín - bmartin@cnb.csic.es; Mercedes Ramiro - mramiro@cnb.csic.es; José M Martínez-Zapater - zapater@cnb.csic.es;
Carlos Alonso-Blanco* - calonso@cnb.csic.es
* Corresponding author
Abstract
Background: Arabidopsis thaliana is the main model species for plant molecular genetics studies
and world-wide efforts are devoted to identify the function of all its genes. To this end, reverse
genetics by TILLING (Targeting Induced Local Lesions IN Genomes) in a permanent collection of
chemically induced mutants is providing a unique resource in Columbia genetic background. In this
work, we aim to extend TILLING resources available in A. thaliana by developing a new population
of ethyl methanesulphonate (EMS) induced mutants in the second commonest reference strain. In
addition, we pursue to saturate the number of EMS induced mutations that can be tolerated by
viable and fertile plants.
Results: By mutagenizing with different EMS concentrations we have developed a permanent
collection of 3712 M2/M3 independent mutant lines in the reference strain Landsberg erecta (Ler) of
A. thaliana. This population has been named as the Arabidopsis TILLer collection. The frequency of
mutations per line was maximized by using M1 plants with low but sufficient seed fertility.
Application of TILLING to search for mutants in 14 genes identified 21 to 46 mutations per gene,
which correspond to a total of 450 mutations. Missense mutations were found for all genes while
truncations were selected for all except one. We estimated that, on average, these lines carry one
mutation every 89 kb, Ler population providing a total of more than five million induced mutations.
It is estimated that TILLer collection shows a two to three fold higher EMS mutation density per
individual than previously reported A. thaliana population.
Conclusions: Analysis of TILLer collection demonstrates its usefulness for large scale TILLING
reverse genetics in another reference genetic background of A. thaliana. Comparisons with
TILLING populations in other organisms indicate that this new A. thaliana collection carries the
highest chemically induced mutation density per individual known in diploid species.
Published: 14 December 2009
BMC Plant Biology 2009, 9:147 doi:10.1186/1471-2229-9-147
Received: 6 July 2009
Accepted: 14 December 2009
This article is available from: http://www.biomedcentral.com/1471-2229/9/147
© 2009 Martín et al; licensee BioMed Central Ltd.
This is an Open Access article distributed under the terms of the Creative Commons Attribution License (http://creativecommons.org/licenses/by/2.0),
which permits unrestricted use, distribution, and reproduction in any medium, provided the original work is properly cited.

BMC Plant Biology 2009, 9:147 http://www.biomedcentral.com/1471-2229/9/147
Page 2 of 9
(page number not for citation purposes)
Background
A major challenge in plant biology is the identification of
biological functions for all genes from the main model
plant species, Arabidopsis thaliana and rice. To this end, a
large number of genetics and genomics resources are
being developed in both model plants [1,2]. In particular,
collections of induced mutants that can be screened by
reverse genetics, such as T-DNA or transposon insertional
mutants [3-5] provide a unique resource for functional
studies. However, the mutational spectrum of insertional
mutagenesis with effect on gene function is mostly limited
to gene knock-out disruptions. Genes whose severe loss-
of-function is lethal or highly pleiotropic cannot be func-
tionally dissected with such mutants. In addition, the size
of saturated populations containing insertion mutants
randomly generated for most genes of an organism is
extremely high because each line carries only a rather
small number of mutations [6]. As a complementary
resource, chemically induced mutants have been shown
to provide an efficient alternative because each individual
line can bear single point missense and nonsense substi-
tutions in hundreds of genes [7]. Therefore, an allelic
series of induced mutations with different effects on gene
function can be easily isolated by screening a few thou-
sands mutagenized plants [6].
In the past few years, chemically induced mutants have
become a major resource for reverse genetics studies
thanks to the development of TILLING (Targeting
Induced Local Lesions IN Genomes) [8]. TILLING enables
the reverse selection of single point mutations by cleavage
of mismatches in heteroduplex DNA with the endonucle-
ase CEL I. This powerful strategy was first applied in an A.
thaliana mutant collection induced with ethyl meth-
anesulphonate (EMS) [9,10] in the commonest genetic
background Columbia (Col) whose genome sequence
had been first completed [11]. Since then, TILLING collec-
tions of EMS induced mutants have been developed in a
large number of plant species including rice, maize, bar-
ley, sorghum, wheat, Brassica napus, B. oleracea and Medi-
cago truncatula, as well as model animals like Drosophila
and Caenorhabditis elegans [12-21]. In most of these EMS
mutant collections, reference genetic backgrounds of wide
and general interest are used. However, given the limita-
tions of having mutations in a single genetic background,
new populations of chemically induced mutants for TILL-
ING analyses are currently being developed in other refer-
ence strains of several species like rice or soybean [22,23].
In addition, the quality of TILLING mutant populations is
determined by the density of mutations per individual,
since this limits the size of allelic series than can be iso-
lated for each gene and the size of a saturated genome
population. For this reason, other TILLING populations
have been developed in rice, barley, soybean or M. trunca-
tula, aiming to increase the amount of mutations per line
by either using different mutagens like sodium azide and
N-methyl-N-nitrosourea or increasing the mutagen dose
[12,22-25].
In A. thaliana, several reference genetic backgrounds are
widely used such as Col or Landsberg erecta (Ler). The lat-
ter is the second most commonly studied strain because
many mutants have been classically isolated in it and a
large portion of its genome sequence was available soon
after Col sequence [26]. In this work we have developed a
new collection of A. thaliana EMS induced mutants for
TILLING reverse genetics, aiming at two major objectives.
First, to extend TILLING resources in A. thaliana by using
Ler reference genetic background, for which reverse
genetic tools are rather limited. Second, to enrich the
number of independent mutations available in this collec-
tion as much as possible by increasing the density of
mutations per line. TILLING evaluation of this population
for several gene fragments indicates that it carries the larg-
est density of chemically induced mutations reported in
diploid organisms, hence demonstrating its usefulness for
reverse selection of mutants.
Results
Generation of a permanent collection of highly EMS-
mutagenized lines in Arabidopsis
To obtain a new population of chemically induced
mutant lines useful for reverse genetic studies in Arabidop-
sis thaliana, seeds of the Landsberg erecta (Ler) glabrous1-1
genotype were mutagenized with EMS at concentrations
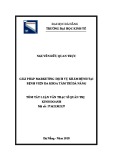
of 20 to 50 mM (Figure 1). The effects of EMS and the effi-
ciency of the mutagenesis treatment were estimated by
quantifying three parameters on M1 plants: seed germina-
tion, frequency of albino chimeras and fertility (see Meth-
ods). Germination of M1 seeds was negatively correlated
with EMS dose (r = -0.93; p = 0.008), while the frequency
of M1 albino chimeras increased with concentration (r =
0.99; p = 0.001) (Figure 1A and 1B). Seed fertility of M1
plants and the degree of M2 embryo lethality was quanti-
fied by estimating the proportion of fully or nearly sterile
fruits (classes As and Aa) and the proportion of semi or
normal fertile fruits (classes B and C). As shown in Figure
1C, the total frequency of class A fruits increased linearly
with EMS concentration, whereas the frequency of fertile
fruits rapidly decreased. To maximize the frequency of
mutations per individual, only M1 plants from treatments
showing a frequency of fertile fruits smaller than 35% but
larger than 2% were individually harvested. A total of
3712 M2 families were grown to isolate individual M2
DNA and to harvest their M3 offspring seeds. To ensure
independence of the mutations present in this popula-
tion, a single M2 plant was harvested from each M1 plant.
In agreement with the high proportion of embryo
lethality, all M2 families segregated for easily visible mor-
phological mutations (data not shown). Fifty six percent

BMC Plant Biology 2009, 9:147 http://www.biomedcentral.com/1471-2229/9/147
Page 3 of 9
(page number not for citation purposes)
of M2 lines were derived from 25 mM EMS mutagenesis,
and on average, EMS treatments used to obtain the collec-
tion show less than 25% fertile fruits (Table 1). The DNA
of M2 plants and the M3 seeds of the 3712 lines were
stored (see Methods) providing a permanent population
of mutant lines for TILLING analysis in Ler genetic back-
ground. This population has been named as the Arabi-
dopsis TILLer collection.
Mutation frequency, distribution and functional spectrum
in TILLer collection
The quality of this collection for mutant discovery was
evaluated after the analysis of 14 gene fragments distrib-
uted among four of the five A. thaliana chromosomes and
chosen from requests by different research laboratories
(see Methods; Figure 2 and Table 2). These fragments have
a GC content similar to that of fragments studied in Col
background TILLING collection [10] and to average cod-
ing regions of A. thaliana genome [11]. On average, ampli-
cons were 1.1 kb long and 62.2% corresponded to exon
sequence, which is similar to genome average exon pro-
portion [11]. In total, we found and confirmed by
sequencing 450 mutations in the 15.7 kb analyzed from
different amplicons. All mutations corresponded to G/C
to A/T transitions, in agreement with the nearly unique
type of nucleotide substitutions observed in previous
analyses of EMS-mutagenized A. thaliana plants [10]. The
distribution of mutations among the EMS doses of the
lines was independent of the number of lines per dose
(Table 1; χ2 = 28.9; df = 4; p < 0.0001). A larger number of
mutations were found at 30, 35 and 40 mM than expected
from the number of lines, while the opposite was found at
25 mM. In addition, 34 lines carried several mutations in
the same or two different gene fragments (Table 1). An
excess of these lines was found in plants derived from
high EMS concentrations (≥30 mM) while a deficiency
appears in low EMS concentrations (≤25 mM) when com-
paring with the expected number according to the propor-
tion of lines from each EMS dose (χ2 = 5.8; df = 1; p =
0.016). Therefore, the higher the EMS concentration used
to obtain the lines, the larger the number of mutations per
line.
On average we analyzed 2972 lines per fragment and
detected 10.8 mutations per 1000 mutant lines (Table 2).
Twenty-one to 46 mutations were found per fragment,
and in most gene fragments there was a reduction of
mutation detection in the ~100 bp terminal segments
(Figure 2), as expected from LI-COR detection system (see
Methods). However, mutations appeared evenly distrib-
uted along the rest of the gene fragments within exon and
intron regions (Figure 2).
For all but one gene fragment we found mutations of
three classes according to their predicted effects on protein
structure: silent, missense and truncation mutations
(Table 2). The observed frequencies of the three classes of
mutations fitted the expected frequencies of silent, mis-
sense and truncations, respectively, as estimated by COD-
DLE analyses (χ2 = 1.7; df = 2; p = 0.42). Truncations
include nonsense mutations generating premature stop
codons and mutations in intron splice sites, the observed
frequencies of both classes (2.5% and 1.8% respectively)
also fitting expected frequencies (4.0% and 1.1%)(χ2 =
2.8; df = 1; p = 0.09). Interestingly, truncation mutations
were obtained for 13 of the 14 fragments, as expected
from their 5.1% frequency and the large average number
of mutations found per gene (1- [1-0.05]32 = 0.81 proba-
bility).
As shown in Table 2, an average ratio of heterozygous/
homozygous mutations of 3.7 was found, which is signif-
icantly different from the expected 2:1 proportion for M2
plants (χ2 = 30.2; df = 1; p < 0.0001). Although an excess
of heterozygotes appeared for silent mutations (p < 0.01),
this ratio was extreme for truncations since all but one of
such mutations were present as heterozygotes. In addi-
tion, distortion from the expected proportion was larger
for high EMS dose lines (35-40 mM) than for low concen-
trations (25-30 mM) (Table 1).
Table 1: Description of A. thaliana Ler mutant lines and mutations in relation to EMS dose.
EMS
dose
(mM)
Number of
TILLer
lines
Mean (B+C)
fertility
class (%)
Total number
of
screened lines*
Number
of
mutations
Het/Hom
mutation
ratio
Number of lines
with
two mutations
Density of
mutations
per line
20 46 24.5 ± 5.4 614 (1.5%) 7 (1.5%) 6.0 0 (0%) 1/84 kb
25 2082 16.8 ± 3.7 21150 (50.8%) 178 (39.6%) 3.6 10 (29.4%) 1/114 kb
30 741 10.5 ± 2.8 9196 (22.1%) 112 (24.9%) 3.3 10 (29.4%) 1/79 kb
35 739 3.7 ± 1.2 9313 (22.4%) 128 (28.4%) 4.3 12 (35.3%) 1/70 kb
40 104 2.6 ± 1.0 1335 (3.2%) 25 (5.6%) 4.0 2 (5.9%) 1/51 kb
Total 3712 12.6 ± 4.6** 41608 450 3.7** 34 1/96 kb**
*: Number of screened lines is estimated as the total sum of individuals analyzed for each of the 14 gene fragments.
**: Weighted averages are shown according to frequency of lines of the different EMS dose.

BMC Plant Biology 2009, 9:147 http://www.biomedcentral.com/1471-2229/9/147
Page 4 of 9
(page number not for citation purposes)
From these analyses we estimated an average density of
detected mutations per line of 1 mutation per 89 kb (450
mutations/[2972 lines × 13.4 kb]), which was calculated
after subtracting 160 terminal base pairs with low LI-COR
detection, from each amplicon (see Methods). However,
the density of mutations varied from 1/114 kb to 1/51 kb
depending on the EMS dose used to generate the lines, a
two-fold variation being found between 25 and 40 mM
(Table 1). To contrast this average mutation frequency
estimation, the density of mutations was also independ-
ently calculated from the number of pool samples with
two mutant individuals in the same fragment or from the
number of individual lines with two mutations in the
same gene fragment [10]. Forty-four pool samples were
found to carry two mutant individuals when analyzing the
individual lines. Thus, a total of 406 pool samples were
originally detected as positive pools, which contain 406 ×
8 individuals representing a sample analyzed at individ-
ual level to find second mutations. From these 406 pool
samples with at least one positive line we estimated a den-
sity of 1 mutation/71 kb (44/[406 pool samples × 8 indi-
viduals × 0.96 kb]), which is similar to previous estimate.
On the other hand, when sequencing positive lines for
their corresponding fragments, five individual lines were
found to carry two mutations within the same fragment.
Therefore, 445 lines were sequenced and can be consid-
ered a sample analyzed to detect second mutations by
sequencing. From these lines we calculated a density of 1
mutation/100 kb (5/[445 × 1.12 kb]), which is compara-
ble to the above estimates. In contrast to previous calcula-
tions, this latest density was estimated from the complete
amplicon length (1.12 kb) because it was derived from the
sequencing of entire fragments and not from LI-COR
detection of positive lines.
From the above density of mutations we have calculated
an average number of 1404 mutations per line, the com-
plete TILLer collection providing a total of 5.2 million
mutations. Taking into account the observed frequencies
of truncation and missense mutations (Table 2), and the
total length of gene regions of A. thaliana genome (see
Methods), we have roughly estimated that each TILLer
line contains, on average, 30 genes with knock-out muta-
tions and 281 genes with aminoacid substitutions.
Discussion
We have developed a new permanent collection of 3712
independent EMS-induced mutant lines for reverse
genetic analysis in the reference laboratory strain Lands-
berg erecta of A. thaliana. To maximize the number of
mutations present in this population we have increased
the frequency of mutations per M2/M3 line by using M1
plants with lower seed fertility than that of plants used to
obtain the existing population in Columbia background
[9]. By compromising fertility, we aimed to saturate the
Dose effects of EMS mutagenesis in A. thaliana M1 Ler plantsFigure 1
Dose effects of EMS mutagenesis in A. thaliana M1 Ler
plants. A) Frequency of M1 seed germination. B) Frequency
of M1 albino chimeras at vegetative stage. C) Frequency of
sterility, embryo lethality and fertility measured as the per-
centage of different fruit classes. Fruits of M1 plants are classi-
fied as As, Aa, B and C (from fully sterile to nearly normal
fertility) depending on the proportion of aborted seeds (see
Methods for details). Data are mean ± SE of three to six rep-
licates. Untreated control plants showed 100% germination,
0% albino chimeras and 0, 3 and 97% of A, B and C fruit
classes.

BMC Plant Biology 2009, 9:147 http://www.biomedcentral.com/1471-2229/9/147
Page 5 of 9
(page number not for citation purposes)
number of chemically induced mutations that can be tol-
erated by A. thaliana plants that are still viable and able of
sexual reproduction. We estimated that, on average, the
lines of this new Ler collection carry one mutation every
89 kb, which is significantly larger than the density of 1/
300 kb estimated in current Col population [10]. As
expected, we found that the higher the EMS concentration
the higher the density of detected mutations per line.
Thus, experimental control of EMS mutagenesis enables
substantial increase of the frequency of induced muta-
tions in viable and seed fertile plants. However, we cannot
discard that mutation density differences between both
TILLING populations of A. thaliana might be partly due to
natural genetic variation between both wild type strains
for their tolerance to chemically induced mutations.
Accordingly, it could be speculated that such natural vari-
ation might be determined by variation for reproductive
system plasticity or for DNA repair mechanisms.
As described by Greene et al. [10] estimations of the den-
sity of chemically induced mutations detected by TILLING
procedure can be biased due to several factors such as: 1)
uneven mutation detection among the pools of eight
plants; 2) uneven mutation detection along the length of
gene fragments; 3) higher GC content of analyzed frag-
ments (41%) than average genome (35%) [11]; and 4)
dilution of one fourth of the M1 mutations in M2 plants.
Taking into account these factors, it has been estimated
that Col population shows a corrected average mutation
density per line of 1/170 kb. Despite these factors, the 1/
89 kb average frequency of induced mutations detected in
Ler population is nearly twice higher than that of Col. Fur-
thermore, Ler lines obtained from the highest EMS dose
show a 1/51 kb mutation density, which triplicates the
lowest density estimate of Col population. Comparisons
with TILLING populations in other species indicates that
A. thaliana Ler collection carries the highest mutation den-
sity induced by different chemical agents in diploid
plants, including Brassica oleracea, Medicago truncatula,
rice, barley, maize and sorghum; or animals like Dro-
sophila and Caenorhabditis elegans, or the oomycote Phy-
tophthora sojae (see Table 3). Only rapeseed and wheat
collections carry a higher density of mutations, as
expected from their polyploid nature and consequently,
their higher tolerance to loss-of-function mutations due
to gene duplications and redundancies (Table 3). Thus,
the density of mutations found in Ler A. thaliana popula-
tion increases the estimated load of chemically induced
mutations that diploid species can tolerate in sexually fer-
tile individuals.
Table 2: Mutations found in 14 gene fragments analyzed in TILLer collection.
Gene
Amplicon
length
(bp)
Exon
length
(bp)
Intron
length
(bp)
GC
content
(%)
# of
screened
lines
Total #
of
mutations
Mutation class*
Silent Missense Truncation**
At1g12650 977 416 561 35.6 1968 22 11/1 6/3 1/0
At1g32640 1015 1015 0 49.8 2000 42 8/2 22/7 3/0
At2g22475 839 439 400 44.3 3416 33 7/2 16/7 1/0
At2g22540 1128 278 850 35.5 3216 25 18/2 4/0 1/0
At2g26300 1152 547 605 37.7 3456 32 19/3 6/2 2/0
At2g27100 1272 1049 223 43.8 3360 25 6/2 14/3 0/0
At3g06120 1143 513 630 35.0 3432 29 11/3 10/4 1/0
At3g13040 1093 581 512 39.8 2728 28 17/3 4/2 2/0
At3g24740 1195 1068 127 46.4 3472 46 10/3 23/8 2/0
At5g07280 1228 1228 0 46.0 2728 36 6/2 17/10 1/0
At5g11270 1075 667 408 39.8 1896 21 7/5 4/4 1/0
At5g23280 1077 762 315 42.5 3352 39 7/1 23/7 1/0
At5g41560 1299 262 1037 36.8 3200 32 25/5 0/1 1/0
At5g50570 1180 939 241 40.3 3384 40 12/1 23/1 2/1
Total 15673 9764 5909 41.0 41608 450 164/35 172/59 19/1
Average 1120 697 422 41.0 2972 32 12/3 12/4 1/0
Observed frequency (%) 47.2 48.5 4.3
Expected frequency (%) 48.8 46.1 5.1
*: number of heterozygous/homozygous mutations are given for each of the three mutations classes.
**: Truncations include mutations generating premature stop codons and mutations in splice sites.


![Hình ảnh học bệnh não mạch máu nhỏ: Báo cáo [Năm]](https://cdn.tailieu.vn/images/document/thumbnail/2024/20240705/sanhobien01/135x160/1985290001.jpg)


![Bộ Thí Nghiệm Vi Điều Khiển: Nghiên Cứu và Ứng Dụng [A-Z]](https://cdn.tailieu.vn/images/document/thumbnail/2025/20250429/kexauxi8/135x160/10301767836127.jpg)
![Nghiên Cứu TikTok: Tác Động và Hành Vi Giới Trẻ [Mới Nhất]](https://cdn.tailieu.vn/images/document/thumbnail/2025/20250429/kexauxi8/135x160/24371767836128.jpg)


