
RESEARCH ARTICLE Open Access
Dimensionality and scale properties of the
Edinburgh Depression Scale (EDS) in patients with
type 2 diabetes mellitus: the DiaDDzoB study
Evi SA de Cock
1,2†
, Wilco HM Emons
1,3†
, Giesje Nefs
1
, Victor JM Pop
1
and François Pouwer
1*
Abstract
Background: Depression is a common complication in type 2 diabetes (DM2), affecting 10-30% of patients. Since
depression is underrecognized and undertreated, it is important that reliable and validated depression screening
tools are available for use in patients with DM2. The Edinburgh Depression Scale (EDS) is a widely used method for
screening depression. However, there is still debate about the dimensionality of the test. Furthermore, the EDS was
originally developed to screen for depression in postpartum women. Empirical evidence that the EDS has
comparable measurement properties in both males and females suffering from diabetes is lacking however.
Methods: In a large sample (N= 1,656) of diabetes patients, we examined: (1) dimensionality; (2) gender-related
item bias; and (3) the screening properties of the EDS using factor analysis and item response theory.
Results: We found evidence that the ten EDS items constitute a scale that is essentially one dimensional and has
adequate measurement properties. Three items showed differential item functioning (DIF), two of them showed
substantial DIF. However, at the scale level, DIF had no practical impact. Anhedonia (the inability to be able to
laugh or enjoy) and sleeping problems were the most informative indicators for being able to differentiate
between the diagnostic groups of mild and severe depression.
Conclusions: The EDS constitutes a sound scale for measuring an attribute of general depression. Persons can be
reliably measured using the sum score. Screening rules for mild and severe depression are applicable to both
males and females.
Background
Patients with type 2 diabetes mellitus (DM2) have about
a two-fold increased risk of major depression, affecting at
least one in every ten diabetes patients [1-3]. Depression
notonlyhasaseriousnegativeimpactonthequalityof
life of diabetes patients [4], but is also associated with
poorer glycemic control, worse cardiovascular outcomes,
and an increased health care consumption [5-7]. Depres-
sion is particularly common in diabetes patients with co-
morbidity [2,3,8] and is associated with higher levels of
diabetes-specific emotional distress [9].
Ithasbeenshownthatdepressionindiabetespatients
can be successfully treated by means of cognitive beha-
vioral therapy, anti-depressive medication, or a combina-
tion of both [10]. However, an important barrier to
effective treatment is the generally low recognition rate
of depression [11,12]. International clinical guidelines
advocate screening for depression in patients with
diabetes [13-15]. Results from studies in non-diabetes
patients suggest that screening for depression per se does
not improve outcome [16]. It is crucial that screening
procedures are embedded in a managed care approach
for co-morbid depression that includes the monitoring of
depression outcomes [16,17].
A proxy for depression is the occurrence of depressive
symptoms: subjects with high levels of depressive symp-
toms do not necessarily meet the criteria for a syndromal
diagnosis, but are at high risk for developing full blown
major depression [18]. Moreover, it has clearly been
* Correspondence: f.pouwer@uvt.nl
†Contributed equally
1
Department of Medical Psychology & Neuropsychology, Center of Research
on Psychology in Somatic diseases (CoRPS), Tilburg University, Tilburg, The
Netherlands
Full list of author information is available at the end of the article
de Cock et al.BMC Psychiatry 2011, 11:141
http://www.biomedcentral.com/1471-244X/11/141
© 2011 de Cock et al; licensee BioMed Central Ltd. This is an Open Access article distributed under the terms of the Creative Commons
Attribution License (http://creativecommons.org/licenses/by/2.0), which permits unrestricted use, distribution, and reproduction in
any medium, provided the original work is properly cited.

demonstrated that subjects with high levels of depressive
symptoms also have a poor quality of life, an increased
resource utilization pattern, and a worse outcome regard-
ing all kinds of somatic parameters of chronic disease,
including diabetes [4,19,20]. Because of the high inci-
dence of major depression in subjects with high depres-
sive symptoms, most screening programs for depression
use self-rating instruments. These instruments are user-
friendly and large numbers of patients at risk can be
approached. Subsequently, patients with a high score are
subject to a syndromal diagnostic interview. So far, only a
few measures of depressive symptoms have been tested
for use in diabetes patients [21-25].
Since it is important that reliable and validated screen-
ing tools of depressive symptoms are available for use in
patients with DM2, the aim of this study is to investigate
the measurement properties of the Edinburgh Depression
Scale (EDS) [26,27]. The EDS is a widely used screening
tool that is regarded as suitable for screening purposes in
various patient groups. It only takes a few minutes to
complete and does not include items on the somatic
symptoms of depression, such that the scores will not be
biased by somatic symptoms caused by the disease.
Although the EDS has been successfully applied in sev-
eral studies [e.g., [28,29]], there are three important issues
that need further elaboration.
Firstly, there is ambiguity in the literature as to whether
the EDS measures one or multiple dimensions. Some stu-
dies found support for a one-dimensional model [30,31],
whereas others for a multi-dimensional model, compris-
ing dimensions relating to depression, anhedonia, and
anxiety [32-35]. For a valid interpretation of the EDS
scores, it is important that these have an unequivocal
meaning and do not represent a mixture of distinct char-
acteristics. In the latter case, it would be inappropriate to
use sum scores and the use of EDS subscales should be
recommended.
Secondly, the EDS was originally developed to measure
depressive symptoms in postnatal women and was called
the Edinburgh Postnatal Depression Scale [26]. In recent
years,theEDShasbecomemorewidelyusedinother
patient samples that include both males and females.
However, in some instances, the response to an item may
have a different meaning for males than for females. A
classic example in the context of depression assessment
is crying, which indicates a more severe level of depres-
sion in the case of males than of females [e.g., [36]].
Therefore, an important issue that should be empirically
examined is whether the items apply similarly to males
and females. If one or more items in the EDS are biased
with respect to gender, the sum scores for males cannot
be compared with those for females, and the items show-
ing bias should be removed or different scoring rules for
males and females should be applied.
Thirdly, in clinical practice the EDS is used as a screen-
ing instrument for respondents with elevated depressive
symptoms [e.g., [28,29]]. For example, the EDS is routinely
used to screen women with an increased risk of postpar-
tum depression [37]. Commonly recommended cutoff
scores [27,38,39] include those of 12 or 13 to indicate
patients with major depression, while those from 9 to 11
indicate patients with mild depressive symptoms who are
in need of further assessment. Once accurate cutoff scores
(i.e., high sensitivity/specificity) have been derived, it can
be useful from a clinical perspective to investigate how the
diagnostic groups differ at an item level, and which items
provide the most information regarding differences in
depression levels in the vicinity of these cutoff points. This
information can be used to determine which items are the
main indicators for distinguishing between mildly and
severely depressed respondents. Practitioners working
with the EDS can focus on the symptoms described by
these items and use them as important ‘signals’to identify
those respondents who are about to become mildly or
severely depressed [e.g., [40]]. In this study, we examine
the test and item properties of the EDS for commonly
used cutoffs [27,38,39].
The present study addresses these three issues in a
large sample of patients with type 2 diabetes mellitus. To
accomplish our aims, we used confirmatory factor analy-
sis (CFA; [41]) and item response theory (IRT; [42]).
Since its initial development, CFA has been widely
applied to assess dimensionality. During the last decades,
IRT has become increasingly popular for studying the
measurement properties of self-report scales and ques-
tionnaires in the context of psychological and clinical
assessment [43]. In the present study, both parametric
and non-parametric IRT models [44,45] will be used,
which together provide a flexible framework for studying
the dimensionality, item bias, and measurement proper-
ties of the EDS.
Methods
Participants
The methods and design of the DiaDDZoB (Diabetes,
Depression, Type D personality Zuidoost-Brabant) Study
have been described in detail elsewhere [46]. Briefly,
2,460 type 2 diabetes patients (82% of those considered
for inclusion in the study) treated at 77 primary care
practices in south-eastern Brabant, the Netherlands, were
recruited for the baseline assessment during the second
half of 2005 (M0). Of these patients, 2,448 (almost 100%)
attended a baseline nurse-led interview, while 1,850
(75%) returned the self-report questionnaire that had to
be completed at home. In addition, results from regular
care laboratory tests and physical examinations were also
used. The study protocol of the DiaDDZoB Study was
approved by the medical research ethics committee of a
de Cock et al.BMC Psychiatry 2011, 11:141
http://www.biomedcentral.com/1471-244X/11/141
Page 2 of 19

local hospital: Máxima Medical Centre, Veldhoven
(NL27239.015.09). In the present study, we only used
data from participants who completed all the EDS items,
resulting in a sample of 1,656 participants.
Measures
The Edinburgh Depression Scale (EDS). The EDS is a self-
report questionnaire consisting of ten items (for item
content see Table 1, columns 1 and 2) with four ordered
response categories scored from 0 to 3. After recoding
the reverse worded items, sum scores may range from 0
to 30; the higher the sum score, the higher the level of
depression. In the present study, a Dutch version of the
EDS was used. The EDS has been validated in various
countries, including the Netherlands, using different
methods [32,47-49]. When used as a screening instru-
ment, the cutoff scores of 12/13 usually designate major
depression, whereas scores from 9 to 11 indicate mild
depression levels in need of further assessment [27,37].
Statistical Analyses
Item Response Theory
The core of IRT models is the set of item-response func-
tions (IRF), which describe the relationship between item
responses and the hypothesized latent attribute of inter-
est. Within the IRT framework, a distinction can be
made between parametric IRT approaches [50,51] and
nonparametric IRT [52]. The difference between para-
metric and nonparametric IRT models is the way in
which they define the shape of these cumulative IRFs.
Parametric IRT models specify the IRF using a mathema-
tical function. Nonparametric IRT models only assume a
monotone increasing relationship between attribute and
item responses, but do not require a parametric function.
This property makes nonparametric IRT models excel-
lent starting points in any IRT analysis, particularly for
the purposes of (exploratory) dimensionality analysis and
early identification of malfunctioning items.
For the nonparametric IRT analyses, we used Mokken’s
monotone homogeneity model (MHM) [52, Chap. 7] and
for the parametric IRT analyses, Samejima’sgraded
response model (GRM) [53], which are both suitable for
analyzing ordered polytomous item responses (i.e., Likert
items). Both the MHM and the GRM assume that only
one single latent attribute underlies the responses (i.e.,
the assumption of unidimensionality) and that the asso-
ciation between item scores is solely explained by this
single attribute (i.e., the assumption of local indepen-
dence). To explain the differences between the IRFs
under the MHM and GRM, some notation should be
introduced. Therefore, let M+1bethenumberof
response options (i.e., M=3fortheEDS)andθdenote
the latent attribute of interest (i.e., θrepresents depres-
sion in the EDS). Furthermore, let X
j
denote the item-
score variable for item jand X
+
the sum score. Under the
MHM and GRM, each item is described by Mcumulative
IRFs, with the mth IRF describing the probability of scor-
ing in category mor higher as a function of θ. The prob-
ability of answering within a particular category can
easily be derived from the cumulative IRFs ([42], p. 99).
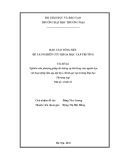
The MHM assumes that the IRFs are non-decreasing
functions in θ(i.e., the monotonicity assumption), but
within this restriction any shape is allowed. Examples of
IRFs for two MHM items are provided in Figure 1A; the
Table 1 Descriptive item and scale statistics and results of confirmatory factor analyses
Factor Loadings
CFA
Polychoric
1
FI One-Factor
Model
2
Bifactor Model
Item Content Item Mean (SD)
β
−
General
Factor
Specific
Factor
1 I have been able to laugh and see the funny side of things 0.37 (0.73) .82 .69 .62 .63
2 I have looked forward with enjoyment to things 0.42 (0.82) .81 .68 .61 .74
3* I have blamed myself unnecessarily when things went wrong 1.06 (0.86) .52 .51 .53 –
4 I have been anxious or worried for no good reason 0.90 (0.89) .65 .64 .65 –
5* I have felt scared or panicky for no very good reason 0.78 (0.83) .70 .69 .71 –
6* Things have been getting on top of me 0.81 (0.76) .75 .74 .75 –
7* I have been so unhappy that I have had difficulty sleeping 0.62 (0.80) .80 .79 .80 –
8* I have felt sad or miserable 0.53 (0.67) .84 .83 .83 –
9* I have been so unhappy that I have been crying 0.28 (0.53) .74 .73 .73 –
10* The thought of harming myself has occurred to me 0.09 (0.37) .67 .67 .68 –
Sum score 5.86 (4.78)
Reliability .84
3
.83 .83
* item recoded in order that higher scores indicate higher levels of depression.
1
CFA Polychoric = Confirmatory Factor Analysis on Polychoric correlation matrix;
2
FI One-Factor Model = Full-Information One-Factor Model;
3
Cronbach’s alpha.
de Cock et al.BMC Psychiatry 2011, 11:141
http://www.biomedcentral.com/1471-244X/11/141
Page 3 of 19

solid lines represent the IRFs of one item, and the
dashed lines of another. Under Samejima’sGRM,the
IRFs are assumed to be logistic functions. Examples of
IRFs under the GRM are provided in Figure 1B; the
solid lines represent a highly discriminating item and
the dashed lines a weakly discriminating one. The IRFs
of an item jare defined by one common slope para-
meter (denoted by a)andMthreshold parameters
(denoted by b
jm
). The slope parameter a, indicates the
discrimination power of an item; the higher the slope
parameter a, the steeper the IRF and the better the item
discriminates low θvalues from high θvalues. The
thresholds b
jm
(m= 1,..., M) indicate how the item scores
categorize the θscale into M+ 1 groups and can be
conceived as points on the latent θscale where the item
optimally discriminates high θfrom low θvalues.
The IRT approaches adopted in this study have several
advantages compared to classical test theory ([54]) and
Rasch analysis [55]. Firstly, Mokken models provide empiri-
cal justification for using sum scores as measurements
-2.0 -1.5 -1.0 -0.5 0.0 0.5 1.0 1.5 2.0
Attribute Value
0.0
0.2
0.4
0.6
0.8
1.0
Cumulative Response Probability
x1t x1
x2t1
x2t2
x2 3
x1t1
-2.0 -1.5 -1.0 -0.5 0.0 0.5 1.0 1.5 2.
0
Attribute Value
0.0
0.2
0.4
0.6
0.8
1.0
Cumulative Response Probability
x1
x2t1
x2t
x1t1
x2 3
x1t
(a)
(b)
Figure 1 Examples of cumulative item response functions (IRFs) under (a) Mokken’s Homogeneity model and (b) the Graded Response
Model.
de Cock et al.BMC Psychiatry 2011, 11:141
http://www.biomedcentral.com/1471-244X/11/141
Page 4 of 19

of the underlying construct [52,56]. If a set of items fails to
fittheMHM,respondentscannotbescaledontheunderly-
ing dimension by their sum scores. In classical test theory it
is assumed that the sum scores are proper measurements
of the underlying attribute, without testing this assumption
empirically.
Secondly, the MHM and GRM are less restrictive than
Raschmodelsandthusmaybebetterabletodescribe
the structure in the data and prevent researchers from dis-
missing items with adequate measurement properties for
the wrong reasons. For example, the MHM - which was
the most general measurement model used in the present
study - only requires the IRFs to increase monotonically
(Figure 1A). Items with monotone increasing functions are
valid indicators of the underlying construct [56]. This
means that, for valid measurement, IRFs do not necessarily
have to conform to a logistic function, as required under
the Rasch model. In addition, as in the case of the Rasch
model, the GRM requires logistic functions, but unlike the
Rasch model, the GRM permits varying slopes across the
items (Figure 1B). Under the Rasch model, the IRFs would
be parallel lines. The equal-slopes assumption in the
Rasch model states that all the items in the questionnaire
have the same discrimination power. In real data, this is
often an unrealistic assumption and, as a result, a Rasch
analysis may result in badly fitting items, not because the
item is malfunctioning but because the item discrimina-
tion is different from the other items in the questionnaire.
Issue 1: Is the EDS unidimensional?
Exploratory dimensionality analysis.Toexplorethe
dimensionality using IRT, we adopted Mokken scale ana-
lysis (MSA) [52], which is a scaling methodology based on
the MHM. MSA has several advantages over exploratory
factor analysis (EFA) on Pearson correlation matrices; see
[57,58]. Firstly, MSA is based on less restrictive distribu-
tional assumptions than EFA and is therefore suitable for
analyzing data from items with skewed score distributions
(e.g., items that measure symptoms with a low prevalence
in the population under study). With EFA, such items may
lead to over-extraction of artificial difficulty factors that
have no substantive meaning. Secondly, MSA explicitly
takes into account the psychometric properties of items,
such as the scalability, for uncovering unidimensional
scales, whereas factor analysis only uses the inter-item cor-
relations without testing whether items are psychometri-
cally sound.
In an MSA, the dimensionality is explored using scal-
ability coefficients, which are defined at the item level
(denoted by H
i
) and the scale level (denoted by H). The
item scalability coefficients H
i
indicate how well an item
is related to other items in the scale and can be conceived
as the nonparametric counterpart of an item loading in a
factor analysis. The scale Hvalue summarizes the item
scale values into a single number and expresses the
degree to which the sum score accurately orders persons
on the latent attribute scale θ[52]. The higher the H
value, the more accurately persons can be ordered using
the sum score. To explore whether the items form one
unidimensional scale, or several dimensionally distinct
subscales, we used an automated item selection proce-
dure (AISP) [52, Chap. 5, pp. 65 - 90]. This AISP sequen-
tially clusters items into disjointed subsets of items, each
representing one- dimensional attribute scales. The items
are clustered under the restriction that the resulting
scales and their constituent items yield scalability coeffi-
cients greater than a user-specified lower-bound value c.
Therefore, this lower-bound ccontrols the minimum
scalability level of the items to be included in the scale
and must be chosen by the user. The following rules of
thumb for choosing c-values are commonly used: .30 <c
< .40 for finding weak scales, .40 <c<.50forfinding
medium scales, and c> .50 for strong scales [see 52, p.
60]. The dimensionality can be revealed by evaluating the
clusters produced by applying the AISP for different
c-values increasing from .30 to .55 with steps of .05 [52,
p. 81]. For unidimensional scales, the typical sequence of
outcomes of the AISP with increasing c-values is that,
first, all the items are in one scale, then one smaller scale
is found, and finally, one or a few scales are found and
several items are excluded [52, p. 81]. Within each step
of the AISP, for each cluster it has to be evaluated
whether its constituent items have non-decreasing IRFs
in order to make sure that the scales fit the MHM. Items
that have locally increasing IRFs violate the monotonicity
assumption and should be removed from the cluster
because they distort accurate person ordering using X
+
.
All analyses were done with the Mokken Scale Analysis
for Polytomous items (MSPWIN) program [59]. To facili-
tate dimensionality analysis, the results of MSA will be
compared with those of a CFA on the polychoric correla-
tion matrix in MPLUS5 [60].
Issue 2: Are the items in the EDS unbiased with respect
to gender?
An item is considered biased with respect to gender if the
item parameters are significantly different for males and
females. The phenomenon that parameters vary across
groups is termed differential item functioning (DIF). If an
item shows DIF, individuals from different groups, but
with the same attribute levels, do not have the same
response probabilities for that item. To test for DIF, we
used IRT-based likelihood ratio tests (e.g., [61]) as imple-
mented in the program IRTLRDIF2.0 [62]. To test for gen-
der bias, the likelihood- ratio test compares the fit of two
nested IRT models: a restricted model in which the item
de Cock et al.BMC Psychiatry 2011, 11:141
http://www.biomedcentral.com/1471-244X/11/141
Page 5 of 19


![Bộ Thí Nghiệm Vi Điều Khiển: Nghiên Cứu và Ứng Dụng [A-Z]](https://cdn.tailieu.vn/images/document/thumbnail/2025/20250429/kexauxi8/135x160/10301767836127.jpg)
![Nghiên Cứu TikTok: Tác Động và Hành Vi Giới Trẻ [Mới Nhất]](https://cdn.tailieu.vn/images/document/thumbnail/2025/20250429/kexauxi8/135x160/24371767836128.jpg)


