
BioMed Central
Page 1 of 9
(page number not for citation purposes)
Theoretical Biology and Medical
Modelling
Open Access
Research
Examination of effects of GSK3β phosphorylation, β-catenin
phosphorylation, and β-catenin degradation on kinetics of Wnt
signaling pathway using computational method
Ying-Chieh Sun
Address: Department of Chemistry, National Taiwan Normal University, 88, TingChow Road Section 4, Taipei 116, Taiwan
Email: Ying-Chieh Sun - sun@ntnu.edu.tw
Abstract
Background: Recent experiments have explored effects of activities of kinases other than the
well-studied GSK3β, in wnt pathway signaling, particularly at the level of β-catenin. It has also been
found that the kinase PKA attenuates β-catenin degradation. However, the effects of these kinases
on the level and degradation of β-catenin and the resulting downstream transcription activity
remain to be clarified. Furthermore, the effect of GSK3β phosphorylation on the β-catenin level
has not been examined computationally. In the present study, the effects of phosphorylation of
GSK3β and of phosphorylations and degradation of β-catenin on the kinetics of the wnt signaling
pathway were examined computationally.
Methods: The well-known computational Lee-Heinrich kinetic model of the wnt pathway was
modified to include these effects. The rate laws of reactions in the modified model were solved
numerically to examine these effects on β-catenin level.
Results: The computations showed that the β-catenin level is almost linearly proportional to the
phosphorylation activity of GSK3β. The dependence of β-catenin level on the phosphorylation and
degradation of free β-catenin and downstream TCF activity can be analyzed with an approximate,
simple function of kinetic parameters for added reaction steps associated with effects examined,
rationalizing the experimental results.
Conclusion: The phosphorylations of β-catenin by kinases other than GSK3β involve free
unphorphorylated β-catenin rather than GSK3β-phosphorylated β-catenin*. In order to account
for the observed enhancement of TCF activity, the β-catenin dephosphorylation step is essential,
and the kinetic parameters of β-catenin phosphorylation and degradation need to meet a condition
described in the main text. These findings should be useful for future experiments.
Background
The Wnt/β-catenin signaling pathway (named wnt path-
way hereafter for simplicity) plays a significant role in cell
proliferation, differentiation, and apoptosis. These have
implications for aspects of cell development, stem cells
and cancer [1]. Many characteristics of this pathway and
its role in cell signaling have been revealed in experimen-
tal studies (for review, see for example [1], and references
therein and the literature listed at http://www.stan
ford.edu/~rnusse/wntwindow.html). Briefly, wnt signal-
ing enhances the level of the output signal protein,
unphosphorylated β-catenin, which then binds with TCF
Published: 22 July 2009
Theoretical Biology and Medical Modelling 2009, 6:13 doi:10.1186/1742-4682-6-13
Received: 22 April 2009
Accepted: 22 July 2009
This article is available from: http://www.tbiomed.com/content/6/1/13
© 2009 Sun; licensee BioMed Central Ltd.
This is an Open Access article distributed under the terms of the Creative Commons Attribution License (http://creativecommons.org/licenses/by/2.0),
which permits unrestricted use, distribution, and reproduction in any medium, provided the original work is properly cited.

Theoretical Biology and Medical Modelling 2009, 6:13 http://www.tbiomed.com/content/6/1/13
Page 2 of 9
(page number not for citation purposes)
to induce associated gene expression in the nucleus. At
steady state (SS), the level of β-catenin is balanced by its
synthesis and degradation. The so-called destruction cycle
is a major mechanism of degradation, in which phospho-
rylation of β-catenin by GSK3b is a key step [2]. When the
wnt signal acts on cell, wnt recruits several proteins to
attenuate the reaction rate of this key step, slowing down
the degradation. Therefore, β-catenin accumulates,
enhancing the level of TCF/β-catenin complex and the
resulting associated gene expression.
Recent advances have further illustrate how phosphoryla-
tion and dephosphorylation of major components in the
wnt pathway affect the stability of β-catenin and its TCF
transcription activity [3-7]. It has been found that LRP6
phosphorylates GSK3β and regulates β-catenin independ-
ently of the axin pathway [3]. PKA phosphorylates GSK3β
and affects the β-catenin level in Saos-2 cells [4]. β-catenin
is also phosphorylated by AKT at Ser552, promoting TCF
activity [4]. Furthermore, PKA phosphorylates Ser552 and
Ser675 of β-catenin but this does not affect the β-catenin
level in COS7 cells [5]. Moreover, CK1 phosphorylates
not only axin and APC but also GSK3β and β-catenin [6].
A newly identified component, PP1, dephosphorylates
axin [6]. In addition, phosphorylation of β-catenin at
Ser675 by PKA attenuates β-catenin degradation, stabiliz-
ing β-catenin and enhancing TCF activity in the cells
investigated [7]. In aspects of pathology, β-catenin has a
role in carcinogenesis although the extent of its effect var-
ies among cancers [8]. For example, the effect on colorec-
tal cancer is more significant than on lung cancer. In a
recent study [9], a derivative of celecoxib, derivatives of
which have been extensively examined for anti-cancer
treatment, was found to have potential for treating lung
cancer. Proteomics examination showed that PKA activity
has a significant effect on the wnt signaling pathway and
in differentiating lung from normal cells.
In addition to experimental studies, computational stud-
ies have also aided understanding of the dynamical
behaviors of this pathway and how it interacts with other
pathways [2,10-13]. The wnt pathway is one of the com-
putationally best-studied signaling pathways [14-16]. The
kinetics of β-catenin, axin, and other proteins have been
examined in the well-established Lee-Heinrich model [2],
following the nomenclature in [12], which was built on
the basis of experiments with Xenopus. Briefly, the Lee-
Heinrich model contains a number of key protein compo-
nents in the wnt pathway shown in Figure 1[2]. (Note that
a kinase, casein kinase 1 (CK1), was recently implicated in
the activation of β-catenin phosphorylation by GSK3β [6],
and this was not included in the Lee-Heinrich model. This
kinase is not directly related to the three effects examined
in the present study. Therefore, it is not included here.)
Binding of proteins, catalytic activities, phosphorylation
reactions, etc. are described by their corresponding kinetic
rate laws with the associated parameters, which were
obtained from measurements or estimated [2]. Effects of
wnt signaling and changes of activity of some compo-
nents on the kinetics of the pathway can be investigated
by solving kinetic rate law equations [2]. A number of the
effects examined and the kinetics of components were in
excellent agreement with experimental results [2].
In addition to the Lee-Heinrich model of the wnt pathway
itself, this model has been used and extended to examine
the effect of Apc mutations on the wnt signaling pathway
[10], cross-talk with the ERK pathway [11], and the inter-
action of axin2 proteins with the wnt pathway [12]. While
many characteristics of this pathway have been elucidated
both experimentally and computationally, much of its
role in cell signaling and the means by which it interacts
with other pathways remain to be explored.
In the present study, in the light of the recent experimental
studies described above [3-7], I aimed to examine the
effects of GSK3β phosphorylation, β-catenin phosphor-
ylation by kinases other than GSK3β (referred to as β-cat-
enin non-GSK3β phosphorylation hereafter), and β-
catenin degradation on the kinetics of the wnt pathway
using a computational method based on the Lee-Heinrich
model. These effects were not included explicitly in the
Lee-Heinrich model, and to my knowledge, they have not
previously been examined computationally. The present
computational study should elucidate how these effects
affect the wnt pathway. The reaction steps of GSK3β phos-
phorylation, β-catenin non-GSK3β phosphorylation, and
β-catenin degradation were added to the Lee-Heinrich
model (see added reaction steps in blue in Figure 1). The
dependence of SS concentrations on the associated kinetic
parameters of interest in these reaction steps was exam-
ined. Control coefficients of selected parameters and time
courses of selected components with wnt signalling were
calculated and examined as well. The method is described
in Section II. Section III presents the results and discus-
sion. Conclusions are given in the final section.
Methods
The COPASI program [17] was used to solve kinetic rate
equations numerically in order to simulate the wnt path-
way. I first built the Lee-Heinrich model of the wnt path-
way and reproduced the SS concentrations and several
time course concentration curves, shown in Table 2 and
Figure 6 in Ref. [2], respectively. The reproduced results
are shown in Table 1 and the solid lines in Figure 3. The
newly-added and examined effects of GSK3β and β-cat-
enin non-GSK3β phosphorylations were assumed to
involve free GSK3β and β-catenin only. An experimental
study [7] showed that these two proteins are less likely to
be phosphorylated in the complexes than in the free
Theoretical Biology and Medical Modelling 2009, 6:13 http://www.tbiomed.com/content/6/1/13
Page 3 of 9
(page number not for citation purposes)
forms. Additions of these two reaction steps along with
their dephophorylation steps, assigned as reaction steps
18 and 19, respectively, and degradation of β-catenin,
reaction 20, are shown in blue in Figure 1. The rate laws
for these reactions are the kinetic equations for standard
first order reversible (steps 18 and 19) and irreversible
(step 20) reactions. β-catenin non-GSK3β phosphoryla-
tion and degradation were assumed to take place inde-
pendently with un-phosphorylated β-catenin and GSK3β-
phosphorylated β-catenin, as shown in the lower and
upper parts of Figure 1, respectively. These processes were
also examined separately. The effects of these added reac-
tions steps on the kinetics of the pathway were examined.
The forward/backward reaction rate constants of GSK3β
and β-catenin phosphorylations are denoted kG/kG' and
kβ/kβ', respectively. The rate constant of β-catenin degra-
dation is denoted kβdeg. For simplicity, these kinetic
parameters were all set equal to 1 min-1 except in some
cases (see Section III). The parameters of interest were
then varied to examine their effects on the kinetics of the
wnt pathway. Initial concentrations were values of SS con-
centrations used in the Lee-Heinrich model [2] with addi-
tional components, GSK3β+, β-catenin+, and β-catenin*+,
with initial concentrations all set at zero. The superscript
* denotes phosphorylation by GSK3β. Other phosphor-
ylations are denoted by the subscript+. The differential
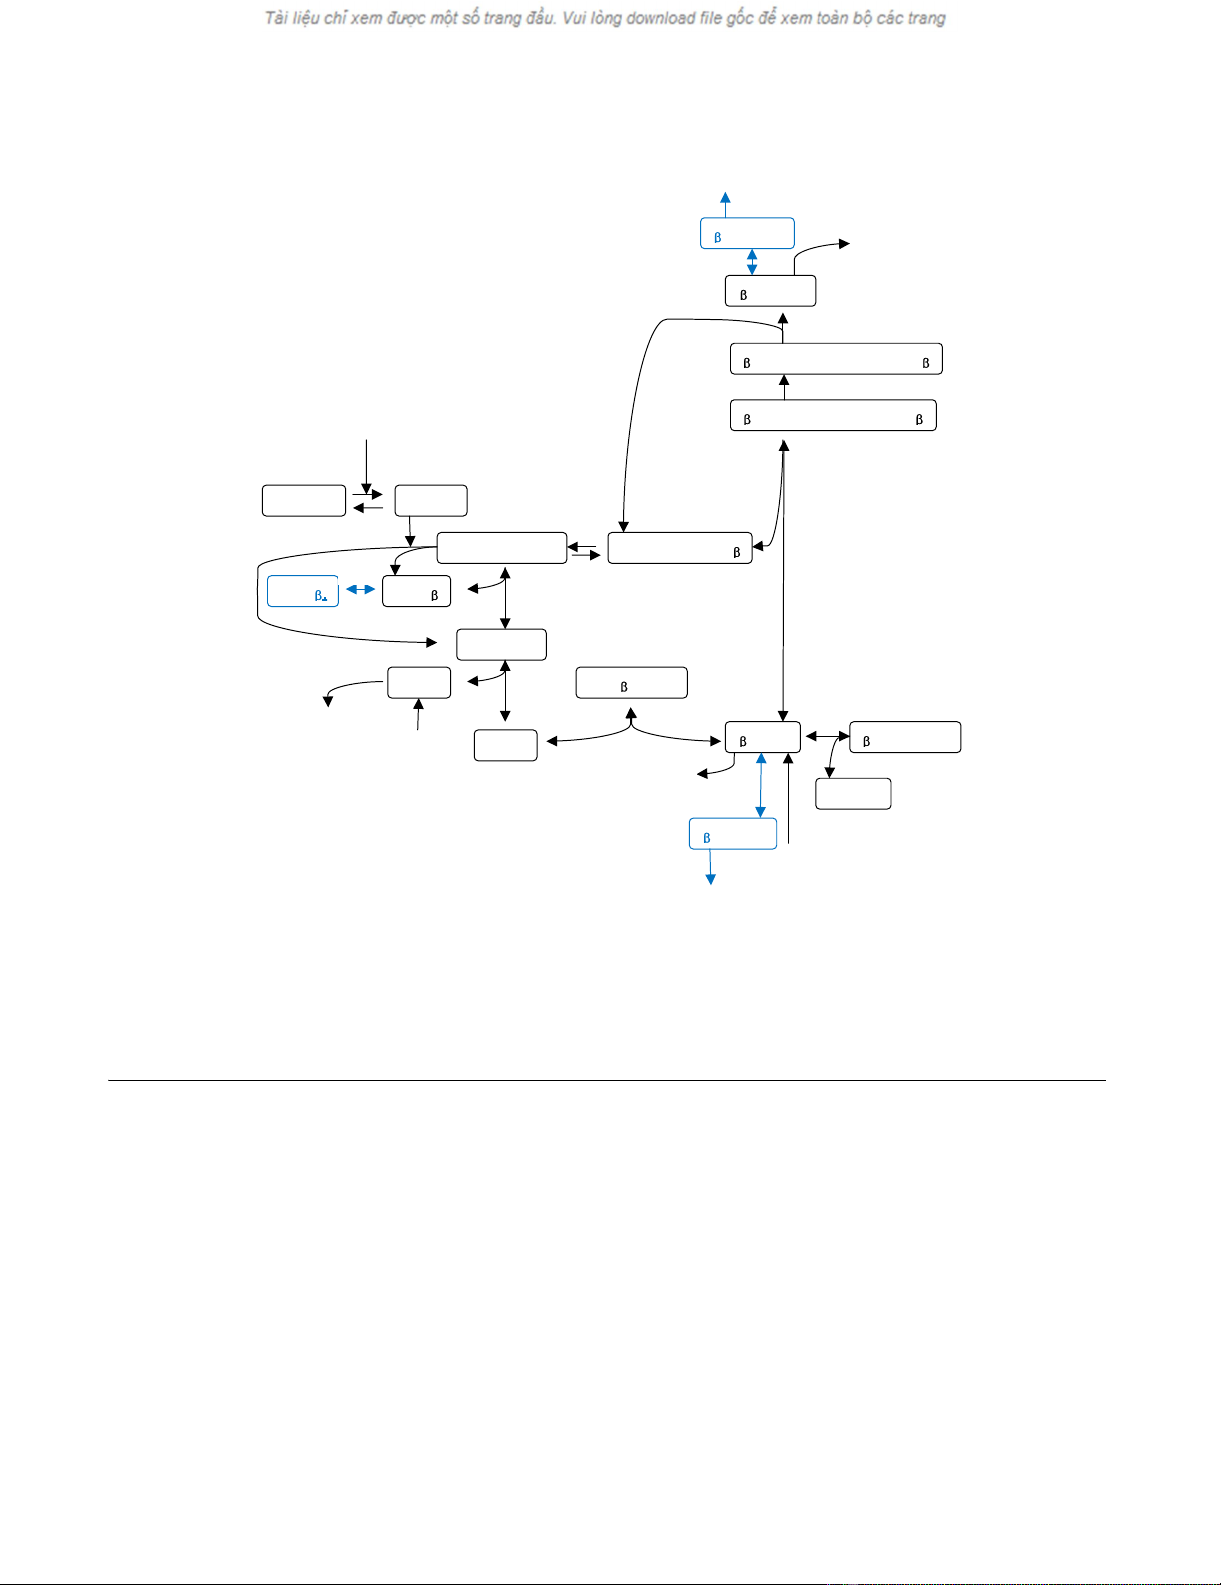
Schematic diagram of the modified Lee-Heinrich model of wnt pathwayFigure 1
Schematic diagram of the modified Lee-Heinrich model of wnt pathway. The modified model includes GSK3β phos-
phorylation, β-catenin non-GSK3β phosphorylation and degradtion denoted by reaction steps 18, 19, and 20, respectively,
shown in blue. The reaction rate constants of these reaction steps are denoted kG/kG' (forward/backward reaction), kβ/kβ', and
kβdeg, respectively. The added reaction steps at β-catenin* shown in the upper part of diagram are similar to the added reaction
steps at β-catenin, denoted 19 and 20 (see text for detailed description). Numbering of other reaction steps is the same as in
the original Lee-Heinrich model [2].
GSK3 GSK3
18
APC/Axin/GSK3
4
APC*/Axin*/GSK3
APC/Axin
Axin
APC -cateni
TCF
-catenin/TCF
-catenin
+
13
19
APC/ -catenin
20
-catenin/APC*/Axin*/GSK3
-catenin*/APC*/Axin*/GSK3
-catenin*
-catenin*
+
5
DSHA DSHI
wnt
12

Theoretical Biology and Medical Modelling 2009, 6:13 http://www.tbiomed.com/content/6/1/13
Page 4 of 9
(page number not for citation purposes)
equations were solved for 20000 minutes, or as long as
40000 minutes, to ensure they reached SS.
To examine how selected parameters affect the SS concen-
tration of β-catenin in a modified model, control coeffi-
cients were calculated as well. These were defined by [2]
where β-cat is concentration of β-catenin and k is the
parameter of interest. This coefficient was calculated
numerically by varying the associated parameters by 1%
and solving the kinetic equations over enough time to
obtain SS concentrations, in order to calculate control
coefficients as in [2]. Finally, the wnt signaling effect in a
modified model (see below) was also examined with con-
stant wnt signaling and transient wnt signaling separately,
as in [2]. Initial concentrations in the modified model
were obtained from computations for SS concentrations.
Computed results are presented and discussed in the next
section.
Results and discussion
Effects of GSK3
β
phosphorylation and
β
-catenin
phosphorylations
Initially, I examined these two effects without including
the β-catenin degradation step (step 20 in Figure 1) in
computing β-catenin concentration, and assumed that β-
catenin non-GSK3β phosphorylation involves β-catenin
only (reaction step 19 in lower part of Figure 1). Com-
puted SS concentrations of selected components and their
fold changes are listed in Table 1, along with values in the
original Lee-Heinrich model [2]. The concentration of
GSK3β was reduced to half its original value. The values of
complexes with APC and axin were also reduced to
approximately half their original values while β-catenin*/
APC*/axin*/GSK3β, β-catenin*, and axin remained
approximately the same. The unphosphorylated β-catenin
shows a twofold change and significant enhancement in
its absolute concentration because of its high concentra-
tion compared with most of the other components.
To examine how the kinetic parameters of the added reac-
tion steps affect the kinetics of the wnt pathway, selected
parameters were varied and the rate laws of the modified
model were solved. The SS solutions were examined first.
The effect of varying kG on the total β-catenin level and
free unphosphorylated β-catenin are listed in Table 2. The
higher the kG value, the higher the β-catenin level. This
dependence qualitatively demonstrates the negative role
of GSK3β in wnt/β-catenin signaling. This is because a
decrease in unphosphorylated GSK3β level results in a
decrease in the APC/axin/GSK3β complex. This complex
is a central component of the β-catenin destruction cycle.
Therefore, the level of β-catenin accumulates and
increases. Experimentally, it was found that phosphoryla-
tion of GSK3β led to enhancement of the β-catenin level
in HEK293-TPα cells [18] but not HEK293 cells [19]. The
discrepancy is due to differences in cell type, experimental
conditions, etc. The present result is consistent with the
former cell type. The GSK3β/GSK3β+ ratio is determined
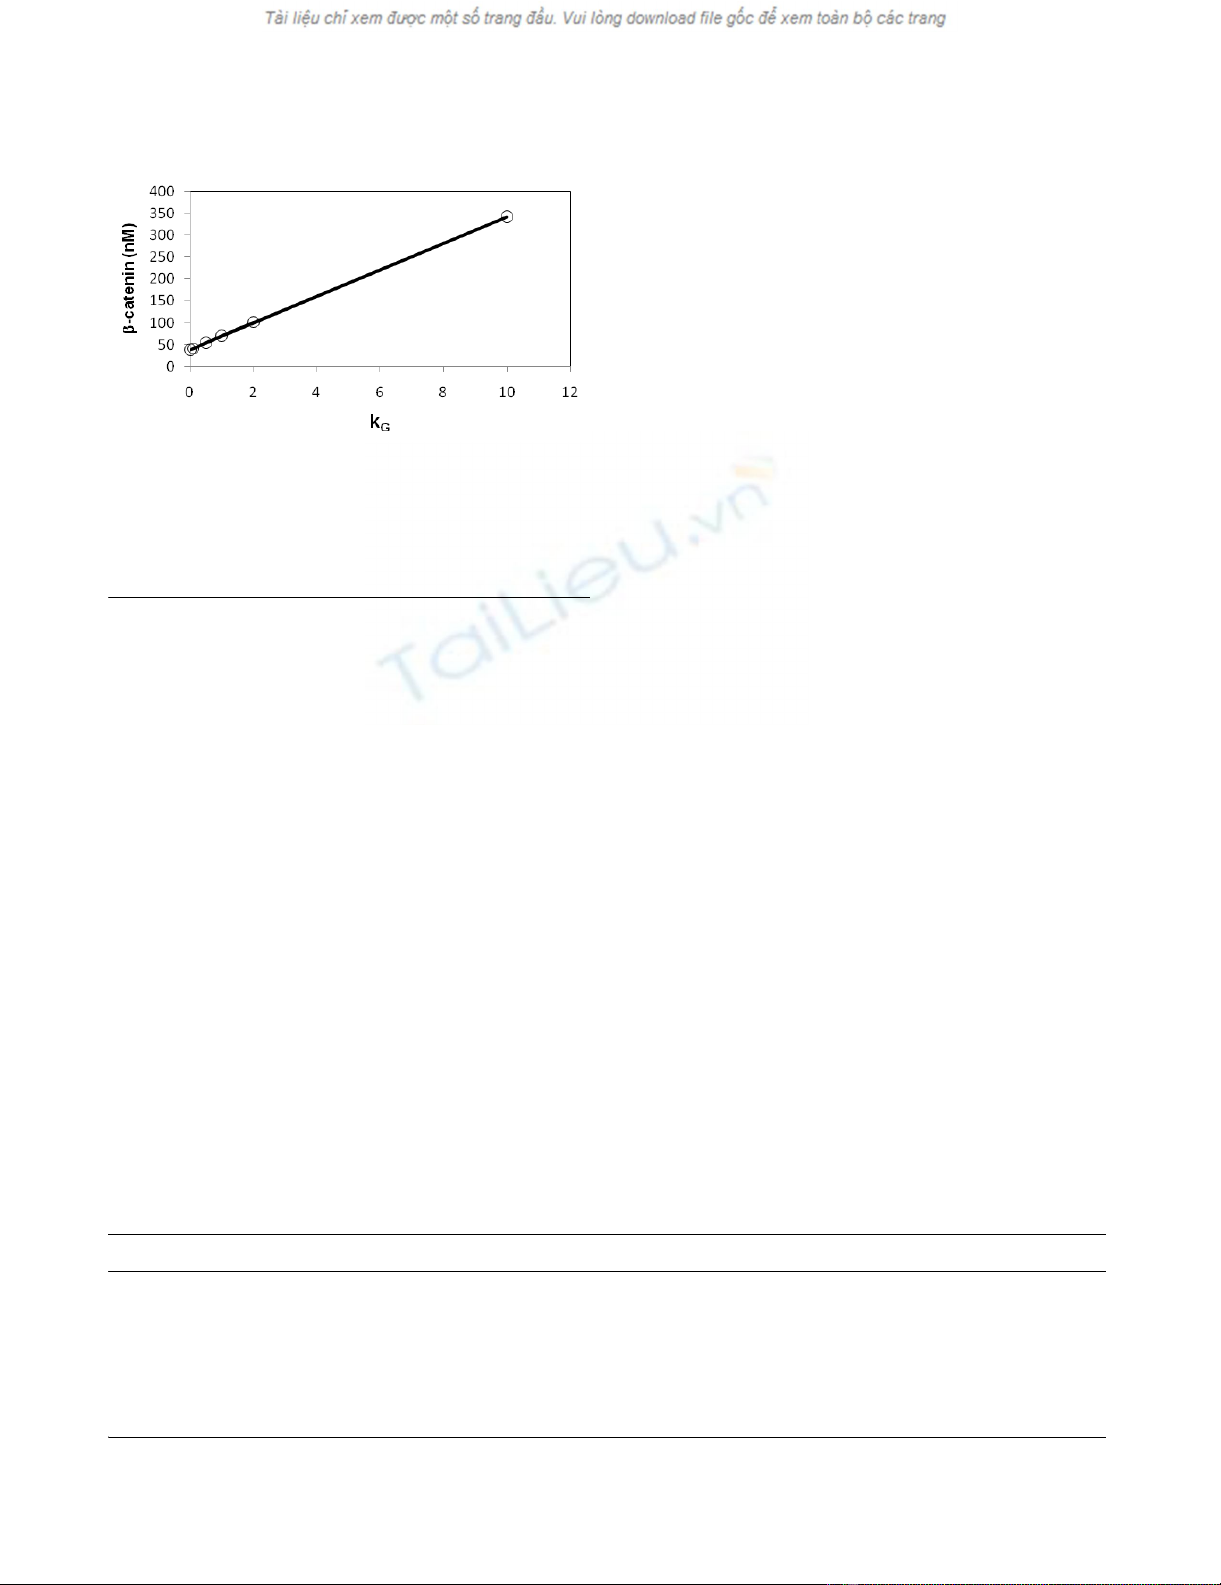
by the kG/kG' ratio. The dependence of the kG/kG' ratio on
β-catenin level is shown in Figure 2, a plot of ratio of β-
catenin level versus kG that represents the strength of
phosphorylation of GSK3β by other kinases. This plot
shows an almost linear dependence. Because of the signif-
icant effect when kG/kG' = 1 (Table 2), this parameter set
was used as a reference parameter set to analyze the effects
of β-catenin non-GSK3β phosphorylation on the wnt
pathway in the discussion below.
In addition to the effects of GSK3β phosphorylation, the
effect of β-catenin non-GSK3β phosphorylation was
examined. I first examined this effect in free unphosphor-
ylated β-catenin (lower part of Figure 1). Analysis of path-
way fluxes showed that no SS concentrations of
Ckcatcatk
k
cat
b
bb
−=−∂−∂/( /)
&&
ββ
β•
Table 1: Steady-state concentrations of selected components in the Lee-Heinrich and modified models
Concentration (nM)
component Lee-Heinrich model modified model Fold change
Dsha00
(APC*/axin*/GSK3β) 0.00966 0.004742 0.491
(APC/axin/GSK3β) 0.00483 0.002362 0.489
(β-catenin*/APC*/axin*/GSK3β) 0.00202 0.001991 0.986
β-catenin* 1.00 0.983341 0.983
β-catenin 25.1 50.3766 2.007
Axin 0.000493 0.000492 0.998
GSK3β50 25 0.500
GSK3β*25
β-catenin+5.03766
(see text for description).
Theoretical Biology and Medical Modelling 2009, 6:13 http://www.tbiomed.com/content/6/1/13
Page 5 of 9
(page number not for citation purposes)
components are affected by the kβ/kβ' ratio, excepting con-
centrations of β-catenin+. This was confirmed by compu-
tations with several values of kβ/kβ'. This is because β-
catenin is one of two components, in addition to axin,
that have flux turnovers in the pathway. Because of this,
addition of reaction step 19 to the Lee-Heinrich model
does not change the flux-in or flux-out at SS. This is in
contrast to phosphorylation of GSK3β, when the kG/kG'
ratio does affect the concentrations of components at SS.
This is because the total amount of GSK3β is conserved
and has no turnover. Therefore, reaction step 18 decreases
the level of unphosphorylated GSK3β and increases the
level of β-catenin. This shows that phosphorylation of
GSK3β has a significant effect on the β-catenin, but β-cat-
enin non-GSK3b phosphorylation has no significant
effect on concentrations of components in the destruction
cycle in this model. In addition to this calculation exam-
ining the effect of non-GSK3β phosphorylation of free
unphosphorylated β-catenin, I also considered this effect
as taking place separately at the β-catenin* shown in the
upper part of Figure 1. Because the pattern of reaction
steps is similar, similar results for the dependence of β-cat-
enin*+ level on the kinetic parameter kβ/kβ' were expected
and obtained in the computations.
In addition to SS concentrations, control coefficients of
selected parameters were also calculated to understand
how these parameters affect SS concentrations. Because
parameter kG in reaction step 18 has a significant effect on
the level of β-catenin, I calculated the control coefficients
of this parameter along with several selected parameters,
k4, k5, and v12. The results are listed in Table 3. The control
coefficient of kG was 0.449, close to half of the control
coefficient of GSK3β, which is 0.89, in the original Lee-
Heinrich model. Other control coefficients do not differ
significantly from the original Lee-Heinrich model. These
results showed that addition of reaction steps 18 and 19
in the modified model does not significantly change the
control coefficients of β-catenin of rate constants k4 and k5
and the influx rate, v12. It does significantly change in the
case of kG in reaction step 18.
Effect of wnt signal
In examining the wnt signaling effect, computations for
the present modified model were carried out similarly to
those in the previous work [2]. Computations with con-
stant wnt signaling of W = 1 and with transient signaling
were carried out separately. For constant signaling, the cal-
culated SS concentrations of selected components when
W = 1 are listed in right part of Table 4. Addition of reac-
tion steps 18 and 19 does not significantly affect the con-
centration of Dsha. A noticeable change is β-catenin,
which is again about twice the value obtained in the orig-
inal Lee-Heinrich model. This is similar to the case with-
out wnt signaling (W = 0). This shows that the effect of
constant wnt signaling in SS in the present modified
model with (W = 1) is similar to the original Lee-Heinrich
model.
Because wnt signaling interacts with the destruction cycle
directly through the the APC/axin/GSK3β complex and
because GSK3β has a significant effect on the β-catenin
level, I examined how varying kG affected the time course
of β-catenin and axin. As in [2], I used an exponential
decay wnt signaling with a decay rate of 20 minutes. The
Dependence of level of β-catenin on GSK3β phosphorylationFigure 2
Dependence of level of β-catenin on GSK3β phospho-
rylation. Circles are computed results. The line shows that
the dependence is almost linear. The other kinetic parame-
ters of added reaction steps, kG' and kβ/kβ', were set equal to
1 and 0.1/1 min-1, respectively.
Table 2: Steady-state concentrations of total and unphosphorylated β-catenin (in nM) under conditions of different kG/kG' ratios
kG/kG' ratio SS concentration of β-catenin in total SS concentration of unphosphorylated β-catenin
10 342.1747 280.744
2 101.1289 75.8736
1 69.83185 50.3766
0.5 53.8597 37.6965
0.1 40.78498 27.5907
0.01 37.78723
34.94785a
25.3219
25.0699a
a values of original Lee-Heinrich model.


![Báo cáo seminar chuyên ngành Công nghệ hóa học và thực phẩm [Mới nhất]](https://cdn.tailieu.vn/images/document/thumbnail/2025/20250711/hienkelvinzoi@gmail.com/135x160/47051752458701.jpg)


